Estimated zip code population in 2022: 30,771
Zip code population in 2010: 26,999
Zip code population in 2000: 25,847
Houses and condos: 14,504
Renter-occupied apartments: 11,517
% of renters here:
86%State:
46%
March 2022 cost of living index in zip code 10030: 159.5
(very high, U.S. average is 100)
Land area: 0.3
sq. mi.
Water area: 0.0
sq. mi.
Population density: 110,312 people per square mile (very high).
OSM Map
General Map
Google Map
MSN Map
OSM Map
General Map
Google Map
MSN Map
OSM Map
General Map
Google Map
MSN Map
OSM Map
General Map
Google Map
MSN Map
Please wait while loading the map...
Real estate property taxes paid for housing units in 2022:
This zip code:
0.7% ($5,394)New York:
1.5% ($6,180)
Median real estate property taxes paid for housing units with mortgages in 2022: $3,628 (0.4%)
Median real estate property taxes paid for housing units with no mortgage in 2022: $6,835 (1.4%)
Profiles of local businesses
Business Search - 14 Million verified businesses
Males: 14,267 Females: 16,504
For population 25 years and over in 10030:
High school or higher: 78.3%Bachelor's degree or higher: 36.3%Graduate or professional degree: 17.0%Unemployed: 8.4%Mean travel time to work (commute): 38.6 minutes
For population 15 years and over in 10030:
Never married: 55.1%Now married: 27.7%Separated: 4.2%Widowed: 4.0%Divorced: 9.2%
Zip code 10030 compared to state average:
Median household income below state average. Median house value above state average. Black race population percentage significantly above state average. Renting percentage above state average. Number of rooms per house below state average. 16,551 53.8% Black 9,125 29.7% Hispanic or Latino 2,735 8.9% White 1,116 3.6% Asian 930 3.0% Two or more races 302 1.0% Some other race 6 0.02% American Indian 2 0.01% Native Hawaiian and Other
Data:
Median household income ($)
Median household income (% change since 2000)
Household income diversity
Ratio of average income to average house value (%)
Ratio of average income to average rent
Median household income ($) - White
Median household income ($) - Black or African American
Median household income ($) - Asian
Median household income ($) - Hispanic or Latino
Median household income ($) - American Indian and Alaska Native
Median household income ($) - Multirace
Median household income ($) - Other Race
Median household income for houses/condos with a mortgage ($)
Median household income for apartments without a mortgage ($)
Races - White alone (%)
Races - White alone (% change since 2000)
Races - Black alone (%)
Races - Black alone (% change since 2000)
Races - American Indian alone (%)
Races - American Indian alone (% change since 2000)
Races - Asian alone (%)
Races - Asian alone (% change since 2000)
Races - Hispanic (%)
Races - Hispanic (% change since 2000)
Races - Native Hawaiian and Other Pacific Islander alone (%)
Races - Native Hawaiian and Other Pacific Islander alone (% change since 2000)
Races - Two or more races (%)
Races - Two or more races (% change since 2000)
Races - Other race alone (%)
Races - Other race alone (% change since 2000)
Racial diversity
Unemployment (%)
Unemployment (% change since 2000)
Unemployment (%) - White
Unemployment (%) - Black or African American
Unemployment (%) - Asian
Unemployment (%) - Hispanic or Latino
Unemployment (%) - American Indian and Alaska Native
Unemployment (%) - Multirace
Unemployment (%) - Other Race
Population density (people per square mile)
Population - Males (%)
Population - Females (%)
Population - Males (%) - White
Population - Males (%) - Black or African American
Population - Males (%) - Asian
Population - Males (%) - Hispanic or Latino
Population - Males (%) - American Indian and Alaska Native
Population - Males (%) - Multirace
Population - Males (%) - Other Race
Population - Females (%) - White
Population - Females (%) - Black or African American
Population - Females (%) - Asian
Population - Females (%) - Hispanic or Latino
Population - Females (%) - American Indian and Alaska Native
Population - Females (%) - Multirace
Population - Females (%) - Other Race
Coronavirus confirmed cases (Apr 27, 2024)
Deaths caused by coronavirus (Apr 27, 2024)
Coronavirus confirmed cases (per 100k population) (Apr 27, 2024)
Deaths caused by coronavirus (per 100k population) (Apr 27, 2024)
Daily increase in number of cases (Apr 27, 2024)
Weekly increase in number of cases (Apr 27, 2024)
Cases doubled (in days) (Apr 27, 2024)
Hospitalized patients (Apr 18, 2022)
Negative test results (Apr 18, 2022)
Total test results (Apr 18, 2022)
COVID Vaccine doses distributed (per 100k population) (Sep 19, 2023)
COVID Vaccine doses administered (per 100k population) (Sep 19, 2023)
COVID Vaccine doses distributed (Sep 19, 2023)
COVID Vaccine doses administered (Sep 19, 2023)
Likely homosexual households (%)
Likely homosexual households (% change since 2000)
Likely homosexual households - Lesbian couples (%)
Likely homosexual households - Lesbian couples (% change since 2000)
Likely homosexual households - Gay men (%)
Likely homosexual households - Gay men (% change since 2000)
Cost of living index
Median gross rent ($)
Median contract rent ($)
Median monthly housing costs ($)
Median house or condo value ($)
Median house or condo value ($ change since 2000)
Mean house or condo value by units in structure - 1, detached ($)
Mean house or condo value by units in structure - 1, attached ($)
Mean house or condo value by units in structure - 2 ($)
Mean house or condo value by units in structure by units in structure - 3 or 4 ($)
Mean house or condo value by units in structure - 5 or more ($)
Mean house or condo value by units in structure - Boat, RV, van, etc. ($)
Mean house or condo value by units in structure - Mobile home ($)
Median house or condo value ($) - White
Median house or condo value ($) - Black or African American
Median house or condo value ($) - Asian
Median house or condo value ($) - Hispanic or Latino
Median house or condo value ($) - American Indian and Alaska Native
Median house or condo value ($) - Multirace
Median house or condo value ($) - Other Race
Median resident age
Resident age diversity
Median resident age - Males
Median resident age - Females
Median resident age - White
Median resident age - Black or African American
Median resident age - Asian
Median resident age - Hispanic or Latino
Median resident age - American Indian and Alaska Native
Median resident age - Multirace
Median resident age - Other Race
Median resident age - Males - White
Median resident age - Males - Black or African American
Median resident age - Males - Asian
Median resident age - Males - Hispanic or Latino
Median resident age - Males - American Indian and Alaska Native
Median resident age - Males - Multirace
Median resident age - Males - Other Race
Median resident age - Females - White
Median resident age - Females - Black or African American
Median resident age - Females - Asian
Median resident age - Females - Hispanic or Latino
Median resident age - Females - American Indian and Alaska Native
Median resident age - Females - Multirace
Median resident age - Females - Other Race
Commute - mean travel time to work (minutes)
Travel time to work - Less than 5 minutes (%)
Travel time to work - Less than 5 minutes (% change since 2000)
Travel time to work - 5 to 9 minutes (%)
Travel time to work - 5 to 9 minutes (% change since 2000)
Travel time to work - 10 to 19 minutes (%)
Travel time to work - 10 to 19 minutes (% change since 2000)
Travel time to work - 20 to 29 minutes (%)
Travel time to work - 20 to 29 minutes (% change since 2000)
Travel time to work - 30 to 39 minutes (%)
Travel time to work - 30 to 39 minutes (% change since 2000)
Travel time to work - 40 to 59 minutes (%)
Travel time to work - 40 to 59 minutes (% change since 2000)
Travel time to work - 60 to 89 minutes (%)
Travel time to work - 60 to 89 minutes (% change since 2000)
Travel time to work - 90 or more minutes (%)
Travel time to work - 90 or more minutes (% change since 2000)
Marital status - Never married (%)
Marital status - Now married (%)
Marital status - Separated (%)
Marital status - Widowed (%)
Marital status - Divorced (%)
Median family income ($)
Median family income (% change since 2000)
Median non-family income ($)
Median non-family income (% change since 2000)
Median per capita income ($)
Median per capita income (% change since 2000)
Median family income ($) - White
Median family income ($) - Black or African American
Median family income ($) - Asian
Median family income ($) - Hispanic or Latino
Median family income ($) - American Indian and Alaska Native
Median family income ($) - Multirace
Median family income ($) - Other Race
Median year house/condo built
Median year apartment built
Year house built - Built 2005 or later (%)
Year house built - Built 2000 to 2004 (%)
Year house built - Built 1990 to 1999 (%)
Year house built - Built 1980 to 1989 (%)
Year house built - Built 1970 to 1979 (%)
Year house built - Built 1960 to 1969 (%)
Year house built - Built 1950 to 1959 (%)
Year house built - Built 1940 to 1949 (%)
Year house built - Built 1939 or earlier (%)
Average household size
Household density (households per square mile)
Average household size - White
Average household size - Black or African American
Average household size - Asian
Average household size - Hispanic or Latino
Average household size - American Indian and Alaska Native
Average household size - Multirace
Average household size - Other Race
Occupied housing units (%)
Vacant housing units (%)
Owner occupied housing units (%)
Renter occupied housing units (%)
Vacancy status - For rent (%)
Vacancy status - For sale only (%)
Vacancy status - Rented or sold, not occupied (%)
Vacancy status - For seasonal, recreational, or occasional use (%)
Vacancy status - For migrant workers (%)
Vacancy status - Other vacant (%)
Residents with income below the poverty level (%)
Residents with income below 50% of the poverty level (%)
Children below poverty level (%)
Poor families by family type - Married-couple family (%)
Poor families by family type - Male, no wife present (%)
Poor families by family type - Female, no husband present (%)
Poverty status for native-born residents (%)
Poverty status for foreign-born residents (%)
Poverty among high school graduates not in families (%)
Poverty among people who did not graduate high school not in families (%)
Residents with income below the poverty level (%) - White
Residents with income below the poverty level (%) - Black or African American
Residents with income below the poverty level (%) - Asian
Residents with income below the poverty level (%) - Hispanic or Latino
Residents with income below the poverty level (%) - American Indian and Alaska Native
Residents with income below the poverty level (%) - Multirace
Residents with income below the poverty level (%) - Other Race
Air pollution - Air Quality Index (AQI)
Air pollution - CO
Air pollution - NO2
Air pollution - SO2
Air pollution - Ozone
Air pollution - PM10
Air pollution - PM25
Air pollution - Pb
Crime - Murders per 100,000 population
Crime - Rapes per 100,000 population
Crime - Robberies per 100,000 population
Crime - Assaults per 100,000 population
Crime - Burglaries per 100,000 population
Crime - Thefts per 100,000 population
Crime - Auto thefts per 100,000 population
Crime - Arson per 100,000 population
Crime - City-data.com crime index
Crime - Violent crime index
Crime - Property crime index
Crime - Murders per 100,000 population (5 year average)
Crime - Rapes per 100,000 population (5 year average)
Crime - Robberies per 100,000 population (5 year average)
Crime - Assaults per 100,000 population (5 year average)
Crime - Burglaries per 100,000 population (5 year average)
Crime - Thefts per 100,000 population (5 year average)
Crime - Auto thefts per 100,000 population (5 year average)
Crime - Arson per 100,000 population (5 year average)
Crime - City-data.com crime index (5 year average)
Crime - Violent crime index (5 year average)
Crime - Property crime index (5 year average)
1996 Presidential Elections Results (%) - Democratic Party (Clinton)
1996 Presidential Elections Results (%) - Republican Party (Dole)
1996 Presidential Elections Results (%) - Other
2000 Presidential Elections Results (%) - Democratic Party (Gore)
2000 Presidential Elections Results (%) - Republican Party (Bush)
2000 Presidential Elections Results (%) - Other
2004 Presidential Elections Results (%) - Democratic Party (Kerry)
2004 Presidential Elections Results (%) - Republican Party (Bush)
2004 Presidential Elections Results (%) - Other
2008 Presidential Elections Results (%) - Democratic Party (Obama)
2008 Presidential Elections Results (%) - Republican Party (McCain)
2008 Presidential Elections Results (%) - Other
2012 Presidential Elections Results (%) - Democratic Party (Obama)
2012 Presidential Elections Results (%) - Republican Party (Romney)
2012 Presidential Elections Results (%) - Other
2016 Presidential Elections Results (%) - Democratic Party (Clinton)
2016 Presidential Elections Results (%) - Republican Party (Trump)
2016 Presidential Elections Results (%) - Other
2020 Presidential Elections Results (%) - Democratic Party (Biden)
2020 Presidential Elections Results (%) - Republican Party (Trump)
2020 Presidential Elections Results (%) - Other
Ancestries Reported - Arab (%)
Ancestries Reported - Czech (%)
Ancestries Reported - Danish (%)
Ancestries Reported - Dutch (%)
Ancestries Reported - English (%)
Ancestries Reported - French (%)
Ancestries Reported - French Canadian (%)
Ancestries Reported - German (%)
Ancestries Reported - Greek (%)
Ancestries Reported - Hungarian (%)
Ancestries Reported - Irish (%)
Ancestries Reported - Italian (%)
Ancestries Reported - Lithuanian (%)
Ancestries Reported - Norwegian (%)
Ancestries Reported - Polish (%)
Ancestries Reported - Portuguese (%)
Ancestries Reported - Russian (%)
Ancestries Reported - Scotch-Irish (%)
Ancestries Reported - Scottish (%)
Ancestries Reported - Slovak (%)
Ancestries Reported - Subsaharan African (%)
Ancestries Reported - Swedish (%)
Ancestries Reported - Swiss (%)
Ancestries Reported - Ukrainian (%)
Ancestries Reported - United States (%)
Ancestries Reported - Welsh (%)
Ancestries Reported - West Indian (%)
Ancestries Reported - Other (%)
Educational Attainment - No schooling completed (%)
Educational Attainment - Less than high school (%)
Educational Attainment - High school or equivalent (%)
Educational Attainment - Less than 1 year of college (%)
Educational Attainment - 1 or more years of college (%)
Educational Attainment - Associate degree (%)
Educational Attainment - Bachelor's degree (%)
Educational Attainment - Master's degree (%)
Educational Attainment - Professional school degree (%)
Educational Attainment - Doctorate degree (%)
School Enrollment - Nursery, preschool (%)
School Enrollment - Kindergarten (%)
School Enrollment - Grade 1 to 4 (%)
School Enrollment - Grade 5 to 8 (%)
School Enrollment - Grade 9 to 12 (%)
School Enrollment - College undergrad (%)
School Enrollment - Graduate or professional (%)
School Enrollment - Not enrolled in school (%)
School enrollment - Public schools (%)
School enrollment - Private schools (%)
School enrollment - Not enrolled (%)
Median number of rooms in houses and condos
Median number of rooms in apartments
Housing units lacking complete plumbing facilities (%)
Housing units lacking complete kitchen facilities (%)
Density of houses
Urban houses (%)
Rural houses (%)
Households with people 60 years and over (%)
Households with people 65 years and over (%)
Households with people 75 years and over (%)
Households with one or more nonrelatives (%)
Households with no nonrelatives (%)
Population in households (%)
Family households (%)
Nonfamily households (%)
Population in families (%)
Family households with own children (%)
Median number of bedrooms in owner occupied houses
Mean number of bedrooms in owner occupied houses
Median number of bedrooms in renter occupied houses
Mean number of bedrooms in renter occupied houses
Median number of vehichles in owner occupied houses
Mean number of vehichles in owner occupied houses
Median number of vehichles in renter occupied houses
Mean number of vehichles in renter occupied houses
Mortgage status - with mortgage (%)
Mortgage status - with second mortgage (%)
Mortgage status - with home equity loan (%)
Mortgage status - with both second mortgage and home equity loan (%)
Mortgage status - without a mortgage (%)
Average family size
Average family size - White
Average family size - Black or African American
Average family size - Asian
Average family size - Hispanic or Latino
Average family size - American Indian and Alaska Native
Average family size - Multirace
Average family size - Other Race
Geographical mobility - Same house 1 year ago (%)
Geographical mobility - Moved within same county (%)
Geographical mobility - Moved from different county within same state (%)
Geographical mobility - Moved from different state (%)
Geographical mobility - Moved from abroad (%)
Place of birth - Born in state of residence (%)
Place of birth - Born in other state (%)
Place of birth - Native, outside of US (%)
Place of birth - Foreign born (%)
Housing units in structures - 1, detached (%)
Housing units in structures - 1, attached (%)
Housing units in structures - 2 (%)
Housing units in structures - 3 or 4 (%)
Housing units in structures - 5 to 9 (%)
Housing units in structures - 10 to 19 (%)
Housing units in structures - 20 to 49 (%)
Housing units in structures - 50 or more (%)
Housing units in structures - Mobile home (%)
Housing units in structures - Boat, RV, van, etc. (%)
House/condo owner moved in on average (years ago)
Renter moved in on average (years ago)
Year householder moved into unit - Moved in 1999 to March 2000 (%)
Year householder moved into unit - Moved in 1995 to 1998 (%)
Year householder moved into unit - Moved in 1990 to 1994 (%)
Year householder moved into unit - Moved in 1980 to 1989 (%)
Year householder moved into unit - Moved in 1970 to 1979 (%)
Year householder moved into unit - Moved in 1969 or earlier (%)
Means of transportation to work - Drove car alone (%)
Means of transportation to work - Carpooled (%)
Means of transportation to work - Public transportation (%)
Means of transportation to work - Bus or trolley bus (%)
Means of transportation to work - Streetcar or trolley car (%)
Means of transportation to work - Subway or elevated (%)
Means of transportation to work - Railroad (%)
Means of transportation to work - Ferryboat (%)
Means of transportation to work - Taxicab (%)
Means of transportation to work - Motorcycle (%)
Means of transportation to work - Bicycle (%)
Means of transportation to work - Walked (%)
Means of transportation to work - Other means (%)
Working at home (%)
Industry diversity
Most Common Industries - Agriculture, forestry, fishing and hunting, and mining (%)
Most Common Industries - Agriculture, forestry, fishing and hunting (%)
Most Common Industries - Mining, quarrying, and oil and gas extraction (%)
Most Common Industries - Construction (%)
Most Common Industries - Manufacturing (%)
Most Common Industries - Wholesale trade (%)
Most Common Industries - Retail trade (%)
Most Common Industries - Transportation and warehousing, and utilities (%)
Most Common Industries - Transportation and warehousing (%)
Most Common Industries - Utilities (%)
Most Common Industries - Information (%)
Most Common Industries - Finance and insurance, and real estate and rental and leasing (%)
Most Common Industries - Finance and insurance (%)
Most Common Industries - Real estate and rental and leasing (%)
Most Common Industries - Professional, scientific, and management, and administrative and waste management services (%)
Most Common Industries - Professional, scientific, and technical services (%)
Most Common Industries - Management of companies and enterprises (%)
Most Common Industries - Administrative and support and waste management services (%)
Most Common Industries - Educational services, and health care and social assistance (%)
Most Common Industries - Educational services (%)
Most Common Industries - Health care and social assistance (%)
Most Common Industries - Arts, entertainment, and recreation, and accommodation and food services (%)
Most Common Industries - Arts, entertainment, and recreation (%)
Most Common Industries - Accommodation and food services (%)
Most Common Industries - Other services, except public administration (%)
Most Common Industries - Public administration (%)
Occupation diversity
Most Common Occupations - Management, business, science, and arts occupations (%)
Most Common Occupations - Management, business, and financial occupations (%)
Most Common Occupations - Management occupations (%)
Most Common Occupations - Business and financial operations occupations (%)
Most Common Occupations - Computer, engineering, and science occupations (%)
Most Common Occupations - Computer and mathematical occupations (%)
Most Common Occupations - Architecture and engineering occupations (%)
Most Common Occupations - Life, physical, and social science occupations (%)
Most Common Occupations - Education, legal, community service, arts, and media occupations (%)
Most Common Occupations - Community and social service occupations (%)
Most Common Occupations - Legal occupations (%)
Most Common Occupations - Education, training, and library occupations (%)
Most Common Occupations - Arts, design, entertainment, sports, and media occupations (%)
Most Common Occupations - Healthcare practitioners and technical occupations (%)
Most Common Occupations - Health diagnosing and treating practitioners and other technical occupations (%)
Most Common Occupations - Health technologists and technicians (%)
Most Common Occupations - Service occupations (%)
Most Common Occupations - Healthcare support occupations (%)
Most Common Occupations - Protective service occupations (%)
Most Common Occupations - Fire fighting and prevention, and other protective service workers including supervisors (%)
Most Common Occupations - Law enforcement workers including supervisors (%)
Most Common Occupations - Food preparation and serving related occupations (%)
Most Common Occupations - Building and grounds cleaning and maintenance occupations (%)
Most Common Occupations - Personal care and service occupations (%)
Most Common Occupations - Sales and office occupations (%)
Most Common Occupations - Sales and related occupations (%)
Most Common Occupations - Office and administrative support occupations (%)
Most Common Occupations - Natural resources, construction, and maintenance occupations (%)
Most Common Occupations - Farming, fishing, and forestry occupations (%)
Most Common Occupations - Construction and extraction occupations (%)
Most Common Occupations - Installation, maintenance, and repair occupations (%)
Most Common Occupations - Production, transportation, and material moving occupations (%)
Most Common Occupations - Production occupations (%)
Most Common Occupations - Transportation occupations (%)
Most Common Occupations - Material moving occupations (%)
People in Group quarters - Institutionalized population (%)
People in Group quarters - Correctional institutions (%)
People in Group quarters - Federal prisons and detention centers (%)
People in Group quarters - Halfway houses (%)
People in Group quarters - Local jails and other confinement facilities (including police lockups) (%)
People in Group quarters - Military disciplinary barracks (%)
People in Group quarters - State prisons (%)
People in Group quarters - Other types of correctional institutions (%)
People in Group quarters - Nursing homes (%)
People in Group quarters - Hospitals/wards, hospices, and schools for the handicapped (%)
People in Group quarters - Hospitals/wards and hospices for chronically ill (%)
People in Group quarters - Hospices or homes for chronically ill (%)
People in Group quarters - Military hospitals or wards for chronically ill (%)
People in Group quarters - Other hospitals or wards for chronically ill (%)
People in Group quarters - Hospitals or wards for drug/alcohol abuse (%)
People in Group quarters - Mental (Psychiatric) hospitals or wards (%)
People in Group quarters - Schools, hospitals, or wards for the mentally retarded (%)
People in Group quarters - Schools, hospitals, or wards for the physically handicapped (%)
People in Group quarters - Institutions for the deaf (%)
People in Group quarters - Institutions for the blind (%)
People in Group quarters - Orthopedic wards and institutions for the physically handicapped (%)
People in Group quarters - Wards in general hospitals for patients who have no usual home elsewhere (%)
People in Group quarters - Wards in military hospitals for patients who have no usual home elsewhere (%)
People in Group quarters - Juvenile institutions (%)
People in Group quarters - Long-term care (%)
People in Group quarters - Homes for abused, dependent, and neglected children (%)
People in Group quarters - Residential treatment centers for emotionally disturbed children (%)
People in Group quarters - Training schools for juvenile delinquents (%)
People in Group quarters - Short-term care, detention or diagnostic centers for delinquent children (%)
People in Group quarters - Type of juvenile institution unknown (%)
People in Group quarters - Noninstitutionalized population (%)
People in Group quarters - College dormitories (includes college quarters off campus) (%)
People in Group quarters - Military quarters (%)
People in Group quarters - On base (%)
People in Group quarters - Barracks, unaccompanied personnel housing (UPH), (Enlisted/Officer), ;and similar group living quarters for military personnel (%)
People in Group quarters - Transient quarters for temporary residents (%)
People in Group quarters - Military ships (%)
People in Group quarters - Group homes (%)
People in Group quarters - Homes or halfway houses for drug/alcohol abuse (%)
People in Group quarters - Homes for the mentally ill (%)
People in Group quarters - Homes for the mentally retarded (%)
People in Group quarters - Homes for the physically handicapped (%)
People in Group quarters - Other group homes (%)
People in Group quarters - Religious group quarters (%)
People in Group quarters - Dormitories (%)
People in Group quarters - Agriculture workers' dormitories on farms (%)
People in Group quarters - Job Corps and vocational training facilities (%)
People in Group quarters - Other workers' dormitories (%)
People in Group quarters - Crews of maritime vessels (%)
People in Group quarters - Other nonhousehold living situations (%)
People in Group quarters - Other noninstitutional group quarters (%)
Residents speaking English at home (%)
Residents speaking English at home - Born in the United States (%)
Residents speaking English at home - Native, born elsewhere (%)
Residents speaking English at home - Foreign born (%)
Residents speaking Spanish at home (%)
Residents speaking Spanish at home - Born in the United States (%)
Residents speaking Spanish at home - Native, born elsewhere (%)
Residents speaking Spanish at home - Foreign born (%)
Residents speaking other language at home (%)
Residents speaking other language at home - Born in the United States (%)
Residents speaking other language at home - Native, born elsewhere (%)
Residents speaking other language at home - Foreign born (%)
Class of Workers - Employee of private company (%)
Class of Workers - Self-employed in own incorporated business (%)
Class of Workers - Private not-for-profit wage and salary workers (%)
Class of Workers - Local government workers (%)
Class of Workers - State government workers (%)
Class of Workers - Federal government workers (%)
Class of Workers - Self-employed workers in own not incorporated business and Unpaid family workers (%)
House heating fuel used in houses and condos - Utility gas (%)
House heating fuel used in houses and condos - Bottled, tank, or LP gas (%)
House heating fuel used in houses and condos - Electricity (%)
House heating fuel used in houses and condos - Fuel oil, kerosene, etc. (%)
House heating fuel used in houses and condos - Coal or coke (%)
House heating fuel used in houses and condos - Wood (%)
House heating fuel used in houses and condos - Solar energy (%)
House heating fuel used in houses and condos - Other fuel (%)
House heating fuel used in houses and condos - No fuel used (%)
House heating fuel used in apartments - Utility gas (%)
House heating fuel used in apartments - Bottled, tank, or LP gas (%)
House heating fuel used in apartments - Electricity (%)
House heating fuel used in apartments - Fuel oil, kerosene, etc. (%)
House heating fuel used in apartments - Coal or coke (%)
House heating fuel used in apartments - Wood (%)
House heating fuel used in apartments - Solar energy (%)
House heating fuel used in apartments - Other fuel (%)
House heating fuel used in apartments - No fuel used (%)
Armed forces status - In Armed Forces (%)
Armed forces status - Civilian (%)
Armed forces status - Civilian - Veteran (%)
Armed forces status - Civilian - Nonveteran (%)
Fatal accidents locations in years 2005-2021
Fatal accidents locations in 2005
Fatal accidents locations in 2006
Fatal accidents locations in 2007
Fatal accidents locations in 2008
Fatal accidents locations in 2009
Fatal accidents locations in 2010
Fatal accidents locations in 2011
Fatal accidents locations in 2012
Fatal accidents locations in 2013
Fatal accidents locations in 2014
Fatal accidents locations in 2015
Fatal accidents locations in 2016
Fatal accidents locations in 2017
Fatal accidents locations in 2018
Fatal accidents locations in 2019
Fatal accidents locations in 2020
Fatal accidents locations in 2021
Alcohol use - People drinking some alcohol every month (%)
Alcohol use - People not drinking at all (%)
Alcohol use - Average days/month drinking alcohol
Alcohol use - Average drinks/week
Alcohol use - Average days/year people drink much
Audiometry - Average condition of hearing (%)
Audiometry - People that can hear a whisper from across a quiet room (%)
Audiometry - People that can hear normal voice from across a quiet room (%)
Audiometry - Ears ringing, roaring, buzzing (%)
Audiometry - Had a job exposure to loud noise (%)
Audiometry - Had off-work exposure to loud noise (%)
Blood Pressure & Cholesterol - Has high blood pressure (%)
Blood Pressure & Cholesterol - Checking blood pressure at home (%)
Blood Pressure & Cholesterol - Frequently checking blood cholesterol (%)
Blood Pressure & Cholesterol - Has high cholesterol level (%)
Consumer Behavior - Money monthly spent on food at supermarket/grocery store
Consumer Behavior - Money monthly spent on food at other stores
Consumer Behavior - Money monthly spent on eating out
Consumer Behavior - Money monthly spent on carryout/delivered foods
Consumer Behavior - Income spent on food at supermarket/grocery store (%)
Consumer Behavior - Income spent on food at other stores (%)
Consumer Behavior - Income spent on eating out (%)
Consumer Behavior - Income spent on carryout/delivered foods (%)
Current Health Status - General health condition (%)
Current Health Status - Blood donors (%)
Current Health Status - Has blood ever tested for HIV virus (%)
Current Health Status - Left-handed people (%)
Dermatology - People using sunscreen (%)
Diabetes - Diabetics (%)
Diabetes - Had a blood test for high blood sugar (%)
Diabetes - People taking insulin (%)
Diet Behavior & Nutrition - Diet health (%)
Diet Behavior & Nutrition - Milk product consumption (# of products/month)
Diet Behavior & Nutrition - Meals not home prepared (#/week)
Diet Behavior & Nutrition - Meals from fast food or pizza place (#/week)
Diet Behavior & Nutrition - Ready-to-eat foods (#/month)
Diet Behavior & Nutrition - Frozen meals/pizza (#/month)
Drug Use - People that ever used marijuana or hashish (%)
Drug Use - Ever used hard drugs (%)
Drug Use - Ever used any form of cocaine (%)
Drug Use - Ever used heroin (%)
Drug Use - Ever used methamphetamine (%)
Health Insurance - People covered by health insurance (%)
Kidney Conditions-Urology - Avg. # of times urinating at night
Medical Conditions - People with asthma (%)
Medical Conditions - People with anemia (%)
Medical Conditions - People with psoriasis (%)
Medical Conditions - People with overweight (%)
Medical Conditions - Elderly people having difficulties in thinking or remembering (%)
Medical Conditions - People who ever received blood transfusion (%)
Medical Conditions - People having trouble seeing even with glass/contacts (%)
Medical Conditions - People with arthritis (%)
Medical Conditions - People with gout (%)
Medical Conditions - People with congestive heart failure (%)
Medical Conditions - People with coronary heart disease (%)
Medical Conditions - People with angina pectoris (%)
Medical Conditions - People who ever had heart attack (%)
Medical Conditions - People who ever had stroke (%)
Medical Conditions - People with emphysema (%)
Medical Conditions - People with thyroid problem (%)
Medical Conditions - People with chronic bronchitis (%)
Medical Conditions - People with any liver condition (%)
Medical Conditions - People who ever had cancer or malignancy (%)
Mental Health - People who have little interest in doing things (%)
Mental Health - People feeling down, depressed, or hopeless (%)
Mental Health - People who have trouble sleeping or sleeping too much (%)
Mental Health - People feeling tired or having little energy (%)
Mental Health - People with poor appetite or overeating (%)
Mental Health - People feeling bad about themself (%)
Mental Health - People who have trouble concentrating on things (%)
Mental Health - People moving or speaking slowly or too fast (%)
Mental Health - People having thoughts they would be better off dead (%)
Oral Health - Average years since last visit a dentist
Oral Health - People embarrassed because of mouth (%)
Oral Health - People with gum disease (%)
Oral Health - General health of teeth and gums (%)
Oral Health - Average days a week using dental floss/device
Oral Health - Average days a week using mouthwash for dental problem
Oral Health - Average number of teeth
Pesticide Use - Households using pesticides to control insects (%)
Pesticide Use - Households using pesticides to kill weeds (%)
Physical Activity - People doing vigorous-intensity work activities (%)
Physical Activity - People doing moderate-intensity work activities (%)
Physical Activity - People walking or bicycling (%)
Physical Activity - People doing vigorous-intensity recreational activities (%)
Physical Activity - People doing moderate-intensity recreational activities (%)
Physical Activity - Average hours a day doing sedentary activities
Physical Activity - Average hours a day watching TV or videos
Physical Activity - Average hours a day using computer
Physical Functioning - People having limitations keeping them from working (%)
Physical Functioning - People limited in amount of work they can do (%)
Physical Functioning - People that need special equipment to walk (%)
Physical Functioning - People experiencing confusion/memory problems (%)
Physical Functioning - People requiring special healthcare equipment (%)
Prescription Medications - Average number of prescription medicines taking
Preventive Aspirin Use - Adults 40+ taking low-dose aspirin (%)
Reproductive Health - Vaginal deliveries (%)
Reproductive Health - Cesarean deliveries (%)
Reproductive Health - Deliveries resulted in a live birth (%)
Reproductive Health - Pregnancies resulted in a delivery (%)
Reproductive Health - Women breastfeeding newborns (%)
Reproductive Health - Women that had a hysterectomy (%)
Reproductive Health - Women that had both ovaries removed (%)
Reproductive Health - Women that have ever taken birth control pills (%)
Reproductive Health - Women taking birth control pills (%)
Reproductive Health - Women that have ever used Depo-Provera or injectables (%)
Reproductive Health - Women that have ever used female hormones (%)
Sexual Behavior - People 18+ that ever had sex (vaginal, anal, or oral) (%)
Sexual Behavior - Males 18+ that ever had vaginal sex with a woman (%)
Sexual Behavior - Males 18+ that ever performed oral sex on a woman (%)
Sexual Behavior - Males 18+ that ever had anal sex with a woman (%)
Sexual Behavior - Males 18+ that ever had any sex with a man (%)
Sexual Behavior - Females 18+ that ever had vaginal sex with a man (%)
Sexual Behavior - Females 18+ that ever performed oral sex on a man (%)
Sexual Behavior - Females 18+ that ever had anal sex with a man (%)
Sexual Behavior - Females 18+ that ever had any kind of sex with a woman (%)
Sexual Behavior - Average age people first had sex
Sexual Behavior - Average number of female sex partners in lifetime (males 18+)
Sexual Behavior - Average number of female vaginal sex partners in lifetime (males 18+)
Sexual Behavior - Average age people first performed oral sex on a woman (18+)
Sexual Behavior - Average number of woman performed oral sex on in lifetime (18+)
Sexual Behavior - Average number of male sex partners in lifetime (males 18+)
Sexual Behavior - Average number of male anal sex partners in lifetime (males 18+)
Sexual Behavior - Average age people first performed oral sex on a man (18+)
Sexual Behavior - Average number of male oral sex partners in lifetime (18+)
Sexual Behavior - People using protection when performing oral sex (%)
Sexual Behavior - Average number of times people have vaginal or anal sex a year
Sexual Behavior - People having sex without condom (%)
Sexual Behavior - Average number of male sex partners in lifetime (females 18+)
Sexual Behavior - Average number of male vaginal sex partners in lifetime (females 18+)
Sexual Behavior - Average number of female sex partners in lifetime (females 18+)
Sexual Behavior - Circumcised males 18+ (%)
Sleep Disorders - Average hours sleeping at night
Sleep Disorders - People that has trouble sleeping (%)
Smoking-Cigarette Use - People smoking cigarettes (%)
Taste & Smell - People 40+ having problems with smell (%)
Taste & Smell - People 40+ having problems with taste (%)
Taste & Smell - People 40+ that ever had wisdom teeth removed (%)
Taste & Smell - People 40+ that ever had tonsils teeth removed (%)
Taste & Smell - People 40+ that ever had a loss of consciousness because of a head injury (%)
Taste & Smell - People 40+ that ever had a broken nose or other serious injury to face or skull (%)
Taste & Smell - People 40+ that ever had two or more sinus infections (%)
Weight - Average height (inches)
Weight - Average weight (pounds)
Weight - Average BMI
Weight - People that are obese (%)
Weight - People that ever were obese (%)
Weight - People trying to lose weight (%)
100%
urban population.
Estimated median house/condo value in 2022: $740,651
10030:
$740,651New York:
$400,400
Median resident age: This zip code:
38.2 yearsNew York median age:
40.0 years
Average household size: This zip code:
2.2 peopleNew York:
2.5 people
Averages for the 2020 tax year for zip code 10030, filed in 2021:
Average Adjusted Gross Income (AGI) in 2020: $47,996 (Individual Income Tax Returns) Here:
$47,996State:
$90,930
Salary/wage: $45,637 (reported on 81.7% of returns )Here:
$45,637State:
$72,104
(% of AGI for various income ranges: 869.7% for AGIs below $25k , 3397.1% for AGIs $25k-50k , 7020.6% for AGIs $50k-75k , 10267.5% for AGIs $75k-100k , 18277.2% for AGIs $100k-200k , 102017.8% for AGIs over 200k ) Taxable interest for individuals: $504 (reported on 12.6% of returns )This zip code:
$504New York:
$3,075
(% of AGI for various income ranges: 1.8% for AGIs below $25k , 2.2% for AGIs $25k-50k , 7.8% for AGIs $50k-75k , 11.8% for AGIs $75k-100k , 36.8% for AGIs $100k-200k , 368.9% for AGIs over 200k ) Ordinary dividends: $3,243 (reported on 7.4% of returns )(% of AGI for various income ranges: 6.1% for AGIs below $25k , 6.4% for AGIs $25k-50k , 18.6% for AGIs $50k-75k , 33.9% for AGIs $75k-100k , 134.0% for AGIs $100k-200k , 1794.4% for AGIs over 200k ) Net capital gain/loss in AGI: +$10,789 (reported on 7.2% of returns )Here:
+$10,789State:
+$44,925
(% of AGI for various income ranges: 4.6% for AGIs below $25k , 5.9% for AGIs $25k-50k , 38.5% for AGIs $50k-75k , 109.2% for AGIs $75k-100k , 229.4% for AGIs $100k-200k , 8592.2% for AGIs over 200k ) Profit/loss from business: +$6,491 (reported on 19.0% of returns )Here:
+$6,491State:
+$14,940
(% of AGI for various income ranges: 158.8% for AGIs below $25k , 104.4% for AGIs $25k-50k , 65.0% for AGIs $50k-75k , 140.5% for AGIs $75k-100k , 341.3% for AGIs $100k-200k , 3318.9% for AGIs over 200k ) Taxable individual retirement arrangement distribution: $15,381 (reported on 1.5% of returns )10030:
$15,381New York:
$19,609
(% of AGI for various income ranges: 8.0% for AGIs below $25k , 10.3% for AGIs $25k-50k , 45.4% for AGIs $50k-75k , 54.4% for AGIs $75k-100k , 291.5% for AGIs $100k-200k ) Self-employed (Keogh) retirement plans: $23,600 (reported on 0.3% of returns )10030:
$23,600New York:
$32,497
(% of AGI for various income ranges: 178.1% for AGIs $100k-200k ) Total itemized deductions: $27,934 (reported on 4.9% of returns )Here:
$27,934State:
$39,326
(% of AGI for various income ranges: 17.2% for AGIs below $25k , 37.5% for AGIs $25k-50k , 179.0% for AGIs $50k-75k , 378.0% for AGIs $75k-100k , 1100.0% for AGIs $100k-200k , 6624.4% for AGIs over 200k ) Charity contributions: $8,277 (reported on 3.9% of returns )(% of AGI for various income ranges: 10.0% for AGIs $25k-50k , 41.4% for AGIs $50k-75k , 98.5% for AGIs $75k-100k , 209.2% for AGIs $100k-200k , 1921.1% for AGIs over 200k ) Taxes paid: $7,955 (reported on 4.9% of returns )(% of AGI for various income ranges: 2.3% for AGIs below $25k , 7.9% for AGIs $25k-50k , 39.6% for AGIs $50k-75k , 130.2% for AGIs $75k-100k , 408.3% for AGIs $100k-200k , 1493.3% for AGIs over 200k ) Earned income credit: $2,125 (reported on 26.7% of returns )(% of AGI for various income ranges: 122.8% for AGIs below $25k , 76.4% for AGIs $25k-50k ) Percentage of individuals using paid preparers for their 2020 taxes: 93.5%(% for various income ranges: 92.5% for AGIs below $25k , 94.0% for AGIs $25k-50k , 94.8% for AGIs $50k-75k , 94.0% for AGIs $75k-100k , 92.9% for AGIs $100k-200k , 96.4% for AGIs over 200k )
Averages for the 2012 tax year for zip code 10030, filed in 2013:
Average Adjusted Gross Income (AGI) in 2012: $35,037 (Individual Income Tax Returns) Here:
$35,037State:
$77,088
Salary/wage: $36,107 (reported on 84.1% of returns )Here:
$36,107State:
$60,593
(% of AGI for various income ranges: 70.8% for AGIs below $25k , 93.2% for AGIs $25k-50k , 92.8% for AGIs $50k-75k , 92.1% for AGIs $75k-100k , 86.8% for AGIs $100k-200k , 80.7% for AGIs over 200k ) Taxable interest for individuals: $247 (reported on 13.1% of returns )This zip code:
$247New York:
$3,125
(% of AGI for various income ranges: 0.1% for AGIs below $25k , 0.1% for AGIs $75k-100k , 0.2% for AGIs over 200k ) Ordinary dividends: $2,160 (reported on 5.3% of returns )(% of AGI for various income ranges: 0.4% for AGIs below $25k , 0.1% for AGIs $25k-50k , 0.2% for AGIs $50k-75k , 0.3% for AGIs $75k-100k , 0.4% for AGIs $100k-200k , 0.9% for AGIs over 200k ) Net capital gain/loss in AGI: +$1,323 (reported on 3.4% of returns )Here:
+$1,323State:
+$42,474
(% of AGI for various income ranges: 0.1% for AGIs $75k-100k , 0.1% for AGIs $100k-200k , 1.0% for AGIs over 200k ) Profit/loss from business: +$8,223 (reported on 20.7% of returns )Here:
+$8,223State:
+$16,168
(% of AGI for various income ranges: 18.1% for AGIs below $25k , 1.3% for AGIs $25k-50k , 0.9% for AGIs $50k-75k , 1.3% for AGIs $75k-100k , 2.2% for AGIs $100k-200k , 5.1% for AGIs over 200k ) Taxable individual retirement arrangement distribution: $11,535 (reported on 1.8% of returns )10030:
$11,535New York:
$17,621
(% of AGI for various income ranges: 0.5% for AGIs below $25k , 0.3% for AGIs $25k-50k , 0.3% for AGIs $50k-75k , 1.2% for AGIs $75k-100k , 1.8% for AGIs $100k-200k ) Self-employment retirement plans: $24,750 (reported on 0.2% of returns )10030:
$24,750New York:
$27,330
Total itemized deductions: $19,985 (24% of AGI, reported on 20.6% of returns )Here:
$19,985State:
$34,985
Here:
24.2% of AGIState:
21.3% of AGI
(% of AGI for various income ranges: 3.2% for AGIs below $25k , 8.5% for AGIs $25k-50k , 13.4% for AGIs $50k-75k , 17.8% for AGIs $75k-100k , 18.4% for AGIs $100k-200k , 17.9% for AGIs over 200k ) Charity contributions: $3,687 (reported on 16.7% of returns )(% of AGI for various income ranges: 0.4% for AGIs below $25k , 1.5% for AGIs $25k-50k , 2.4% for AGIs $50k-75k , 2.9% for AGIs $75k-100k , 2.5% for AGIs $100k-200k , 1.6% for AGIs over 200k ) Taxes paid: $8,020 (reported on 20.4% of returns )10030:
$8,020State:
$18,656
(% of AGI for various income ranges: 0.6% for AGIs below $25k , 1.9% for AGIs $25k-50k , 4.8% for AGIs $50k-75k , 7.7% for AGIs $75k-100k , 8.7% for AGIs $100k-200k , 10.8% for AGIs over 200k ) Earned income credit: $2,315 (reported on 37.2% of returns )(% of AGI for various income ranges: 11.4% for AGIs below $25k , 1.2% for AGIs $25k-50k ) Percentage of individuals using paid preparers for their 2012 taxes: 60.4%(% for various income ranges: 59.2% for AGIs below $25k , 60.1% for AGIs $25k-50k , 60.6% for AGIs $50k-75k , 64.4% for AGIs $75k-100k , 68.9% for AGIs $100k-200k , 84.6% for AGIs over 200k )
Averages for the 2004 tax year for zip code 10030, filed in 2005:
Average Adjusted Gross Income (AGI) in 2004: $26,995 (Individual Income Tax Returns) Here:
$26,995State:
$59,519
Salary/wage: $27,769 (reported on 87.8% of returns )Here:
$27,769State:
$50,673
(% of AGI for various income ranges: 76.7% for AGIs below $10k , 83.5% for AGIs $10k-25k , 95.9% for AGIs $25k-50k , 93.9% for AGIs $50k-75k , 91.0% for AGIs $75k-100k , 80.6% for AGIs over 100k ) Taxable interest for individuals: $310 (reported on 16.9% of returns )This zip code:
$310New York:
$2,377
(% of AGI for various income ranges: 0.8% for AGIs below $10k , 0.2% for AGIs $10k-25k , 0.1% for AGIs $25k-50k , 0.2% for AGIs $50k-75k , 0.2% for AGIs $75k-100k , 0.3% for AGIs over 100k ) Taxable dividends: $701 (reported on 4.6% of returns )(% of AGI for various income ranges: 0.2% for AGIs below $10k , 0.1% for AGIs $10k-25k , 0.0% for AGIs $25k-50k , 0.2% for AGIs $50k-75k , 0.2% for AGIs $75k-100k , 0.4% for AGIs over 100k ) Net capital gain/loss: +$957 (reported on 2.8% of returns )(% of AGI for various income ranges: -0.1% for AGIs below $10k , -0.0% for AGIs $10k-25k , -0.0% for AGIs $25k-50k , 0.1% for AGIs $50k-75k , 0.4% for AGIs $75k-100k , 0.8% for AGIs over 100k ) Profit/loss from business: +$5,536 (reported on 16.5% of returns )Here:
+$5,536State:
+$13,809
(% of AGI for various income ranges: 27.4% for AGIs below $10k , 8.1% for AGIs $10k-25k , 0.5% for AGIs $25k-50k , 0.2% for AGIs $50k-75k , -0.6% for AGIs $75k-100k , 3.4% for AGIs over 100k ) IRA payment deduction: $1,768 (reported on 1.0% of returns )10030:
$1,768New York:
$3,115
Self-employed pension: $11,062 (reported on 0.2% of returns )Here:
$11,062New York:
$19,016
Total itemized deductions: $15,946 (29% of AGI, reported on 22.8% of returns )Here:
$15,946State:
$25,864
Here:
29.5% of AGIState:
21.9% of AGI
(% of AGI for various income ranges: 1.1% for AGIs below $10k , 3.6% for AGIs $10k-25k , 13.9% for AGIs $25k-50k , 19.8% for AGIs $50k-75k , 21.1% for AGIs $75k-100k , 20.6% for AGIs over 100k ) Charity contributions deductions: $3,651 (7% of AGI, reported on 21.3% of returns )Here:
6.7% of AGIState:
3.6% of AGI
(% of AGI for various income ranges: 0.8% for AGIs $10k-25k , 3.2% for AGIs $25k-50k , 4.3% for AGIs $50k-75k , 4.1% for AGIs $75k-100k , 3.6% for AGIs over 100k ) Total tax: $3,266 (reported on 61.2% of returns )10030:
$3,266State:
$11,730
(% of AGI for various income ranges: 5.0% for AGIs below $10k , 3.3% for AGIs $10k-25k , 5.3% for AGIs $25k-50k , 9.6% for AGIs $50k-75k , 12.1% for AGIs $75k-100k , 18.2% for AGIs over 100k ) Earned income credit: $1,884 (reported on 41.8% of returns )Percentage of individuals using paid preparers for their 2004 taxes: 71.5%(% for various income ranges: 71.1% for AGIs below $10k , 76.4% for AGIs $10k-25k , 68.2% for AGIs $25k-50k , 65.8% for AGIs $50k-75k , 67.7% for AGIs $75k-100k , 78.3% for AGIs over 100k )
Estimated median household income in 2022: This zip code:
$46,692New York:
$79,557
Nearest zip codes: 10037 ,
10031 ,
10027 ,
10039 ,
10451 ,
10026 .
New York Zip Code Map
Percentage of family households: This zip code:
34.6%New York:
41.3%
Percentage of households with unmarried partners: This zip code:
4.9%New York:
42.3%
Likely homosexual households (counted as self-reported same-sex unmarried-partner households)
Lesbian couples: 0.0% of all households Gay men: 0.5% of all households
Household received Food Stamps/SNAP in the past 12 months: 4,705Household did not receive Food Stamps/SNAP in the past 12 months: 8,980
Women who had a birth in the past 12 months: 436 (232 now married , 208 unmarried) Women who did not have a birth in the past 12 months: 8,318 (1,779 now married , 6,598 unmarried)
Housing units in zip code 10030 with a mortgage: 1,148 (183
second mortgage , 178
both second mortgage and home equity loan )
Houses without a mortgage: 7
Median monthly owner costs for units with a mortgage: $3,482
Median monthly owner costs for units without a mortgage: $685
Residents with income below the poverty level in 2022:
This zip code:
31.8%Whole state:
14.3%
Residents with income below 50% of the poverty level in 2022:
This zip code:
17.2%Whole state:
6.8%
Median number of rooms in houses and condos: Median number of rooms in apartments: Notable locations in this zip code not listed on our city pages
Click to draw/clear zip code borders Notable locations in zip code 10030: (A) , Harlem Branch YMCA (B) , Schomburg Center for Research In Black Culture (C) , Renaissance Theater (D) , New York Ladder Company 30 (E) , New York Ladder Company 28 (F) , Fire Department New York Engine 69 Ladder 28 Battalion 16 (G) , Fire Department New York Engine 59 Ladder 30 (H) , Countee Cullen Branch New York Public Library (I) . Display/hide their locations on the map
Churches in zip code 10030 include: (A) , Saint Mark's Methodist Church (B) , Victory Tabernacle Seventh Day Christian Church (C) , Abyssinian Baptist Church (D) , Mother African Methodist Episcopal Zion Church (E) , Saint Philip's Episcopal Church (F) . Display/hide their locations on the map
Parks in zip code 10030 include: (1) , Renaissance Playground (2) , Fred Samuel Playground (3) , Elizabeth Langley Memorial Garden (4) , Abyssinian Tot Lot (5) , Dorrence Brook Square (6) , Parks Council Success Garden (7) . Display/hide their locations on the map
Year house built (houses)
51 2020 or later566 2010 to 2019771 2000 to 20091,049 1990 to 1999777 1980 to 1989585 1970 to 19791,374 1960 to 19691,038 1950 to 1959963 1940 to 19497,090 1939 or earlier
Zip code 10030 household income distribution in 2022 1,535 Less than $10,0001,588 $10,000 to $14,999861 $15,000 to $19,999630 $20,000 to $24,999699 $25,000 to $29,999563 $30,000 to $34,999357 $35,000 to $39,999478 $40,000 to $44,999337 $45,000 to $49,999922 $50,000 to $59,9991,102 $60,000 to $74,9991,574 $75,000 to $99,999714 $100,000 to $124,999671 $125,000 to $149,999431 $150,000 to $199,9991,011 $200,000 or moreEstimate of home value of owner-occupied houses/condos in 2022 in zip code 10030 29 Less than $10,00017 $20,000 to $24,99914 $90,000 to $99,9997 $125,000 to $149,99949 $175,000 to $199,999176 $200,000 to $249,99968 $250,000 to $299,99968 $300,000 to $399,999204 $400,000 to $499,999388 $500,000 to $749,999300 $750,000 to $999,999300 $1,000,000 to $1,499,999162 $1,500,000 to $1,999,999153 $2,000,000 or moreRent paid by renters in 2022 in zip code 10030 157 Less than $10085 $100 to $149312 $150 to $199280 $200 to $249478 $250 to $299332 $300 to $349174 $350 to $399118 $400 to $44977 $450 to $499264 $500 to $54997 $550 to $599303 $600 to $649447 $650 to $699270 $700 to $749163 $750 to $799532 $800 to $899930 $900 to $9991,478 $1,000 to $1,249984 $1,250 to $1,4991,809 $1,500 to $1,9991,319 $2,000 to $2,499294 $2,500 to $2,999341 $3,000 to $3,499161 $3,500 or more126 No cash rent
Median gross rent in 2022: $1,238.
Median price asked for vacant for-sale houses and condos in 2022: $4,326,996.
Estimated median house (or condo) value in 2022 for: White Non-Hispanic householders: $1,630,528Black or African American householders: $516,812Two or more races householders: $668,647Hispanic or Latino householders: $293,495Estimated median house or condo value in 2022: $740,651
10030:
$740,651New York:
$400,400
Lower value quartile - upper value quartile: $447,043 - $1,134,057
Mean price in 2022: Detached houses: $9,247,275Here:
$9,247,275State:
$476,719
Townhouses or other attached units: $1,574,431Here:
$1,574,431State:
$699,270
In 2-unit structures: $3,286,152Here:
$3,286,152State:
$713,077
In 3-to-4-unit structures: $696,723Here:
$696,723State:
$764,568
In 5-or-more-unit structures: $811,554Here:
$811,554State:
$912,009
Housing units in structures:
One, detached: 117One, attached: 389Two: 3823 or 4: 1,0285 to 9: 1,46110 to 19: 3,38220 to 49: 3,07850 or more: 4,816Mobile homes: 16Boats, RVs, vans, etc.: 63Unemployment : 8.4%
Means of transportation to work in zip code 10030 6.8% 993 Drove a car alone1.1% 164 Carpooled14.0% 2,040 Bus or trolley bus47.0% 6,863 Streetcar or trolley car0.9% 127 Subway or elevated0.2% 29 Taxi0.1% 11 Motorcycle1.7% 248 Bicycle8.4% 1,221 Walked0.7% 104 Other means17.6% 2,576 Worked at homeTravel time to work (commute) in zip code 10030 29 Less than 5 minutes352 5 to 9 minutes522 10 to 14 minutes345 15 to 19 minutes846 20 to 24 minutes805 25 to 29 minutes2,419 30 to 34 minutes471 35 to 39 minutes1,360 40 to 44 minutes2,903 45 to 59 minutes1,615 60 to 89 minutes456 90 or more minutes
Neighborhoods in zip code 10030: Percentage of zip code residents living and working in this county: 81.2%
Household type by relationship:
Households: 30,771
Male householders: 4,661 (2,160 living alone ), Female householders: 8,767 (4,032 living alone )2,544 spouses (2,441 opposite-sex spouses ), 724 unmarried partners , (618 opposite-sex unmarried partners ), 8,297 children (8,146 natural , 49 adopted , 112 stepchildren ), 749 grandchildren , 795 brothers or sisters , 469 parents , 0 foster children , 968 other relatives , 1,384 non-relatives In group quarters: 1,364 (-1 institutionalized population )
Size of family households: 2,550 2-persons , 1,809 3-persons , 951 4-persons , 486 5-persons , 106 6-persons , 106 7-or-more-persons
Size of nonfamily households: 6,186 1-person , 969 2-persons , 299 3-persons , 22 4-persons
2,049 married couples with children. single-parent households (356 men , 1,903 women ).
62.5% of residents of 10030 zip code speak English at home. of residents speak Spanish at home (54% very well, 18% well, 15% not well, 12% not at all ).of residents speak other Indo-European language at home (78% very well, 9% well, 9% not well, 4% not at all ).of residents speak Asian or Pacific Island language at home (64% very well, 12% well, 21% not well, 3% not at all ).of residents speak other language at home (51% very well, 26% well, 21% not well, 2% not at all ).
Foreign born population: 7,863 (25.6%)
(50.1%
of them are naturalized citizens )
This zip code:
25.6%Whole state:
22.7%
23% Dominica 8% Honduras 6% Haiti 6% Ghana 5% Nigeria 4% Grenada 4% Costa Rica 5% African 3% American 2% Jamaican 2% Senegalese 1% Haitian 1% West Indian 1% Ghanaian
Year of entry for the foreign-born population
2,847 2010 or later 1,640 2000 to 2009 1,877 1990 to 1999 2,409 Before 1990
There are
85 Medical Specialists in Zip Code 10030 .
Major facilities with environmental interests located in this zip code:
HALE HOUSE CENTER, INC ( in NEW YORK, NY)
(National Center for Education Statistics) - STATE ID-310500890211 Organizations: NEW YORK CITY PUBLIC SCHOOLS (SCHOOL DISTRICT)
INTERMEDIATE SCH 136 (6 EDGECOMB AVE in NEW YORK, NY)
(Integrated Compliance Information System) - ICIS-02-1999-1116, FORMAL ENFORCEMENT ACTION Business SIC classification: SPECIAL TRADE CONTRACTORS
CON EDISON - TM 3480 (92-103 CEDER ST & BROADWAY in NEW YORK, NY)
Large Quantity Generators, more that 1000 kg of hazardous waste/month (Resource Conservation and Recovery Act (tracking hazardous waste)) Organizations: CONSOLIDATED EDISON COMPANY OF NY, INC. (CONTACT/OPERATOR)
2446 DRY CLEANERS (2446 7TH AVE in NEW YORK, NY)
(Resource Conservation and Recovery Act (tracking hazardous waste)) Alternative names: 2446 7TH AVENUE CLEANERS INC
BENTAS FUNERAL HOME INC (630 ST NICHOLAS AVE in NEW YORK, NY)
(Resource Conservation and Recovery Act (tracking hazardous waste))
ABAX INC (118 W 139TH ST APT 2W in NEW YORK, NY)
Small Quantity Generators, between 100 kg and 1000 kg of hazardous waste/month (Resource Conservation and Recovery Act (tracking hazardous waste)) - notification Organizations: NYCHPD - HOUSING PRESERVATION & DEV (CONTACT/OWNER)
ABAX INC (108-16 W 141ST ST APT 67 in NEW YORK, NY)
Small Quantity Generators, between 100 kg and 1000 kg of hazardous waste/month (Resource Conservation and Recovery Act (tracking hazardous waste)) - notification Organizations: NYCHPD - HOUSING PRESERVATION & DEV (CONTACT/OWNER)
ABAX INC - NYC HPD (2472 7TH AVE APT 4N in NEW YORK, NY)
Conditionally Exempt Small Quantity Generators, less than 100 kg/month of hazardous waste (Resource Conservation and Recovery Act (tracking hazardous waste)) - notification Organizations: NYC HOUSING PRESERVATION & DEVELOP (CONTACT/OWNER)
HI TECH CONST & MGMT SERVICES INC (177 W 151 ST in NEW YORK, NY)
Small Quantity Generators, between 100 kg and 1000 kg of hazardous waste/month (Resource Conservation and Recovery Act (tracking hazardous waste)) - notification Organizations: NYCHA (CONTACT/OWNER)
HI TECH CONST & MGMT SERVICES INC (210P W 153RD ST BLDG 2 in NEW YORK, NY)
Small Quantity Generators, between 100 kg and 1000 kg of hazardous waste/month (Resource Conservation and Recovery Act (tracking hazardous waste)) - notification Organizations: NYCHA (CONTACT/OWNER)
Alternative names: HI TECH CONST MGMT SERVICES INC
HI TECH CONST & MGMT SERVICES INC (229 W 152ND ST in NEW YORK, NY)
Small Quantity Generators, between 100 kg and 1000 kg of hazardous waste/month (Resource Conservation and Recovery Act (tracking hazardous waste)) - notification Organizations: NYCHA (CONTACT/OWNER)
HI TECH CONST & MGMT SVCS (210 W 152ND ST in NEW YORK, NY)
Small Quantity Generators, between 100 kg and 1000 kg of hazardous waste/month (Resource Conservation and Recovery Act (tracking hazardous waste)) - notification Organizations: NYC HOUSING AUTH (CONTACT/OWNER)
HI TECH CONST & MGMT SVCS (225 W 152ND ST in NEW YORK, NY)
Small Quantity Generators, between 100 kg and 1000 kg of hazardous waste/month (Resource Conservation and Recovery Act (tracking hazardous waste)) - notification Organizations: NYC HOUSING AUTH (CONTACT/OWNER)
Housing units lacking complete plumbing facilities: 1.3%
Housing units lacking complete kitchen facilities: 2.4%
57.7% Utility gas 17.9% Fuel oil, kerosene, etc. 14.0% Electricity 5.1% Bottled, tank, or LP gas 3.0% No fuel used 1.8% Other fuel 0.6% Solar energy
Population in 1990: 21,132. Population change in the 1990s: +4,715 (+22.3%).
Place of birth for U.S.-born residents:
This state: 16,845Northeast: 959Midwest: 611South: 2,548West: 1,127
62% of the 10030 zip code residents lived in the same house 5 years ago.
Out of people who lived in different houses, 58% lived in this county.
Out of people who lived in different counties, 50% lived in New York.
87% of the 10030 zip code residents lived in the same house 1 year ago.
Out of people who lived in different houses, 49% moved from this county.
Out of people who lived in different houses, 15% moved from different county within same state.
Out of people who lived in different houses, 22% moved from different state.
Out of people who lived in different houses, 16% moved from abroad.
Private vs. public school enrollment:
Students in private schools in grades 1 to 8 (elementary and middle school): 208
Students in private schools in grades 9 to 12 (high school): 287
Students in private undergraduate colleges: 468
Occupation by median earnings in the past 12 months ($)
114,691 Health diagnosing and treating practitioners and other technical occupations 109,586 Architecture and engineering occupations 90,187 Law enforcement workers including supervisors 86,417 Management occupations 79,631 Computer and mathematical occupations 67,864 Business and financial operations occupations
Top industries in this zip code by the number of employees in 2005:
Educational Services: Exam Preparation and Tutoring (100-249 employees: 1 establishment, 20-49 employees: 1 establishment)Health Care and Social Assistance: Child and Youth Services (100-249: 1, 10-19: 1, 1-4: 7)Other Services (except Public Administration): Civic and Social Organizations (100-249: 1, 5-9: 1, 1-4: 1)Educational Services: Fine Arts Schools (100-249: 1)Health Care and Social Assistance: Other Individual and Family Services (50-99: 1, 20-49: 1, 10-19: 3, 1-4: 4)Health Care and Social Assistance: Child Day Care Services (20-49: 2, 10-19: 3, 5-9: 2)Accommodation and Food Services: Limited-Service Restaurants (50-99: 1, 1-4: 4)Real Estate and Rental and Leasing: Lessors of Residential Buildings and Dwellings (5-9: 5, 1-4: 21)Educational Services: Elementary and Secondary Schools (20-49: 2, 5-9: 1)Health Care and Social Assistance: Other Community Housing Services (50-99: 1)
People in group quarters in 2010:
508 people in emergency and transitional shelters (with sleeping facilities) for people experiencing homelessness
246 people in other noninstitutional facilities
58 people in residential treatment centers for adults
48 people in residential treatment centers for juveniles (non-correctional)
14 people in group homes intended for adults
People in group quarters in 2000:
466 people in other noninstitutional group quarters
26 people in homes for the mentally retarded
23 people in homes for the mentally ill
20 people in homes or halfway houses for drug/alcohol abuse
11 people in religious group quarters
Fatal accident statistics in 2013:
Fatal accident count: 1Vehicles involved in fatal accidents: 1Fatal accidents caused by drunken drivers: 0Fatalities: 1Persons involved in fatal accidents: 2Pedestrians involved in fatal accidents: 1
Fatal accident statistics in 2011:
Fatal accident count: 1Vehicles involved in fatal accidents: 2Fatal accidents caused by drunken drivers: 0Fatalities: 1Persons involved in fatal accidents: 2Pedestrians involved in fatal accidents: 4
Home Mortgage Disclosure Act Aggregated Statistics For Year 2009(Based on 5 full and 10 partial tracts) A) FHA, FSA/RHS & VA B) Conventional C) Refinancings D) Home Improvement Loans E) Loans on Dwellings For 5+ Families F) Non-occupant Loans on G) Loans On Manufactured Number Average Value Number Average Value Number Average Value Number Average Value Number Average Value Number Average Value Number Average Value
LOANS ORIGINATED 6 $656,840 20 $501,394 34 $323,114 0 $0 3 $1,216,670 3 $322,530 0 $0 APPLICATIONS APPROVED, NOT ACCEPTED 1 $173,720 3 $617,560 13 $292,274 0 $0 0 $0 2 $449,500 0 $0 APPLICATIONS DENIED 10 $420,564 35 $301,968 58 $466,706 11 $193,168 2 $1,656,095 7 $255,003 1 $100,000 APPLICATIONS WITHDRAWN 4 $694,750 8 $302,306 25 $369,847 1 $300,000 1 $26,210 0 $0 0 $0 FILES CLOSED FOR INCOMPLETENESS 1 $490,210 7 $287,564 11 $311,567 2 $327,555 0 $0 1 $309,000 0 $0
Aggregated Statistics For Year 2008(Based on 5 full and 10 partial tracts) A) FHA, FSA/RHS & VA B) Conventional C) Refinancings D) Home Improvement Loans E) Loans on Dwellings For 5+ Families F) Non-occupant Loans on G) Loans On Manufactured Number Average Value Number Average Value Number Average Value Number Average Value Number Average Value Number Average Value Number Average Value
LOANS ORIGINATED 1 $239,040 79 $435,090 34 $355,966 8 $367,460 11 $2,061,576 8 $391,416 0 $0 APPLICATIONS APPROVED, NOT ACCEPTED 0 $0 23 $385,312 11 $455,877 7 $258,066 1 $7,500,000 1 $533,150 0 $0 APPLICATIONS DENIED 6 $614,188 60 $606,903 66 $548,526 18 $153,929 6 $3,602,033 8 $778,930 3 $89,447 APPLICATIONS WITHDRAWN 2 $943,850 22 $405,400 16 $398,476 1 $26,210 5 $5,903,758 3 $290,953 0 $0 FILES CLOSED FOR INCOMPLETENESS 2 $691,600 11 $349,512 6 $770,590 3 $75,633 0 $0 3 $444,960 0 $0
Aggregated Statistics For Year 2007(Based on 5 full and 10 partial tracts) A) FHA, FSA/RHS & VA B) Conventional C) Refinancings D) Home Improvement Loans E) Loans on Dwellings For 5+ Families F) Non-occupant Loans on G) Loans On Manufactured Number Average Value Number Average Value Number Average Value Number Average Value Number Average Value Number Average Value Number Average Value
LOANS ORIGINATED 1 $340,730 91 $511,362 74 $603,821 14 $425,933 10 $2,443,087 14 $737,669 0 $0 APPLICATIONS APPROVED, NOT ACCEPTED 0 $0 38 $540,214 26 $521,130 8 $433,722 2 $2,713,950 4 $552,785 0 $0 APPLICATIONS DENIED 0 $0 76 $598,715 103 $585,437 27 $176,013 3 $603,097 20 $461,990 1 $86,000 APPLICATIONS WITHDRAWN 0 $0 24 $685,867 21 $620,010 1 $416,330 2 $2,200,000 6 $801,857 0 $0 FILES CLOSED FOR INCOMPLETENESS 0 $0 10 $514,976 16 $595,042 4 $120,195 0 $0 3 $613,440 0 $0
Aggregated Statistics For Year 2006(Based on 5 full and 10 partial tracts) A) FHA, FSA/RHS & VA B) Conventional C) Refinancings D) Home Improvement Loans E) Loans on Dwellings For 5+ Families F) Non-occupant Loans on Number Average Value Number Average Value Number Average Value Number Average Value Number Average Value Number Average Value
LOANS ORIGINATED 0 $0 126 $424,843 104 $508,908 14 $123,052 19 $2,044,610 24 $676,362 APPLICATIONS APPROVED, NOT ACCEPTED 0 $0 50 $382,395 33 $579,269 3 $332,853 2 $2,744,805 4 $742,260 APPLICATIONS DENIED 0 $0 52 $565,707 115 $531,160 38 $170,659 7 $1,190,700 22 $278,176 APPLICATIONS WITHDRAWN 0 $0 38 $478,189 36 $453,011 6 $73,022 3 $2,062,110 5 $653,824 FILES CLOSED FOR INCOMPLETENESS 2 $146,865 10 $599,958 17 $489,771 0 $0 0 $0 1 $973,440
Aggregated Statistics For Year 2005(Based on 5 full and 10 partial tracts) B) Conventional C) Refinancings D) Home Improvement Loans E) Loans on Dwellings For 5+ Families F) Non-occupant Loans on G) Loans On Manufactured Number Average Value Number Average Value Number Average Value Number Average Value Number Average Value Number Average Value
LOANS ORIGINATED 398 $253,956 92 $451,870 17 $282,232 30 $1,759,053 30 $518,023 0 $0 APPLICATIONS APPROVED, NOT ACCEPTED 58 $312,940 28 $380,525 5 $173,028 1 $1,000,000 10 $505,343 0 $0 APPLICATIONS DENIED 136 $355,657 79 $467,548 27 $181,197 1 $375,000 19 $443,839 0 $0 APPLICATIONS WITHDRAWN 73 $367,370 49 $391,721 8 $216,064 4 $1,203,722 18 $500,004 1 $157,000 FILES CLOSED FOR INCOMPLETENESS 41 $294,174 35 $473,283 1 $340,730 0 $0 6 $886,305 0 $0
Aggregated Statistics For Year 2004(Based on 5 full and 10 partial tracts) B) Conventional C) Refinancings D) Home Improvement Loans E) Loans on Dwellings For 5+ Families F) Non-occupant Loans on G) Loans On Manufactured Number Average Value Number Average Value Number Average Value Number Average Value Number Average Value Number Average Value
LOANS ORIGINATED 115 $301,256 97 $396,270 5 $252,050 30 $1,605,940 12 $512,810 0 $0 APPLICATIONS APPROVED, NOT ACCEPTED 19 $291,279 23 $379,919 3 $311,117 3 $998,053 2 $599,545 0 $0 APPLICATIONS DENIED 50 $389,300 78 $386,688 37 $144,196 2 $948,285 22 $359,301 2 $14,590 APPLICATIONS WITHDRAWN 35 $462,347 36 $333,259 11 $93,795 7 $1,461,101 9 $558,212 0 $0 FILES CLOSED FOR INCOMPLETENESS 7 $360,053 12 $445,317 2 $33,000 0 $0 1 $630,000 0 $0
Aggregated Statistics For Year 2003(Based on 5 full and 10 partial tracts) A) FHA, FSA/RHS & VA B) Conventional C) Refinancings D) Home Improvement Loans E) Loans on Dwellings For 5+ Families F) Non-occupant Loans on Number Average Value Number Average Value Number Average Value Number Average Value Number Average Value Number Average Value
LOANS ORIGINATED 2 $389,500 57 $333,825 103 $280,569 7 $70,720 15 $1,400,996 11 $372,730 APPLICATIONS APPROVED, NOT ACCEPTED 1 $445,290 16 $378,360 28 $306,484 3 $136,327 3 $726,417 3 $533,657 APPLICATIONS DENIED 1 $133,000 37 $309,988 89 $284,026 13 $27,188 3 $1,004,147 11 $340,235 APPLICATIONS WITHDRAWN 1 $180,710 24 $317,246 39 $306,807 7 $187,474 3 $904,113 12 $354,411 FILES CLOSED FOR INCOMPLETENESS 0 $0 5 $453,304 9 $233,156 0 $0 2 $1,424,405 1 $569,090
Aggregated Statistics For Year 2002(Based on 5 full and 10 partial tracts) A) FHA, FSA/RHS & VA B) Conventional C) Refinancings D) Home Improvement Loans E) Loans on Dwellings For 5+ Families F) Non-occupant Loans on Number Average Value Number Average Value Number Average Value Number Average Value Number Average Value Number Average Value
LOANS ORIGINATED 1 $421,000 67 $448,366 73 $279,922 8 $42,225 23 $1,070,953 16 $565,752 APPLICATIONS APPROVED, NOT ACCEPTED 1 $240,080 15 $299,574 25 $266,601 2 $8,500 1 $198,680 3 $134,000 APPLICATIONS DENIED 1 $208,110 25 $357,638 69 $267,158 28 $58,137 8 $489,516 12 $260,135 APPLICATIONS WITHDRAWN 0 $0 16 $451,831 30 $277,938 3 $72,783 5 $766,194 4 $631,950 FILES CLOSED FOR INCOMPLETENESS 0 $0 2 $635,000 19 $205,592 1 $15,000 0 $0 2 $349,765
Aggregated Statistics For Year 2001(Based on 5 full and 10 partial tracts) A) FHA, FSA/RHS & VA B) Conventional C) Refinancings D) Home Improvement Loans E) Loans on Dwellings For 5+ Families F) Non-occupant Loans on Number Average Value Number Average Value Number Average Value Number Average Value Number Average Value Number Average Value
LOANS ORIGINATED 3 $378,587 32 $377,940 46 $288,991 7 $50,857 16 $627,718 10 $400,301 APPLICATIONS APPROVED, NOT ACCEPTED 2 $160,555 16 $363,296 21 $189,238 1 $34,940 3 $287,000 8 $254,964 APPLICATIONS DENIED 3 $347,557 30 $352,689 61 $262,950 34 $55,542 5 $450,852 7 $249,037 APPLICATIONS WITHDRAWN 1 $177,180 17 $303,955 42 $171,563 4 $44,340 2 $478,630 3 $232,423 FILES CLOSED FOR INCOMPLETENESS 1 $385,000 5 $341,894 8 $187,110 0 $0 1 $165,000 0 $0
Aggregated Statistics For Year 2000(Based on 5 full and 10 partial tracts) A) FHA, FSA/RHS & VA B) Conventional C) Refinancings D) Home Improvement Loans E) Loans on Dwellings For 5+ Families F) Non-occupant Loans on Number Average Value Number Average Value Number Average Value Number Average Value Number Average Value Number Average Value
LOANS ORIGINATED 4 $351,498 28 $246,553 38 $235,316 18 $12,696 12 $650,869 6 $286,870 APPLICATIONS APPROVED, NOT ACCEPTED 0 $0 12 $262,196 17 $161,741 2 $31,375 1 $698,880 2 $217,325 APPLICATIONS DENIED 3 $353,107 38 $300,929 61 $187,173 21 $28,849 1 $229,280 8 $336,464 APPLICATIONS WITHDRAWN 0 $0 20 $260,692 54 $155,905 4 $17,912 5 $689,112 5 $313,278 FILES CLOSED FOR INCOMPLETENESS 0 $0 3 $326,077 6 $204,200 0 $0 1 $1,300,000 1 $250,000
Aggregated Statistics For Year 1999(Based on 4 full and 5 partial tracts) A) FHA, FSA/RHS & VA B) Conventional C) Refinancings D) Home Improvement Loans E) Loans on Dwellings For 5+ Families F) Non-occupant Loans on Number Average Value Number Average Value Number Average Value Number Average Value Number Average Value Number Average Value
LOANS ORIGINATED 14 $358,107 18 $262,351 35 $205,497 26 $12,900 12 $578,957 14 $282,304 APPLICATIONS APPROVED, NOT ACCEPTED 2 $276,290 12 $227,515 21 $173,423 4 $38,860 0 $0 4 $226,478 APPLICATIONS DENIED 0 $0 18 $221,724 49 $184,085 21 $31,050 1 $410,030 12 $255,312 APPLICATIONS WITHDRAWN 5 $407,184 8 $180,190 32 $125,914 1 $9,000 4 $593,750 5 $390,726 FILES CLOSED FOR INCOMPLETENESS 1 $186,000 1 $279,330 8 $145,252 0 $0 0 $0 0 $0
Private Mortgage Insurance Companies Aggregated Statistics For Year 2009(Based on 5 full and 4 partial tracts) A) Conventional B) Refinancings Number Average Value Number Average Value
LOANS ORIGINATED 3 $422,433 0 $0 APPLICATIONS APPROVED, NOT ACCEPTED 7 $377,531 1 $182,950 APPLICATIONS DENIED 0 $0 1 $385,000 APPLICATIONS WITHDRAWN 0 $0 0 $0 FILES CLOSED FOR INCOMPLETENESS 0 $0 0 $0
Aggregated Statistics For Year 2008(Based on 5 full and 6 partial tracts) A) Conventional B) Refinancings C) Non-occupant Loans on Number Average Value Number Average Value Number Average Value
LOANS ORIGINATED 26 $392,672 0 $0 0 $0 APPLICATIONS APPROVED, NOT ACCEPTED 11 $415,035 0 $0 0 $0 APPLICATIONS DENIED 7 $370,663 0 $0 0 $0 APPLICATIONS WITHDRAWN 1 $625,000 0 $0 0 $0 FILES CLOSED FOR INCOMPLETENESS 1 $474,000 1 $608,000 1 $608,000
Aggregated Statistics For Year 2007(Based on 5 full and 6 partial tracts) A) Conventional B) Refinancings C) Non-occupant Loans on Number Average Value Number Average Value Number Average Value
LOANS ORIGINATED 9 $307,063 0 $0 0 $0 APPLICATIONS APPROVED, NOT ACCEPTED 8 $308,992 1 $608,000 1 $608,000 APPLICATIONS DENIED 0 $0 4 $608,000 4 $608,000 APPLICATIONS WITHDRAWN 4 $235,568 0 $0 0 $0 FILES CLOSED FOR INCOMPLETENESS 1 $382,390 0 $0 0 $0
Aggregated Statistics For Year 2006(Based on 4 full and 6 partial tracts) A) Conventional Number Average Value
LOANS ORIGINATED 4 $237,285 APPLICATIONS APPROVED, NOT ACCEPTED 29 $227,832 APPLICATIONS DENIED 0 $0 APPLICATIONS WITHDRAWN 7 $175,816 FILES CLOSED FOR INCOMPLETENESS 3 $308,367
Aggregated Statistics For Year 2005(Based on 5 full and 8 partial tracts) A) Conventional B) Refinancings C) Non-occupant Loans on Number Average Value Number Average Value Number Average Value
LOANS ORIGINATED 41 $246,443 0 $0 1 $107,000 APPLICATIONS APPROVED, NOT ACCEPTED 63 $216,583 2 $273,500 0 $0 APPLICATIONS DENIED 4 $321,878 0 $0 0 $0 APPLICATIONS WITHDRAWN 21 $225,737 0 $0 0 $0 FILES CLOSED FOR INCOMPLETENESS 1 $644,970 0 $0 0 $0
Aggregated Statistics For Year 2004(Based on 2 full and 6 partial tracts) A) Conventional B) Refinancings C) Non-occupant Loans on D) Loans On Manufactured Number Average Value Number Average Value Number Average Value Number Average Value
LOANS ORIGINATED 29 $249,312 0 $0 0 $0 5 $203,494 APPLICATIONS APPROVED, NOT ACCEPTED 10 $229,707 0 $0 1 $136,820 1 $93,310 APPLICATIONS DENIED 3 $279,027 0 $0 0 $0 0 $0 APPLICATIONS WITHDRAWN 3 $190,863 1 $275,000 0 $0 0 $0 FILES CLOSED FOR INCOMPLETENESS 1 $104,840 0 $0 0 $0 0 $0
Aggregated Statistics For Year 2003(Based on 4 full and 8 partial tracts) A) Conventional B) Refinancings C) Non-occupant Loans on Number Average Value Number Average Value Number Average Value
LOANS ORIGINATED 7 $190,053 0 $0 1 $110,000 APPLICATIONS APPROVED, NOT ACCEPTED 6 $351,475 0 $0 0 $0 APPLICATIONS DENIED 2 $776,190 1 $220,000 1 $448,190 APPLICATIONS WITHDRAWN 1 $147,000 0 $0 0 $0 FILES CLOSED FOR INCOMPLETENESS 0 $0 0 $0 0 $0
Aggregated Statistics For Year 2002(Based on 3 full and 4 partial tracts) A) Conventional B) Refinancings Number Average Value Number Average Value
LOANS ORIGINATED 11 $375,030 1 $207,580 APPLICATIONS APPROVED, NOT ACCEPTED 12 $356,976 0 $0 APPLICATIONS DENIED 0 $0 0 $0 APPLICATIONS WITHDRAWN 0 $0 0 $0 FILES CLOSED FOR INCOMPLETENESS 0 $0 0 $0
Aggregated Statistics For Year 2001(Based on 3 full and 6 partial tracts) A) Conventional B) Refinancings C) Non-occupant Loans on Number Average Value Number Average Value Number Average Value
LOANS ORIGINATED 6 $371,810 2 $370,405 0 $0 APPLICATIONS APPROVED, NOT ACCEPTED 10 $287,994 0 $0 1 $96,070 APPLICATIONS DENIED 2 $538,695 0 $0 0 $0 APPLICATIONS WITHDRAWN 0 $0 0 $0 0 $0 FILES CLOSED FOR INCOMPLETENESS 1 $123,800 0 $0 0 $0
Aggregated Statistics For Year 2000(Based on 2 full and 8 partial tracts) A) Conventional B) Refinancings Number Average Value Number Average Value
LOANS ORIGINATED 8 $281,850 1 $156,740 APPLICATIONS APPROVED, NOT ACCEPTED 6 $323,607 1 $397,000 APPLICATIONS DENIED 1 $358,170 0 $0 APPLICATIONS WITHDRAWN 0 $0 1 $192,690 FILES CLOSED FOR INCOMPLETENESS 0 $0 0 $0
Aggregated Statistics For Year 1999(Based on 4 full and 3 partial tracts) A) Conventional B) Refinancings C) Non-occupant Loans on Number Average Value Number Average Value Number Average Value
LOANS ORIGINATED 6 $260,505 5 $166,474 2 $242,000 APPLICATIONS APPROVED, NOT ACCEPTED 3 $158,247 0 $0 0 $0 APPLICATIONS DENIED 1 $495,000 2 $434,045 0 $0 APPLICATIONS WITHDRAWN 0 $0 0 $0 0 $0 FILES CLOSED FOR INCOMPLETENESS 0 $0 0 $0 0 $0
2007 - 2018 National Fire Incident Reporting System (NFIRS) incidents See full 2006 National Fire Incident Reporting System statistics for zip code 10030, New York
Most common first names in zip code 10030 among deceased individuals Name Count Lived (average)
James 344 69.1 years William 298 70.3 years John 249 71.7 years Mary 221 75.7 years George 173 69.7 years Charles 149 69.7 years Robert 140 66.4 years Willie 134 66.8 years Joseph 131 70.2 years Henry 99 71.2 years
Most common last names in zip code 10030 among deceased individuals Last name Count Lived (average)
Williams 249 72.0 years Johnson 226 70.6 years Brown 215 70.5 years Smith 190 72.3 years Jones 171 71.6 years Jackson 114 71.3 years Davis 102 69.1 years Robinson 90 77.6 years Thomas 83 70.2 years Harris 79 71.4 years
Businesses in zip code 10030
Name Count Name Count
Dunkin Donuts 1 Popeyes 1 IHOP 1 Subway 1 McDonald's 1 U-Haul 1 Nike 1 YMCA 1


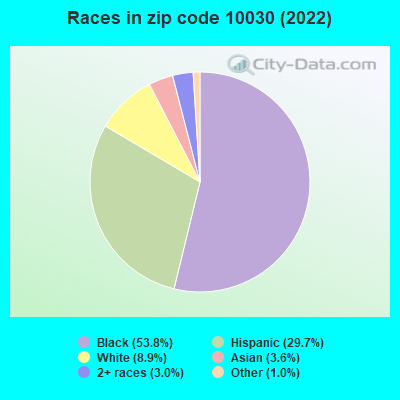


 Nearest zip codes: 10037, 10031, 10027, 10039, 10451, 10026.
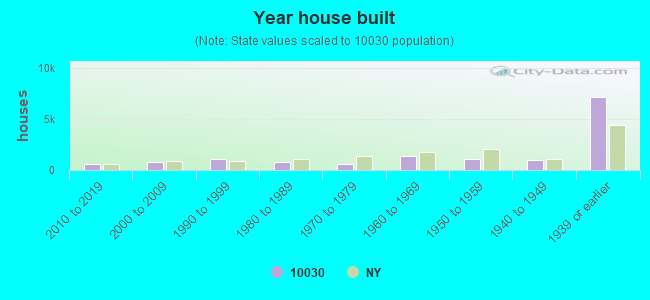

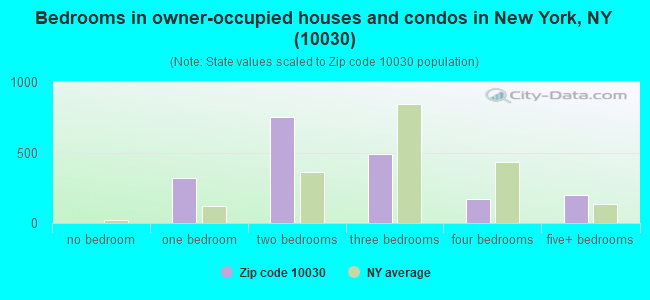
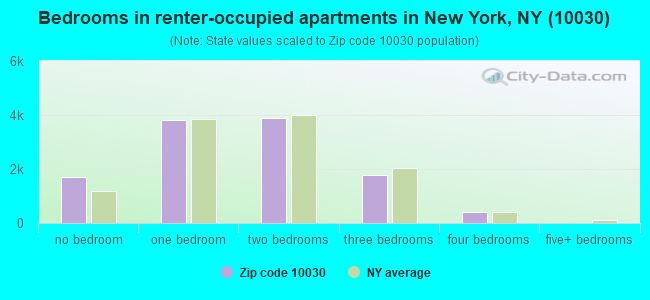
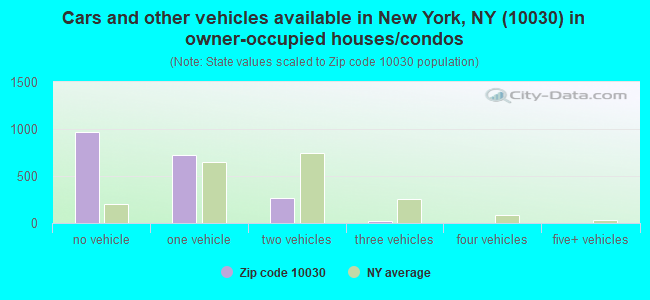
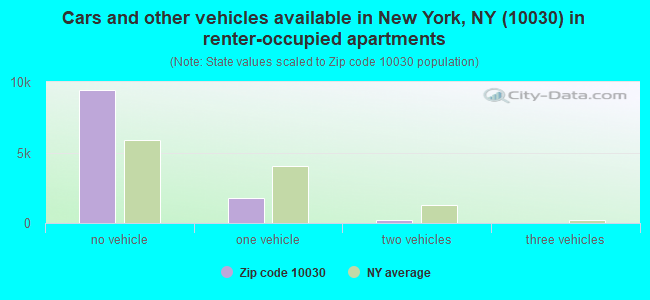


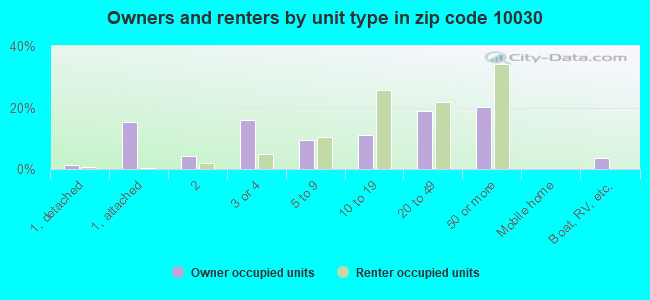
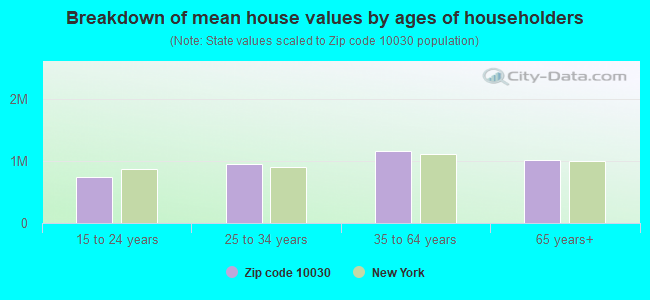


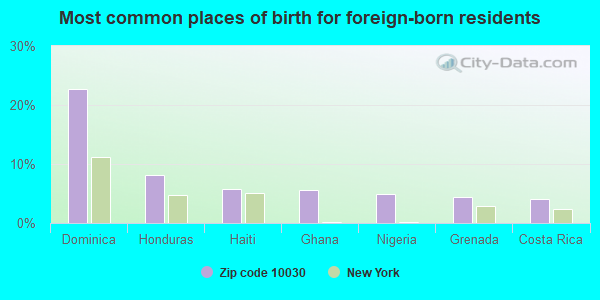
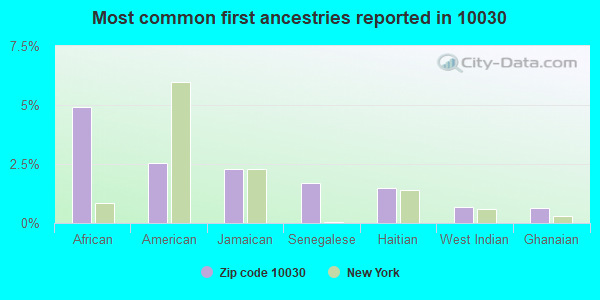
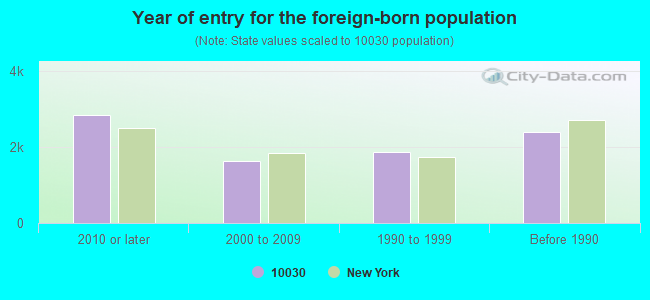


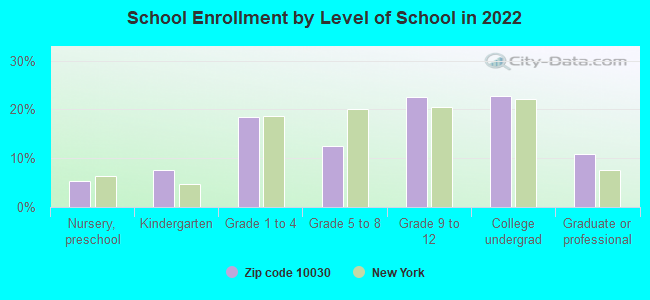
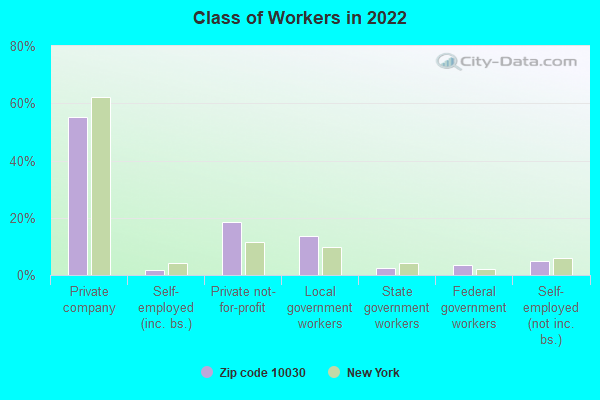
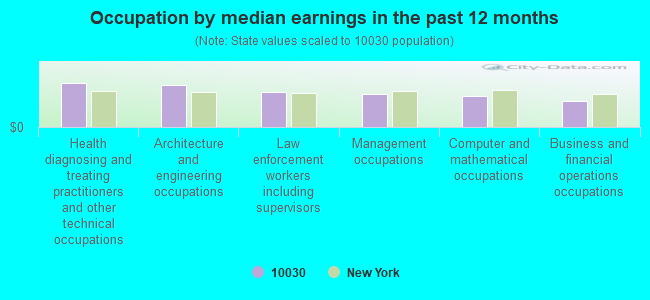
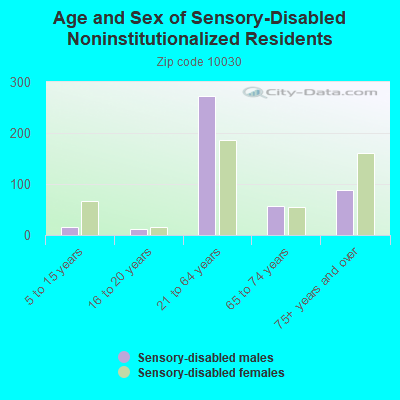
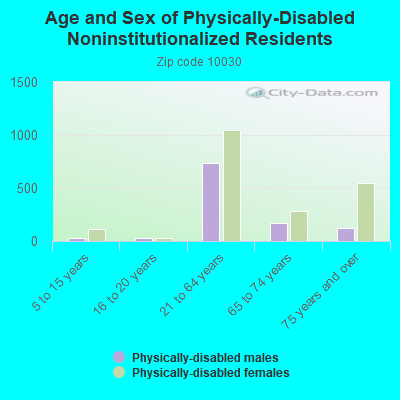
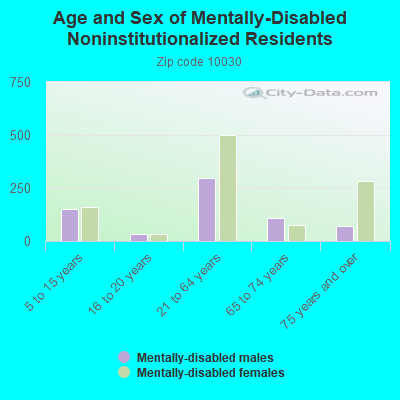
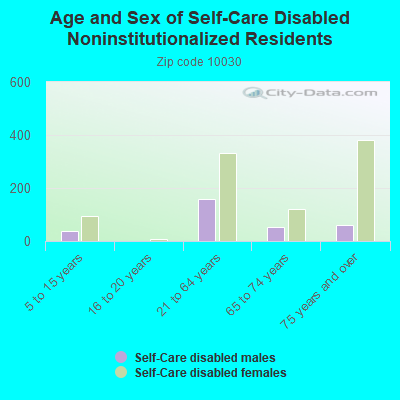
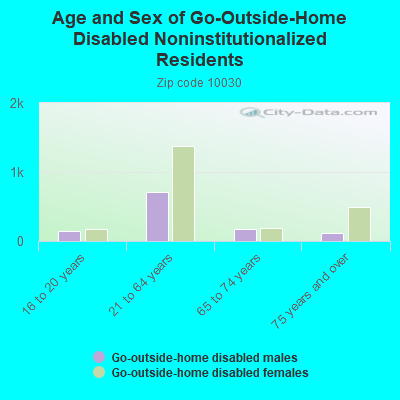
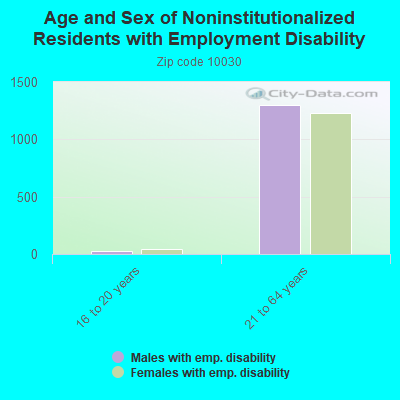
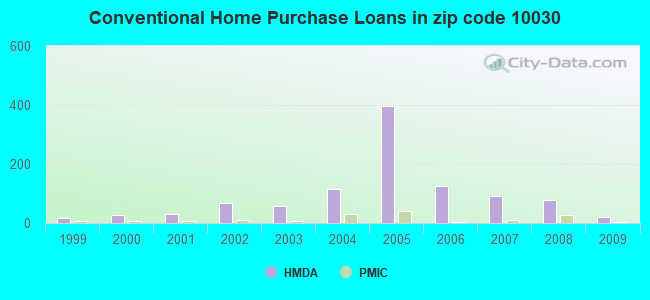
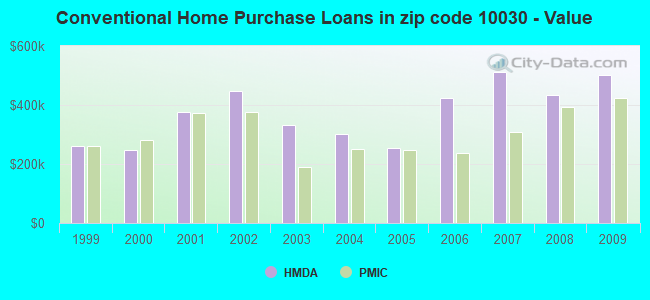
 According to the data from the years 2007 - 2018 the average number of fire incidents per year is 182. The highest number of reported fires - 226 took place in 2009, and the least - 145 in 2018. The data has a dropping trend.
 When looking into fire subcategories, the most reports belonged to: Structure Fires (80.1%), and Outside Fires (14.9%).