Estimated zip code population in 2022: 18,834 Zip code population in 2010: 17,416 Zip code population in 2000: 16,984
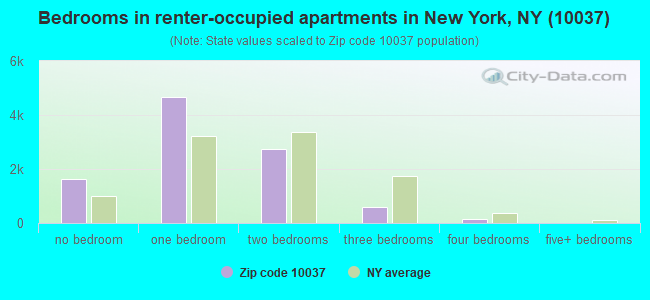
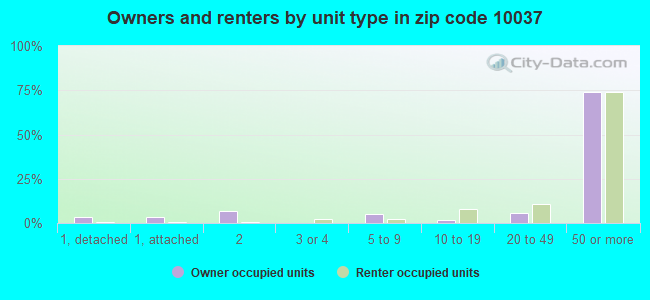
Houses and condos: 11,364 Renter-occupied apartments: 9,673
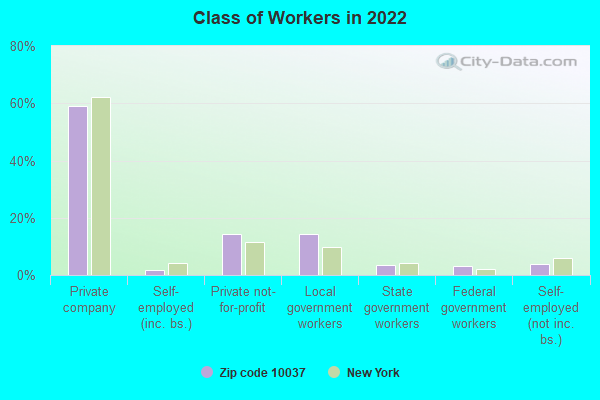
% of renters here:
93%
State:
46%
March 2022 cost of living index in zip code 10037: 142.6 (very high, U.S. average is 100)
Land area: 0.3 sq. mi. Water area: 0.0 sq. mi.
Population density: 71,345 people per square mile
(very high).
OSM Map
General Map
Google Map
MSN Map
OSM Map
General Map
Google Map
MSN Map
OSM Map
General Map
Google Map
MSN Map
OSM Map
General Map
Google Map
MSN Map
Please wait while loading the map...
Real estate property taxes paid for housing units in 2022:
This zip code:
0.3% ($2,428)
New York:
1.5% ($6,180)
Median real estate property taxes paid for housing units with mortgages in 2022: $9,858 (1.3%) Median real estate property taxes paid for housing units with no mortgage in 2022: $1,579 (0.2%)
According to our research of New York and other state lists, there were 21 registered sex offenders living in 10037 zip code as of April 27, 2024. The ratio of all residents to sex offenders in zip code 10037 is 971 to 1. The ratio of registered sex offenders to all residents in this zip code is near the state average.
Median resident age:
This zip code:
40.0 years
New York median age:
40.0 years
Average household size:
This zip code:
1.8 people
New York:
2.5 people
Averages for the 2020 tax year for zip code 10037, filed in 2021:
Average Adjusted Gross Income (AGI) in 2020: $53,721 (Individual Income Tax Returns)
Here:
$53,721
State:
$90,930
Salary/wage: $51,835 (reported on 80.5% of returns)
Here:
$51,835
State:
$72,104
(% of AGI for various income ranges: 834.4% for AGIs below $25k, 3321.0% for AGIs $25k-50k, 6710.8% for AGIs $50k-75k, 10539.4% for AGIs $75k-100k, 18693.3% for AGIs $100k-200k, 74864.3% for AGIs over 200k)
Taxable interest for individuals: $461 (reported on 17.5% of returns)
This zip code:
$461
New York:
$3,075
(% of AGI for various income ranges: 3.1% for AGIs below $25k, 3.2% for AGIs $25k-50k, 6.6% for AGIs $50k-75k, 15.4% for AGIs $75k-100k, 45.0% for AGIs $100k-200k, 288.6% for AGIs over 200k)
Ordinary dividends: $1,973 (reported on 8.8% of returns)
Here:
$1,973
State:
$11,095
(% of AGI for various income ranges: 8.2% for AGIs below $25k, 8.4% for AGIs $25k-50k, 15.2% for AGIs $50k-75k, 31.5% for AGIs $75k-100k, 65.3% for AGIs $100k-200k, 815.7% for AGIs over 200k)
Net capital gain/loss in AGI: +$5,118 (reported on 8.3% of returns)
Here:
+$5,118
State:
+$44,925
(% of AGI for various income ranges: 5.0% for AGIs below $25k, 2.9% for AGIs $25k-50k, 17.1% for AGIs $50k-75k, 15.8% for AGIs $75k-100k, 210.3% for AGIs $100k-200k, 3652.9% for AGIs over 200k)
Profit/loss from business: +$6,311 (reported on 16.7% of returns)
Here:
+$6,311
State:
+$14,940
(% of AGI for various income ranges: 148.2% for AGIs below $25k, 61.1% for AGIs $25k-50k, 75.9% for AGIs $50k-75k, 98.2% for AGIs $75k-100k, 422.2% for AGIs $100k-200k, 1967.1% for AGIs over 200k)
Taxable individual retirement arrangement distribution: $12,976 (reported on 3.2% of returns)
10037:
$12,976
New York:
$19,609
(% of AGI for various income ranges: 19.5% for AGIs below $25k, 34.6% for AGIs $25k-50k, 58.1% for AGIs $50k-75k, 109.0% for AGIs $75k-100k, 236.7% for AGIs $100k-200k)
Total itemized deductions: $23,862 (reported on 6.2% of returns)
Here:
$23,862
State:
$39,326
(% of AGI for various income ranges: 11.4% for AGIs below $25k, 52.9% for AGIs $25k-50k, 138.0% for AGIs $50k-75k, 471.4% for AGIs $75k-100k, 945.6% for AGIs $100k-200k, 3794.3% for AGIs over 200k)
Charity contributions: $8,575 (reported on 5.4% of returns)
Here:
$8,575
State:
$15,420
(% of AGI for various income ranges: 16.1% for AGIs $25k-50k, 45.6% for AGIs $50k-75k, 140.8% for AGIs $75k-100k, 322.7% for AGIs $100k-200k, 1157.1% for AGIs over 200k)
Taxes paid: $7,794 (reported on 6.2% of returns)
10037:
$7,794
State:
$9,183
(% of AGI for various income ranges: 13.0% for AGIs $25k-50k, 35.0% for AGIs $50k-75k, 169.0% for AGIs $75k-100k, 350.9% for AGIs $100k-200k, 1184.3% for AGIs over 200k)
Earned income credit: $2,186 (reported on 19.6% of returns)
Here:
$2,186
State:
$2,138
(% of AGI for various income ranges: 120.3% for AGIs below $25k, 60.2% for AGIs $25k-50k)
Percentage of individuals using paid preparers for their 2020 taxes: 92.7%
Here:
93%
State:
95%
(% for various income ranges: 92.3% for AGIs below $25k, 93.0% for AGIs $25k-50k, 93.7% for AGIs $50k-75k, 92.3% for AGIs $75k-100k, 92.5% for AGIs $100k-200k, 90.5% for AGIs over 200k)
Averages for the 2012 tax year for zip code 10037, filed in 2013:
Average Adjusted Gross Income (AGI) in 2012: $42,259 (Individual Income Tax Returns)
Here:
$42,259
State:
$77,088
Salary/wage: $41,361 (reported on 83.7% of returns)
Here:
$41,361
State:
$60,593
(% of AGI for various income ranges: 64.0% for AGIs below $25k, 84.7% for AGIs $25k-50k, 85.4% for AGIs $50k-75k, 85.3% for AGIs $75k-100k, 84.3% for AGIs $100k-200k, 76.1% for AGIs over 200k)
Taxable interest for individuals: $296 (reported on 21.6% of returns)
This zip code:
$296
New York:
$3,125
(% of AGI for various income ranges: 0.2% for AGIs below $25k, 0.1% for AGIs $25k-50k, 0.1% for AGIs $50k-75k, 0.1% for AGIs $75k-100k, 0.2% for AGIs $100k-200k, 0.2% for AGIs over 200k)
Ordinary dividends: $1,429 (reported on 7.8% of returns)
Here:
$1,429
State:
$10,299
(% of AGI for various income ranges: 0.6% for AGIs below $25k, 0.2% for AGIs $25k-50k, 0.2% for AGIs $50k-75k, 0.1% for AGIs $75k-100k, 0.3% for AGIs $100k-200k, 0.7% for AGIs over 200k)
Net capital gain/loss in AGI: +$1,002 (reported on 5.0% of returns)
Here:
+$1,002
State:
+$42,474
(% of AGI for various income ranges: 0.2% for AGIs $100k-200k, 2.8% for AGIs over 200k)
Profit/loss from business: +$5,795 (reported on 16.3% of returns)
Here:
+$5,795
State:
+$16,168
(% of AGI for various income ranges: 13.4% for AGIs below $25k, 0.6% for AGIs $25k-50k, 0.3% for AGIs $50k-75k, 0.7% for AGIs $75k-100k, 0.9% for AGIs $100k-200k, 1.7% for AGIs over 200k)
Taxable individual retirement arrangement distribution: $11,414 (reported on 3.7% of returns)
10037:
$11,414
New York:
$17,621
(% of AGI for various income ranges: 0.9% for AGIs below $25k, 1.0% for AGIs $25k-50k, 0.7% for AGIs $50k-75k, 1.1% for AGIs $75k-100k, 1.7% for AGIs $100k-200k)
Self-employment retirement plans: $8,600 (reported on 0.2% of returns)
10037:
$8,600
New York:
$27,330
Total itemized deductions: $17,032 (22% of AGI, reported on 28.8% of returns)
Here:
$17,032
State:
$34,985
Here:
22.0% of AGI
State:
21.3% of AGI
(% of AGI for various income ranges: 3.6% for AGIs below $25k, 8.7% for AGIs $25k-50k, 12.2% for AGIs $50k-75k, 14.6% for AGIs $75k-100k, 16.0% for AGIs $100k-200k, 17.3% for AGIs over 200k)
Charity contributions: $3,567 (reported on 24.1% of returns)
Here:
$3,567
State:
$5,572
(% of AGI for various income ranges: 0.5% for AGIs below $25k, 1.6% for AGIs $25k-50k, 2.5% for AGIs $50k-75k, 2.7% for AGIs $75k-100k, 2.5% for AGIs $100k-200k, 1.5% for AGIs over 200k)
Taxes paid: $7,070 (reported on 28.5% of returns)
10037:
$7,070
State:
$18,656
(% of AGI for various income ranges: 0.5% for AGIs below $25k, 2.0% for AGIs $25k-50k, 4.5% for AGIs $50k-75k, 6.9% for AGIs $75k-100k, 8.4% for AGIs $100k-200k, 10.0% for AGIs over 200k)
Earned income credit: $2,192 (reported on 25.4% of returns)
Here:
$2,192
State:
$2,230
(% of AGI for various income ranges: 9.1% for AGIs below $25k, 0.8% for AGIs $25k-50k)
Percentage of individuals using paid preparers for their 2012 taxes: 60.7%
Here:
61%
State:
66%
(% for various income ranges: 58.5% for AGIs below $25k, 59.8% for AGIs $25k-50k, 61.5% for AGIs $50k-75k, 64.3% for AGIs $75k-100k, 69.6% for AGIs $100k-200k, 85.7% for AGIs over 200k)
Averages for the 2004 tax year for zip code 10037, filed in 2005:
Average Adjusted Gross Income (AGI) in 2004: $33,894 (Individual Income Tax Returns)
Here:
$33,894
State:
$59,519
Salary/wage: $33,355 (reported on 85.1% of returns)
Here:
$33,355
State:
$50,673
(% of AGI for various income ranges: 67.1% for AGIs below $10k, 71.9% for AGIs $10k-25k, 89.2% for AGIs $25k-50k, 87.1% for AGIs $50k-75k, 82.3% for AGIs $75k-100k, 75.7% for AGIs over 100k)
Taxable interest for individuals: $567 (reported on 27.2% of returns)
This zip code:
$567
New York:
$2,377
(% of AGI for various income ranges: 0.9% for AGIs below $10k, 0.7% for AGIs $10k-25k, 0.3% for AGIs $25k-50k, 0.5% for AGIs $50k-75k, 0.3% for AGIs $75k-100k, 0.5% for AGIs over 100k)
Taxable dividends: $644 (reported on 8.6% of returns)
Here:
$644
State:
$5,394
(% of AGI for various income ranges: 0.4% for AGIs below $10k, 0.2% for AGIs $10k-25k, 0.1% for AGIs $25k-50k, 0.1% for AGIs $50k-75k, 0.1% for AGIs $75k-100k, 0.3% for AGIs over 100k)
Net capital gain/loss: +$1,842 (reported on 4.9% of returns)
Here:
+$1,842
State:
+$23,581
(% of AGI for various income ranges: -0.5% for AGIs below $10k, -0.0% for AGIs $10k-25k, -0.0% for AGIs $25k-50k, -0.0% for AGIs $50k-75k, 0.7% for AGIs $75k-100k, 2.2% for AGIs over 100k)
Profit/loss from business: +$3,323 (reported on 11.9% of returns)
Here:
+$3,323
State:
+$13,809
(% of AGI for various income ranges: 21.8% for AGIs below $10k, 5.6% for AGIs $10k-25k, -0.4% for AGIs $25k-50k, -0.3% for AGIs $50k-75k, 0.1% for AGIs $75k-100k, 0.9% for AGIs over 100k)
IRA payment deduction: $1,547 (reported on 1.2% of returns)
10037:
$1,547
New York:
$3,115
Total itemized deductions: $15,170 (27% of AGI, reported on 34.0% of returns)
Here:
$15,170
State:
$25,864
Here:
27.2% of AGI
State:
21.9% of AGI
(% of AGI for various income ranges: 5.4% for AGIs below $10k, 5.9% for AGIs $10k-25k, 14.7% for AGIs $25k-50k, 19.1% for AGIs $50k-75k, 19.4% for AGIs $75k-100k, 17.7% for AGIs over 100k)
Charity contributions deductions: $4,017 (7% of AGI, reported on 32.2% of returns)
Here:
$4,017
State:
$4,439
Here:
7.2% of AGI
State:
3.6% of AGI
(% of AGI for various income ranges: 0.2% for AGIs below $10k, 1.3% for AGIs $10k-25k, 3.9% for AGIs $25k-50k, 4.9% for AGIs $50k-75k, 4.7% for AGIs $75k-100k, 3.9% for AGIs over 100k)
Total tax: $4,123 (reported on 72.4% of returns)
10037:
$4,123
State:
$11,730
(% of AGI for various income ranges: 3.7% for AGIs below $10k, 3.5% for AGIs $10k-25k, 6.5% for AGIs $25k-50k, 10.6% for AGIs $50k-75k, 12.8% for AGIs $75k-100k, 17.1% for AGIs over 100k)
Earned income credit: $1,810 (reported on 25.2% of returns)
Here:
$1,810
State:
$1,757
Percentage of individuals using paid preparers for their 2004 taxes: 68.9%
Here:
69%
State:
67%
(% for various income ranges: 67.0% for AGIs below $10k, 72.0% for AGIs $10k-25k, 66.8% for AGIs $25k-50k, 68.4% for AGIs $50k-75k, 75.6% for AGIs $75k-100k, 72.2% for AGIs over 100k)
Likely homosexual households (counted as self-reported same-sex unmarried-partner households)
Lesbian couples: 0.6% of all households
Gay men: 0.3% of all households
Household received Food Stamps/SNAP in the past 12 months: 2,293 Household did not receive Food Stamps/SNAP in the past 12 months: 8,106
Women who had a birth in the past 12 months: 164 (115 now married, 48 unmarried) Women who did not have a birth in the past 12 months: 4,944 (974 now married, 4,010 unmarried)
Housing units in zip code 10037 with a mortgage: 237 Residents with income below the poverty level in 2022:
This zip code:
28.8%
Whole state:
14.3%
Residents with income below 50% of the poverty level in 2022:
This zip code:
12.9%
Whole state:
6.8%
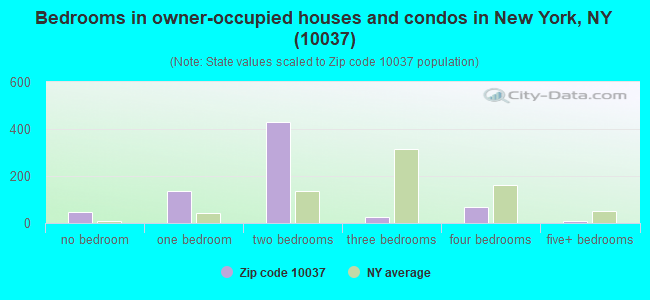
Median number of rooms in houses and condos:
Here:
3.9
State:
6.3
Median number of rooms in apartments:
Here:
3.0
State:
3.8
Notable locations in this zip code not listed on our city pages
Churches in zip code 10037 include: Saint Mark's Roman Catholic Church (A), Union Congregational Church (B), Saint Ambrose Episcopal Church (C). Display/hide their locations on the map
Parks in zip code 10037 include: McCray Playground (1), Howard Bennett Playground (2), Abe Lincoln Playground (3), Moore Playground (4), Courtney Callender Playground (5). Display/hide their locations on the map
1,081 married couples with children.
1,536 single-parent households (32 men, 1,504 women).
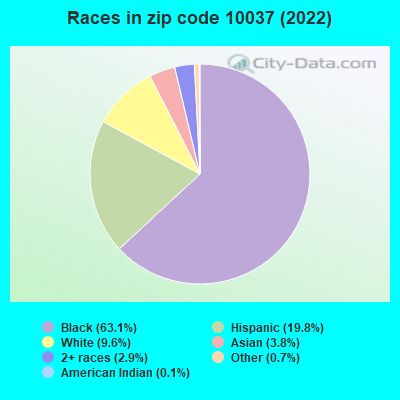
73.6% of residents of 10037 zip code speak English at home.
15.2% of residents speak Spanish at home (72% very well, 13% well, 7% not well, 7% not at all).
3.5% of residents speak other Indo-European language at home (75% very well, 22% well, 3% not well).
2.7% of residents speak Asian or Pacific Island language at home (46% very well, 25% well, 7% not well, 22% not at all).
5.4% of residents speak other language at home (71% very well, 17% well, 12% not well).
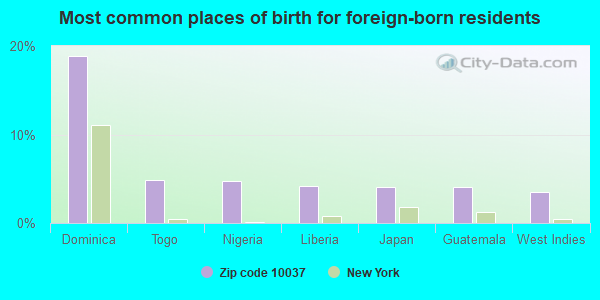
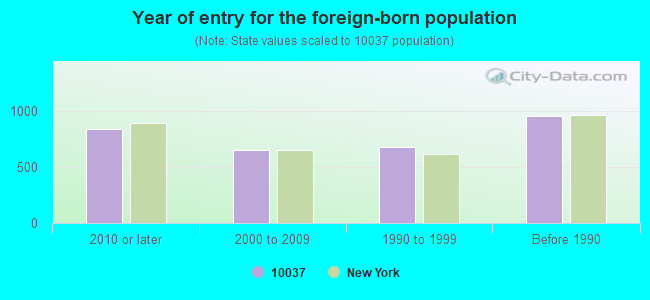
Foreign born population: 2,648 (14.1%) (47.3% of them are naturalized citizens)
Facilities with environmental interests located in this zip code:
25 WEST 132ND ST BUILDING (25 WEST 132 STREET in NEW YORK, NY)
AIR MINOR (AIRS/AFS) STATE MASTER (New York facility tracking) - AIR PROGRAM Business SIC classification: OPERATORS OF APARTMENT BUILDINGS Business NAICS classification: LESSORS OF RESIDENTIAL BUILDINGS AND DWELLINGS. Organizations: HAMPTON MANAGEMENT COMPANY LLC (AIR FEE BILLING CONTACT)
, LENOX TERRACE DEVELOPMENT ASSN (AIR PERMIT CONTACT)
, FIFTH LENOX TERRACE ASSOC (LEGALLY RESPONSIBLE PARTY)
, THIRD LENOX TERRACE ASSOCIATION (LEGALLY RESPONSIBLE PARTY)
Alternative names: 25 WEST 132 STREET BUILDING
494 LENOX CLEANERS (494 LENOX AVENUE in NEW YORK CITY, NY)
AIR MINOR (AIRS/AFS) STATE MASTER (New York facility tracking) - AIR PROGRAM, HAZARDOUS WASTE PROGRAM (Resource Conservation and Recovery Act (tracking hazardous waste)) Business SIC classification: DRYCLEANING PLANTS, EXCEPT RUG CLEANING Business NAICS classification: DRYCLEANING AND LAUNDRY SERVICES (EXCEPT COIN-OPERATED). Organizations: LENOX CLEANERS CORP (LEGALLY RESPONSIBLE PARTY)
, 494 LENOX CLEANERS CORP (LEGALLY RESPONSIBLE PARTY)
Alternative names: LENOX CLEANERS CORPoration
45 WEST 132 STREET BUILDING (45 W 132ND ST in NEW YORK, NY)
AIR MINOR (AIRS/AFS) STATE MASTER (New York facility tracking) - AIR PROGRAM Business SIC classification: OPERATORS OF APARTMENT BUILDINGS Business NAICS classification: LESSORS OF RESIDENTIAL BUILDINGS AND DWELLINGS. Organizations: HAMPTON MANAGEMENT COMPANY LLC (AIR FEE BILLING CONTACT)
, LENOX TERRACE DEVELOPMENT ASSN (AIR PERMIT CONTACT)
, FIFTH LENOX TERRACE ASSOC (LEGALLY RESPONSIBLE PARTY)
10 WEST 135TH ST BUILDING (10 WEST 135 STREET in NEW YORK, NY)
AIR MINOR (AIRS/AFS) STATE MASTER (New York facility tracking) - AIR PROGRAM Business SIC classification: OPERATORS OF APARTMENT BUILDINGS Business NAICS classification: LESSORS OF RESIDENTIAL BUILDINGS AND DWELLINGS. Organizations: HAMPTON MANAGEMENT COMPANY LLC (AIR FEE BILLING CONTACT)
, LENOX TERRACE DEVELOPMENT ASSN (AIR PERMIT CONTACT)
Alternative names: 10 WEST 135 STREET BUILDING
2350 FIFTH AVENUE CORP (2350 5TH AVE in NEW YORK, NY)
HAZARDOUS WASTE BIENNIAL REPORTER (Resource Conservation and Recovery Act (tracking hazardous waste)) (Resource Conservation and Recovery Act (tracking hazardous waste))
AMTRAK HELLGATE BRIDGE (OVER 138TH ST in NEW YORK, NY)
(Resource Conservation and Recovery Act (tracking hazardous waste)) Organizations: NATIONAL RAILRAOD PASSENGER CO (CONTACT/OWNER)
CON ED - MH 39273 (SWC E 131 ST & LEXINGTON AVE in NEW YORK, NY)
HAZARDOUS WASTE BIENNIAL REPORTER (Resource Conservation and Recovery Act (tracking hazardous waste)) (Resource Conservation and Recovery Act (tracking hazardous waste))
ABAX INC (8 W 132ND ST APT 9F in NEW YORK, NY)
Small Quantity Generators, between 100 kg and 1000 kg of hazardous waste/month (Resource Conservation and Recovery Act (tracking hazardous waste)) - notification Organizations: NYCHPD - HOUSING PRESERVATION & DEV (CONTACT/OWNER)
ABAX INC (653 LENOX AVE APT 17 in NEW YORK, NY)
Small Quantity Generators, between 100 kg and 1000 kg of hazardous waste/month (Resource Conservation and Recovery Act (tracking hazardous waste)) - notification Organizations: NYCHPD - HOUSING PRESERVATION & DEV (CONTACT/OWNER)
Housing units lacking complete plumbing facilities: 1.1% Housing units lacking complete kitchen facilities: 1.2%
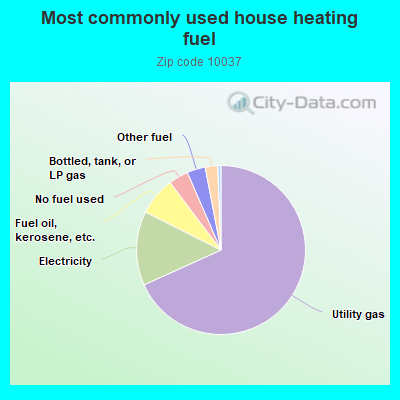
68.3%Utility gas
14.2%Electricity
7.3%Fuel oil, kerosene, etc.
3.8%No fuel used
3.5%Other fuel
2.4%Bottled, tank, or LP gas
Population in 1990: 14,982. Population change in the 1990s: +2,002 (+13.4%).
Place of birth for U.S.-born residents:
This state: 11,132
Northeast: 1,094
Midwest: 630
South: 2,196
West: 633
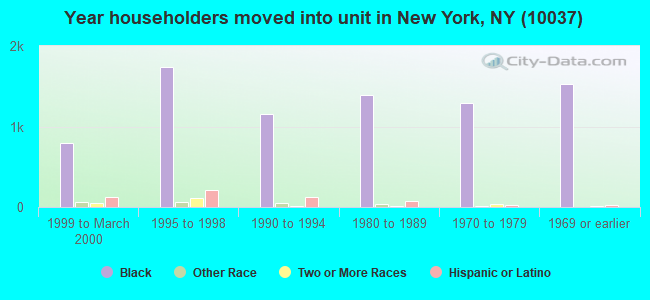
69% of the 10037 zip code residents lived in the same house 5 years ago. Out of people who lived in different houses, 59% lived in this county. Out of people who lived in different counties, 50% lived in New York.
91% of the 10037 zip code residents lived in the same house 1 year ago. Out of people who lived in different houses, 50% moved from this county. Out of people who lived in different houses, 20% moved from different county within same state. Out of people who lived in different houses, 25% moved from different state. Out of people who lived in different houses, 6% moved from abroad.
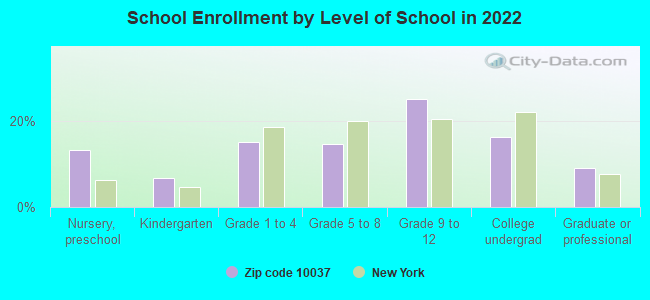
Private vs. public school enrollment:
Students in private schools in grades 1 to 8 (elementary and middle school): 196
Here:
17.4%
New York:
15.6%
Students in private schools in grades 9 to 12 (high school):
Here:
0.0%
New York:
15.0%
Students in private undergraduate colleges: 243
Here:
39.6%
New York:
39.2%
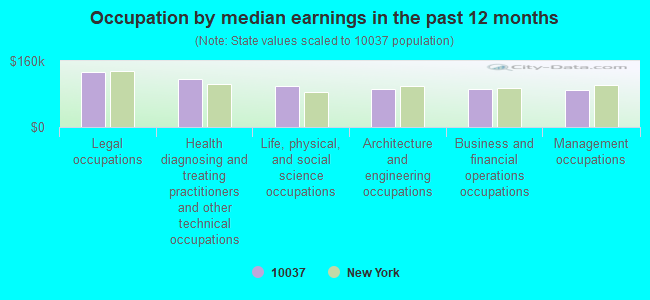
Occupation by median earnings in the past 12 months ($)
133,365Legal occupations
115,962Health diagnosing and treating practitioners and other technical occupations
99,748Life, physical, and social science occupations
93,149Architecture and engineering occupations
91,412Business and financial operations occupations
89,217Management occupations
Top industries in this zip code by the number of employees in 2005:
Health Care and Social Assistance: General Medical and Surgical Hospitals (over 1000 employees: 1 establishment)
Health Care and Social Assistance: Child and Youth Services (100-249: 1)
Health Care and Social Assistance: Nursing Care Facilities (100-249: 1)
Real Estate and Rental and Leasing: Lessors of Residential Buildings and Dwellings (20-49: 1, 10-19: 6, 5-9: 3, 1-4: 9)
Health Care and Social Assistance: Child Day Care Services (20-49: 2, 10-19: 1, 5-9: 1)
Information: Libraries and Archives (50-99: 1)
Educational Services: Elementary and Secondary Schools (20-49: 2)
2007 - 2018 National Fire Incident Reporting System (NFIRS) incidents
Based on the data from the years 2007 - 2018 the average number of fire incidents per year is 95. The highest number of fire incidents - 121 took place in 2013, and the least - 44 in 2007. The data has an increasing trend.
When looking into fire subcategories, the most reports belonged to: Structure Fires (82.5%), and Outside Fires (11.9%).
Fire incident types reported to NFIRS in Zip Code 10037

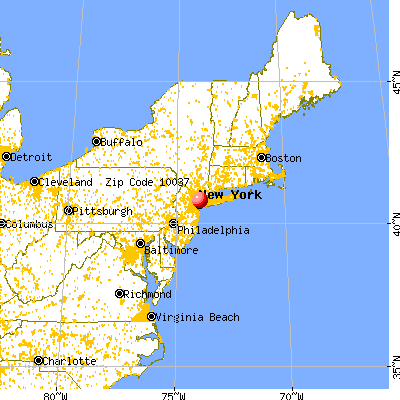


 Nearest zip codes: 10030, 10451, 10027, 10031, 10039, 10026.


 Based on the data from the years 2007 - 2018 the average number of fire incidents per year is 95. The highest number of fire incidents - 121 took place in 2013, and the least - 44 in 2007. The data has an increasing trend.
 When looking into fire subcategories, the most reports belonged to: Structure Fires (82.5%), and Outside Fires (11.9%).