Estimated zip code population in 2022: 37,657 Zip code population in 2010: 34,003 Zip code population in 2000: 30,377
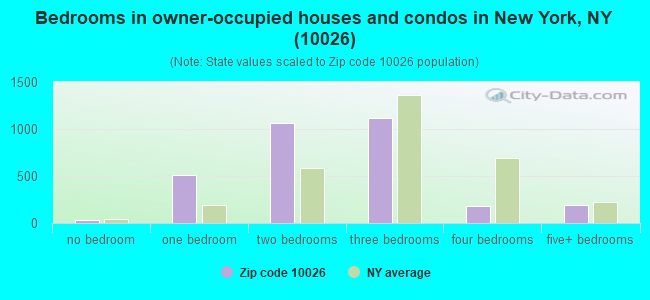
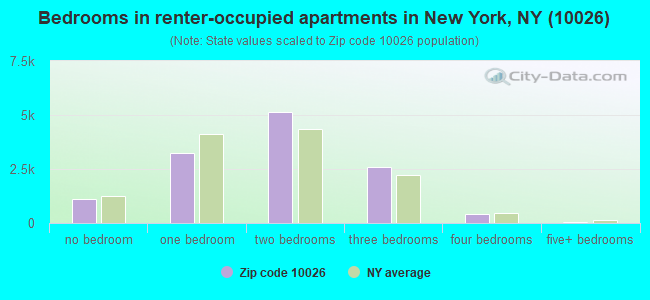
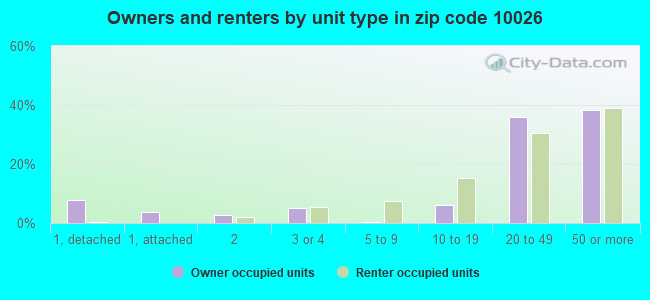
Houses and condos: 17,493 Renter-occupied apartments: 12,551
% of renters here:
80%
State:
46%
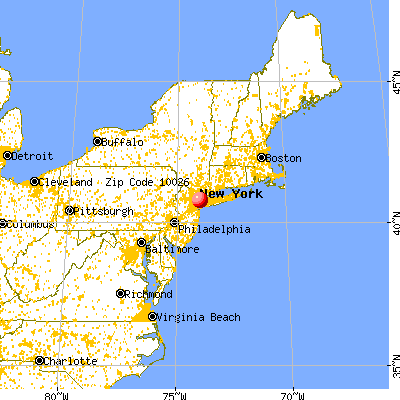
March 2022 cost of living index in zip code 10026: 160.7 (very high, U.S. average is 100)
Land area: 0.3 sq. mi. Water area: 0.0 sq. mi.
Population density: 113,310 people per square mile
(very high).
OSM Map
General Map
Google Map
MSN Map
OSM Map
General Map
Google Map
MSN Map
OSM Map
General Map
Google Map
MSN Map
OSM Map
General Map
Google Map
MSN Map
Please wait while loading the map...
Real estate property taxes paid for housing units in 2022:
This zip code:
0.3% ($3,522)
New York:
1.5% ($6,180)
Median real estate property taxes paid for housing units with mortgages in 2022: $4,104 (0.4%) Median real estate property taxes paid for housing units with no mortgage in 2022: $3,412 (0.4%)
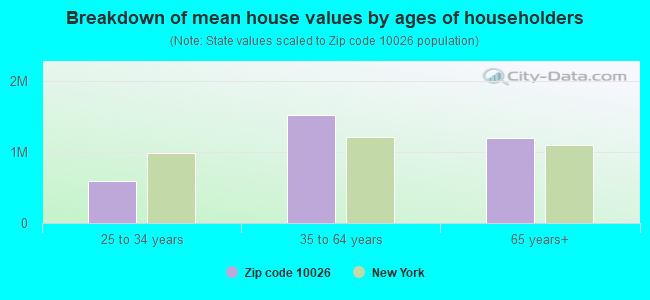
Estimated median house/condo value in 2022: $1,074,127
10026:
$1,074,127
New York:
$400,400
According to our research of New York and other state lists, there were 27 registered sex offenders living in 10026 zip code as of April 27, 2024. The ratio of all residents to sex offenders in zip code 10026 is 1,448 to 1. The ratio of registered sex offenders to all residents in this zip code is lower than the state average.
Median resident age:
This zip code:
36.7 years
New York median age:
40.0 years
Average household size:
This zip code:
2.3 people
New York:
2.5 people
Averages for the 2020 tax year for zip code 10026, filed in 2021:
Average Adjusted Gross Income (AGI) in 2020: $74,982 (Individual Income Tax Returns)
Here:
$74,982
State:
$90,930
Salary/wage: $70,873 (reported on 81.5% of returns)
Here:
$70,873
State:
$72,104
(% of AGI for various income ranges: 890.0% for AGIs below $25k, 3449.8% for AGIs $25k-50k, 7104.5% for AGIs $50k-75k, 10920.2% for AGIs $75k-100k, 20055.6% for AGIs $100k-200k, 112355.8% for AGIs over 200k)
Taxable interest for individuals: $1,002 (reported on 22.7% of returns)
This zip code:
$1,002
New York:
$3,075
(% of AGI for various income ranges: 5.0% for AGIs below $25k, 6.4% for AGIs $25k-50k, 16.1% for AGIs $50k-75k, 25.1% for AGIs $75k-100k, 54.7% for AGIs $100k-200k, 685.0% for AGIs over 200k)
Ordinary dividends: $5,203 (reported on 16.2% of returns)
Here:
$5,203
State:
$11,095
(% of AGI for various income ranges: 13.9% for AGIs below $25k, 16.2% for AGIs $25k-50k, 38.2% for AGIs $50k-75k, 89.1% for AGIs $75k-100k, 212.4% for AGIs $100k-200k, 2771.7% for AGIs over 200k)
Net capital gain/loss in AGI: +$24,433 (reported on 15.2% of returns)
Here:
+$24,433
State:
+$44,925
(% of AGI for various income ranges: 8.5% for AGIs below $25k, 13.7% for AGIs $25k-50k, 59.7% for AGIs $50k-75k, 110.8% for AGIs $75k-100k, 373.3% for AGIs $100k-200k, 16596.9% for AGIs over 200k)
Profit/loss from business: +$11,866 (reported on 21.9% of returns)
Here:
+$11,866
State:
+$14,940
(% of AGI for various income ranges: 209.4% for AGIs below $25k, 167.5% for AGIs $25k-50k, 191.2% for AGIs $50k-75k, 360.1% for AGIs $75k-100k, 788.3% for AGIs $100k-200k, 4300.0% for AGIs over 200k)
Taxable individual retirement arrangement distribution: $19,038 (reported on 2.6% of returns)
10026:
$19,038
New York:
$19,609
(% of AGI for various income ranges: 11.3% for AGIs below $25k, 36.3% for AGIs $25k-50k, 59.6% for AGIs $50k-75k, 73.8% for AGIs $75k-100k, 146.8% for AGIs $100k-200k, 986.9% for AGIs over 200k)
Self-employed (Keogh) retirement plans: $33,594 (reported on 0.9% of returns)
10026:
$33,594
New York:
$32,497
(% of AGI for various income ranges: 4.8% for AGIs below $25k, 11.9% for AGIs $50k-75k, 75.0% for AGIs $100k-200k, 1220.8% for AGIs over 200k)
Total itemized deductions: $33,023 (reported on 9.1% of returns)
Here:
$33,023
State:
$39,326
(% of AGI for various income ranges: 22.8% for AGIs below $25k, 63.2% for AGIs $25k-50k, 188.8% for AGIs $50k-75k, 527.8% for AGIs $75k-100k, 1067.7% for AGIs $100k-200k, 8250.6% for AGIs over 200k)
Charity contributions: $10,396 (reported on 7.7% of returns)
Here:
$10,396
State:
$15,420
(% of AGI for various income ranges: 2.0% for AGIs below $25k, 12.2% for AGIs $25k-50k, 34.4% for AGIs $50k-75k, 110.8% for AGIs $75k-100k, 234.6% for AGIs $100k-200k, 2655.0% for AGIs over 200k)
Taxes paid: $8,746 (reported on 9.0% of returns)
10026:
$8,746
State:
$9,183
(% of AGI for various income ranges: 4.7% for AGIs below $25k, 12.5% for AGIs $25k-50k, 50.5% for AGIs $50k-75k, 187.7% for AGIs $75k-100k, 387.9% for AGIs $100k-200k, 1748.9% for AGIs over 200k)
Earned income credit: $2,062 (reported on 20.3% of returns)
Here:
$2,062
State:
$2,138
(% of AGI for various income ranges: 116.9% for AGIs below $25k, 67.5% for AGIs $25k-50k)
Percentage of individuals using paid preparers for their 2020 taxes: 94.3%
Here:
94%
State:
95%
(% for various income ranges: 93.2% for AGIs below $25k, 94.9% for AGIs $25k-50k, 94.2% for AGIs $50k-75k, 94.3% for AGIs $75k-100k, 95.0% for AGIs $100k-200k, 95.9% for AGIs over 200k)
Averages for the 2012 tax year for zip code 10026, filed in 2013:
Average Adjusted Gross Income (AGI) in 2012: $54,078 (Individual Income Tax Returns)
Here:
$54,078
State:
$77,088
Salary/wage: $53,986 (reported on 83.6% of returns)
Here:
$53,986
State:
$60,593
(% of AGI for various income ranges: 68.8% for AGIs below $25k, 90.7% for AGIs $25k-50k, 91.0% for AGIs $50k-75k, 90.7% for AGIs $75k-100k, 88.1% for AGIs $100k-200k, 74.8% for AGIs over 200k)
Taxable interest for individuals: $731 (reported on 22.9% of returns)
This zip code:
$731
New York:
$3,125
(% of AGI for various income ranges: 0.2% for AGIs below $25k, 0.1% for AGIs $25k-50k, 0.2% for AGIs $50k-75k, 0.2% for AGIs $75k-100k, 0.3% for AGIs $100k-200k, 0.6% for AGIs over 200k)
Ordinary dividends: $3,250 (reported on 11.5% of returns)
Here:
$3,250
State:
$10,299
(% of AGI for various income ranges: 0.5% for AGIs below $25k, 0.2% for AGIs $25k-50k, 0.3% for AGIs $50k-75k, 0.5% for AGIs $75k-100k, 0.8% for AGIs $100k-200k, 1.2% for AGIs over 200k)
Net capital gain/loss in AGI: +$16,988 (reported on 9.6% of returns)
Here:
+$16,988
State:
+$42,474
(% of AGI for various income ranges: 0.3% for AGIs $50k-75k, 0.2% for AGIs $75k-100k, 0.7% for AGIs $100k-200k, 9.6% for AGIs over 200k)
Profit/loss from business: +$11,422 (reported on 23.3% of returns)
Here:
+$11,422
State:
+$16,168
(% of AGI for various income ranges: 22.6% for AGIs below $25k, 3.2% for AGIs $25k-50k, 2.3% for AGIs $50k-75k, 2.3% for AGIs $75k-100k, 3.2% for AGIs $100k-200k, 3.3% for AGIs over 200k)
Taxable individual retirement arrangement distribution: $14,340 (reported on 2.6% of returns)
10026:
$14,340
New York:
$17,621
(% of AGI for various income ranges: 0.4% for AGIs below $25k, 0.5% for AGIs $25k-50k, 0.7% for AGIs $50k-75k, 0.6% for AGIs $75k-100k, 0.8% for AGIs $100k-200k, 0.8% for AGIs over 200k)
Self-employment retirement plans: $16,871 (reported on 0.8% of returns)
10026:
$16,871
New York:
$27,330
(% of AGI for various income ranges: 0.2% for AGIs below $25k, 0.2% for AGIs $50k-75k, 0.3% for AGIs $100k-200k, 0.5% for AGIs over 200k)
Total itemized deductions: $25,141 (21% of AGI, reported on 29.9% of returns)
Here:
$25,141
State:
$34,985
Here:
20.6% of AGI
State:
21.3% of AGI
(% of AGI for various income ranges: 4.1% for AGIs below $25k, 8.8% for AGIs $25k-50k, 13.3% for AGIs $50k-75k, 16.2% for AGIs $75k-100k, 17.8% for AGIs $100k-200k, 16.9% for AGIs over 200k)
Charity contributions: $3,338 (reported on 24.3% of returns)
Here:
$3,338
State:
$5,572
(% of AGI for various income ranges: 0.4% for AGIs below $25k, 1.3% for AGIs $25k-50k, 1.9% for AGIs $50k-75k, 2.1% for AGIs $75k-100k, 1.8% for AGIs $100k-200k, 1.4% for AGIs over 200k)
Taxes paid: $12,830 (reported on 29.8% of returns)
10026:
$12,830
State:
$18,656
(% of AGI for various income ranges: 0.8% for AGIs below $25k, 2.8% for AGIs $25k-50k, 5.1% for AGIs $50k-75k, 7.7% for AGIs $75k-100k, 9.2% for AGIs $100k-200k, 10.8% for AGIs over 200k)
Earned income credit: $2,237 (reported on 29.2% of returns)
Here:
$2,237
State:
$2,230
(% of AGI for various income ranges: 10.5% for AGIs below $25k, 1.0% for AGIs $25k-50k)
Percentage of individuals using paid preparers for their 2012 taxes: 59.0%
Here:
59%
State:
66%
(% for various income ranges: 57.4% for AGIs below $25k, 58.6% for AGIs $25k-50k, 57.0% for AGIs $50k-75k, 59.5% for AGIs $75k-100k, 65.5% for AGIs $100k-200k, 72.7% for AGIs over 200k)
Averages for the 2004 tax year for zip code 10026, filed in 2005:
Average Adjusted Gross Income (AGI) in 2004: $31,561 (Individual Income Tax Returns)
Here:
$31,561
State:
$59,519
Salary/wage: $32,910 (reported on 86.6% of returns)
Here:
$32,910
State:
$50,673
(% of AGI for various income ranges: 69.0% for AGIs below $10k, 84.0% for AGIs $10k-25k, 95.9% for AGIs $25k-50k, 93.8% for AGIs $50k-75k, 93.6% for AGIs $75k-100k, 84.2% for AGIs over 100k)
Taxable interest for individuals: $420 (reported on 22.9% of returns)
This zip code:
$420
New York:
$2,377
(% of AGI for various income ranges: 0.8% for AGIs below $10k, 0.3% for AGIs $10k-25k, 0.2% for AGIs $25k-50k, 0.3% for AGIs $50k-75k, 0.5% for AGIs $75k-100k, 0.4% for AGIs over 100k)
Taxable dividends: $885 (reported on 8.0% of returns)
Here:
$885
State:
$5,394
(% of AGI for various income ranges: 0.6% for AGIs below $10k, 0.3% for AGIs $10k-25k, 0.1% for AGIs $25k-50k, 0.2% for AGIs $50k-75k, 0.3% for AGIs $75k-100k, 0.4% for AGIs over 100k)
Net capital gain/loss: +$4,331 (reported on 6.1% of returns)
Here:
+$4,331
State:
+$23,581
(% of AGI for various income ranges: -0.6% for AGIs below $10k, -0.1% for AGIs $10k-25k, -0.1% for AGIs $25k-50k, -0.1% for AGIs $50k-75k, 0.5% for AGIs $75k-100k, 4.8% for AGIs over 100k)
Profit/loss from business: +$6,176 (reported on 19.5% of returns)
Here:
+$6,176
State:
+$13,809
(% of AGI for various income ranges: 32.9% for AGIs below $10k, 10.1% for AGIs $10k-25k, 0.9% for AGIs $25k-50k, 0.5% for AGIs $50k-75k, 1.2% for AGIs $75k-100k, 2.6% for AGIs over 100k)
IRA payment deduction: $2,133 (reported on 1.5% of returns)
10026:
$2,133
New York:
$3,115
(% of AGI for various income ranges: 0.1% for AGIs below $10k, 0.1% for AGIs $10k-25k, 0.1% for AGIs $25k-50k, 0.1% for AGIs $50k-75k, 0.1% for AGIs $75k-100k, 0.0% for AGIs over 100k)
Self-employed pension: $9,879 (reported on 0.3% of returns)
Here:
$9,879
New York:
$19,016
Total itemized deductions: $16,967 (27% of AGI, reported on 26.8% of returns)
Here:
$16,967
State:
$25,864
Here:
26.8% of AGI
State:
21.9% of AGI
(% of AGI for various income ranges: 3.0% for AGIs below $10k, 5.6% for AGIs $10k-25k, 12.5% for AGIs $25k-50k, 18.7% for AGIs $50k-75k, 21.0% for AGIs $75k-100k, 19.9% for AGIs over 100k)
Charity contributions deductions: $3,098 (5% of AGI, reported on 24.4% of returns)
Here:
$3,098
State:
$4,439
Here:
4.9% of AGI
State:
3.6% of AGI
(% of AGI for various income ranges: 0.3% for AGIs below $10k, 0.9% for AGIs $10k-25k, 2.6% for AGIs $25k-50k, 3.3% for AGIs $50k-75k, 3.1% for AGIs $75k-100k, 2.4% for AGIs over 100k)
Total tax: $4,354 (reported on 67.9% of returns)
10026:
$4,354
State:
$11,730
(% of AGI for various income ranges: 5.3% for AGIs below $10k, 3.9% for AGIs $10k-25k, 6.1% for AGIs $25k-50k, 10.4% for AGIs $50k-75k, 12.8% for AGIs $75k-100k, 18.1% for AGIs over 100k)
Earned income credit: $1,827 (reported on 35.3% of returns)
Here:
$1,827
State:
$1,757
Percentage of individuals using paid preparers for their 2004 taxes: 68.2%
Here:
68%
State:
67%
(% for various income ranges: 66.4% for AGIs below $10k, 72.2% for AGIs $10k-25k, 65.4% for AGIs $25k-50k, 66.6% for AGIs $50k-75k, 67.9% for AGIs $75k-100k, 73.9% for AGIs over 100k)
Likely homosexual households (counted as self-reported same-sex unmarried-partner households)
Lesbian couples: 0.5% of all households
Gay men: 1.2% of all households
Household received Food Stamps/SNAP in the past 12 months: 2,132 Household did not receive Food Stamps/SNAP in the past 12 months: 13,397
Women who had a birth in the past 12 months: 348 (298 now married, 47 unmarried) Women who did not have a birth in the past 12 months: 10,619 (2,672 now married, 8,005 unmarried)
Housing units in zip code 10026 with a mortgage: 2,158 (146 second mortgage, 123 both second mortgage and home equity loan) Median monthly owner costs for units with a mortgage: $2,834 Median monthly owner costs for units without a mortgage: $941
Residents with income below the poverty level in 2022:
This zip code:
20.6%
Whole state:
14.3%
Residents with income below 50% of the poverty level in 2022:
This zip code:
10.7%
Whole state:
6.8%
Median number of rooms in houses and condos:
Here:
4.5
State:
6.3
Median number of rooms in apartments:
Here:
3.8
State:
3.8
Notable locations in this zip code not listed on our city pages
Notable locations in zip code 10026: A Philip Randolph Square (A), Douglas Circle (B), Harlem Community Center (C), Onehundredfifteenth Street Branch New York Public Library (D). Display/hide their locations on the map
Churches in zip code 10026 include: Calvary Christian Fellowship (A), Bethel Way of the Cross Church of Christ (B), Malcolm Shabazz Mosque Number 7 (C), First Corinthian Baptist Church (D), Memorial Canaan Baptist Church (E), Mount Nebo Baptist Church (F). Display/hide their locations on the map
3,467 married couples with children.
2,495 single-parent households (173 men, 2,322 women).
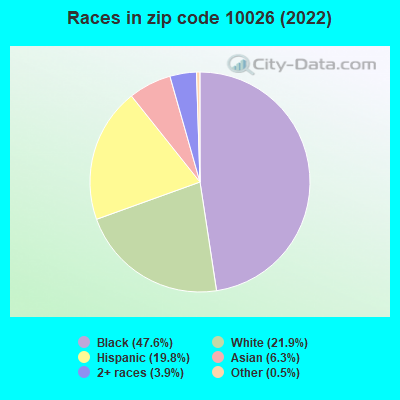
65.5% of residents of 10026 zip code speak English at home.
16.2% of residents speak Spanish at home (71% very well, 15% well, 8% not well, 7% not at all).
11.2% of residents speak other Indo-European language at home (87% very well, 11% well, 1% not well).
2.0% of residents speak Asian or Pacific Island language at home (75% very well, 13% well, 8% not well, 4% not at all).
4.6% of residents speak other language at home (69% very well, 16% well, 15% not well).
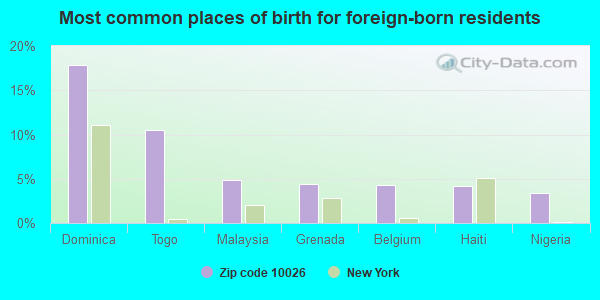
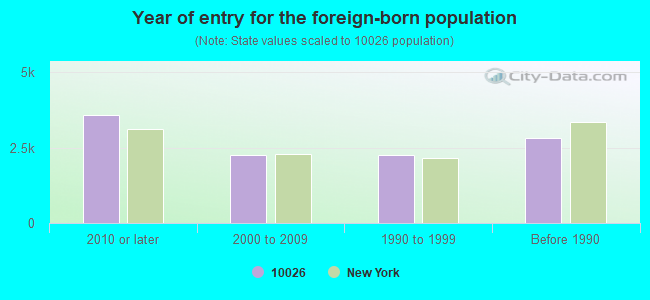
Foreign born population: 10,056 (26.7%) (61.3% of them are naturalized citizens)
Facilities with environmental interests located in this zip code:
110TH ST SVCE STA INC (2040 8TH AVENUE in NEW YORK CITY, NY)
AIR MINOR (AIRS/AFS) STATE MASTER (New York facility tracking) - AIR PROGRAM, (Resource Conservation and Recovery Act (tracking hazardous waste)) Business SIC classification: GASOLINE SERVICE STATIONS Organizations: 110TH STREET SERVICE STATION INC (LEGALLY RESPONSIBLE PARTY)
Alternative names: 110TH STREET SERVICE STATION, AMOCO (13268)
1925 7TH AVE BUILDING (1925 SEVENTH AVENUE in NEW YORK, NY)
STATE MASTER (New York facility tracking) - AIR PROGRAM ENFORCEMENT/COMPLIANCE ACTIVITY (Integrated Compliance Information System) Business SIC classification: OPERATORS OF NONRESIDENTIAL BUILDINGS Organizations: G BAUER INC (AIR PERMITTING FACILITY OWNER CONTACT)
, RESIDENTIAL MANAGEMENT (LEGALLY RESPONSIBLE PARTY)
Alternative names: RESIDENTIAL MANAGEMENT-1925 SEVENTH AVENUE
CON EDISON - SB SB-51265 (411 MANHATTAN AVE. in NEW YORK, NY)
Large Quantity Generators, more that 1000 kg of hazardous waste/month (Resource Conservation and Recovery Act (tracking hazardous waste)) Organizations: CONSOLIDATED EDISON COMPANY OF NY, INC. (CONTACT/OPERATOR)
ALFRED S FRIEDMAN MANAGEMENT (370 MANHATTAN AVENUE APT 3I in NEW YORK, NY)
(Resource Conservation and Recovery Act (tracking hazardous waste))
Housing units lacking complete plumbing facilities: 1.5% Housing units lacking complete kitchen facilities: 1.6%
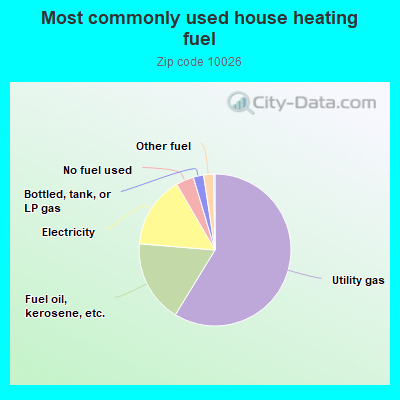
58.8%Utility gas
17.6%Fuel oil, kerosene, etc.
15.3%Electricity
3.8%No fuel used
2.2%Bottled, tank, or LP gas
2.1%Other fuel
Population in 1990: 28,453. Population change in the 1990s: +1,924 (+6.8%).
Place of birth for U.S.-born residents:
This state: 18,824
Northeast: 2,266
Midwest: 1,299
South: 2,927
West: 1,622
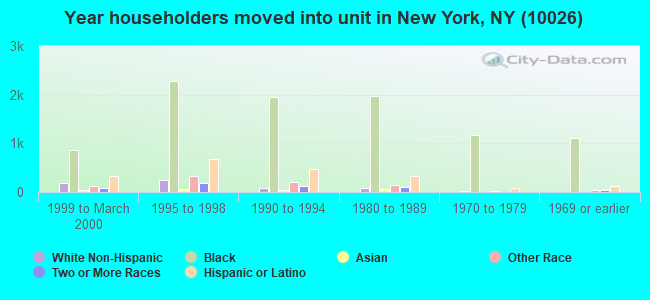
70% of the 10026 zip code residents lived in the same house 5 years ago. Out of people who lived in different houses, 53% lived in this county. Out of people who lived in different counties, 50% lived in New York.
88% of the 10026 zip code residents lived in the same house 1 year ago. Out of people who lived in different houses, 56% moved from this county. Out of people who lived in different houses, 19% moved from different county within same state. Out of people who lived in different houses, 17% moved from different state. Out of people who lived in different houses, 9% moved from abroad.
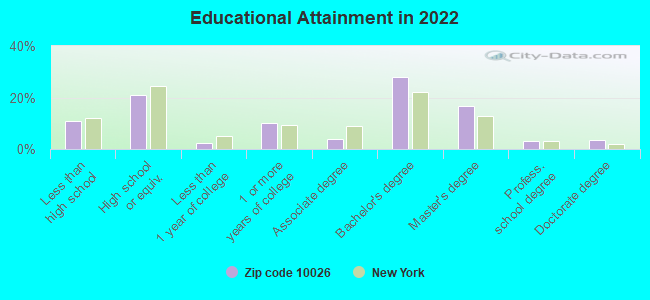
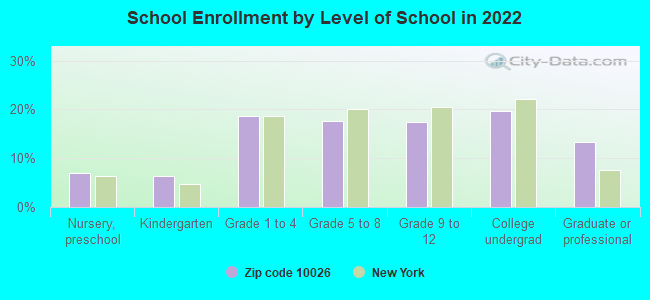
Private vs. public school enrollment:
Students in private schools in grades 1 to 8 (elementary and middle school): 602
Here:
18.3%
New York:
15.6%
Students in private schools in grades 9 to 12 (high school): 148
Here:
9.4%
New York:
15.0%
Students in private undergraduate colleges: 432
Here:
24.6%
New York:
39.2%
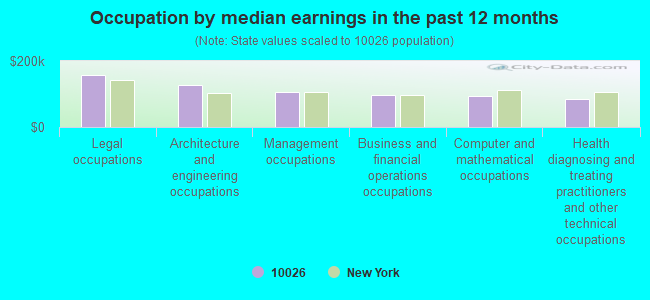
Occupation by median earnings in the past 12 months ($)
157,362Legal occupations
126,594Architecture and engineering occupations
105,034Management occupations
98,115Business and financial operations occupations
95,352Computer and mathematical occupations
84,633Health diagnosing and treating practitioners and other technical occupations
Companies with federal contracts located in this zip code:
HOMME POUR FEMME / FEMME POUR (1925 SEVENTH AVE BLDG 3 in NEW YORK, NY; small business)
$32,533 with Navy for Clothing, Special Purpose. Taking place in VA. Signed on 2004-08-18. Completion date: 2004-10-18.
Top industries in this zip code by the number of employees in 2005:
Health Care and Social Assistance: Child Day Care Services (50-99 employees: 3 establishments, 10-19 employees: 2 establishments, 5-9 employees: 1 establishment, 1-4 employees: 2 establishments)
Real Estate and Rental and Leasing: Lessors of Residential Buildings and Dwellings (20-49: 1, 10-19: 3, 5-9: 7, 1-4: 42)
Health Care and Social Assistance: Child and Youth Services (50-99: 1, 20-49: 1, 5-9: 1)
Other Services (except Public Administration): Religious Organizations (10-19: 3, 5-9: 5, 1-4: 5)
Health Care and Social Assistance: Homes for the Elderly (50-99: 1, 1-4: 1)
Real Estate and Rental and Leasing: Residential Property Managers (10-19: 3, 1-4: 10)
Other Services (except Public Administration): Other Similar Organizations (except Business, Professional, Labor, and Political Organizations) (5-9: 1, 1-4: 25)
Health Care and Social Assistance: Other Individual and Family Services (20-49: 1, 10-19: 1)
People in group quarters in 2010:
527 people in other noninstitutional facilities
470 people in emergency and transitional shelters (with sleeping facilities) for people experiencing homelessness
213 people in state prisons
149 people in group homes intended for adults
44 people in residential treatment centers for adults
30 people in nursing facilities/skilled-nursing facilities
27 people in workers' group living quarters and job corps centers
People in group quarters in 2000:
481 people in other noninstitutional group quarters
355 people in state prisons
63 people in religious group quarters
41 people in homes or halfway houses for drug/alcohol abuse
24 people in other nonhousehold living situations
9 people in homes for the mentally ill
Fatal accident statistics in 2014:
Fatal accident count: 1
Vehicles involved in fatal accidents: 1
Fatal accidents caused by drunken drivers: 0
Fatalities: 1
Persons involved in fatal accidents: 1
Pedestrians involved in fatal accidents: 1
Fatal accident statistics in 2013:
Fatal accident count: 1
Vehicles involved in fatal accidents: 2
Fatal accidents caused by drunken drivers: 0
Fatalities: 1
Persons involved in fatal accidents: 5
Pedestrians involved in fatal accidents: 1
Home Mortgage Disclosure Act Aggregated Statistics For Year 2009 (Based on 8 full and 6 partial tracts)
A) FHA, FSA/RHS & VA Home Purchase Loans
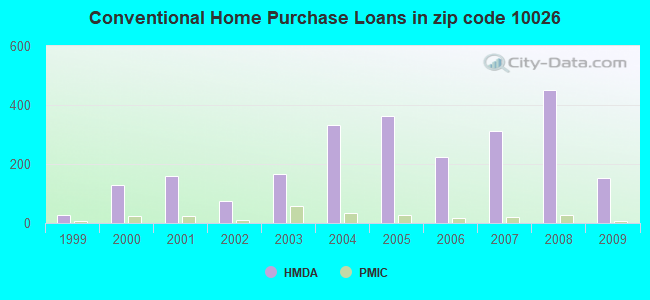
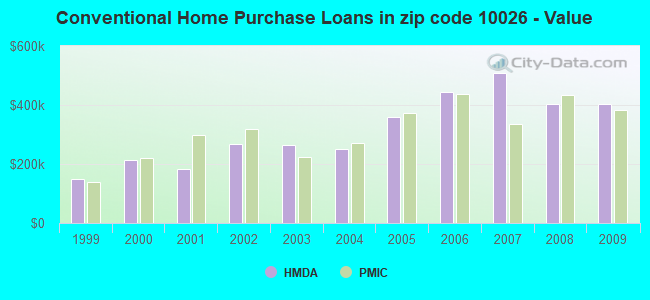
B) Conventional Home Purchase Loans
C) Refinancings
D) Home Improvement Loans
E) Loans on Dwellings For 5+ Families
F) Non-occupant Loans on < 5 Family Dwellings (A B C & D)
G) Loans On Manufactured Home Dwelling (A B C & D)
Number
Average Value
Number
Average Value
Number
Average Value
Number
Average Value
Number
Average Value
Number
Average Value
Number
Average Value
LOANS ORIGINATED
0
$0
154
$402,146
102
$395,953
6
$405,265
6
$4,929,755
11
$443,809
0
$0
APPLICATIONS APPROVED, NOT ACCEPTED
1
$870,000
22
$425,897
47
$470,252
4
$164,222
0
$0
3
$270,333
0
$0
APPLICATIONS DENIED
3
$293,913
60
$350,988
142
$418,947
18
$113,757
1
$3,658,740
23
$452,589
1
$10,000
APPLICATIONS WITHDRAWN
2
$989,350
33
$397,398
49
$440,964
3
$374,963
1
$936,960
9
$362,679
0
$0
FILES CLOSED FOR INCOMPLETENESS
0
$0
14
$383,667
39
$411,407
1
$258,000
0
$0
4
$382,702
0
$0
Aggregated Statistics For Year 2008 (Based on 8 full and 6 partial tracts)
A) FHA, FSA/RHS & VA Home Purchase Loans
B) Conventional Home Purchase Loans
C) Refinancings
D) Home Improvement Loans
E) Loans on Dwellings For 5+ Families
F) Non-occupant Loans on < 5 Family Dwellings (A B C & D)
G) Loans On Manufactured Home Dwelling (A B C & D)
Number
Average Value
Number
Average Value
Number
Average Value
Number
Average Value
Number
Average Value
Number
Average Value
Number
Average Value
LOANS ORIGINATED
4
$594,035
452
$403,230
48
$395,355
11
$184,990
10
$1,251,771
18
$401,429
1
$25,370
APPLICATIONS APPROVED, NOT ACCEPTED
0
$0
132
$485,851
19
$422,550
5
$269,332
1
$1,996,800
7
$504,686
0
$0
APPLICATIONS DENIED
8
$233,664
257
$419,980
81
$600,429
38
$137,795
8
$2,912,482
29
$410,624
3
$31,137
APPLICATIONS WITHDRAWN
2
$496,500
85
$487,220
20
$655,311
2
$349,700
2
$1,489,650
9
$480,176
1
$358,400
FILES CLOSED FOR INCOMPLETENESS
0
$0
56
$456,722
3
$801,000
3
$538,430
0
$0
7
$570,939
0
$0
Aggregated Statistics For Year 2007 (Based on 8 full and 6 partial tracts)
A) FHA, FSA/RHS & VA Home Purchase Loans
B) Conventional Home Purchase Loans
C) Refinancings
D) Home Improvement Loans
E) Loans on Dwellings For 5+ Families
F) Non-occupant Loans on < 5 Family Dwellings (A B C & D)
G) Loans On Manufactured Home Dwelling (A B C & D)
Number
Average Value
Number
Average Value
Number
Average Value
Number
Average Value
Number
Average Value
Number
Average Value
Number
Average Value
LOANS ORIGINATED
0
$0
313
$507,493
109
$434,832
36
$286,660
25
$3,455,870
43
$468,354
1
$38,000
APPLICATIONS APPROVED, NOT ACCEPTED
1
$311,000
87
$490,995
29
$477,860
7
$226,960
1
$5,200,000
4
$250,625
0
$0
APPLICATIONS DENIED
0
$0
104
$499,935
119
$532,854
38
$93,634
3
$5,481,667
26
$324,126
1
$42,000
APPLICATIONS WITHDRAWN
0
$0
68
$512,227
54
$470,216
6
$333,625
3
$2,830,333
13
$565,075
0
$0
FILES CLOSED FOR INCOMPLETENESS
0
$0
10
$547,650
30
$362,217
1
$304,980
0
$0
2
$307,860
0
$0
Aggregated Statistics For Year 2006 (Based on 8 full and 6 partial tracts)
B) Conventional Home Purchase Loans
C) Refinancings
D) Home Improvement Loans
E) Loans on Dwellings For 5+ Families
F) Non-occupant Loans on < 5 Family Dwellings (A B C & D)
G) Loans On Manufactured Home Dwelling (A B C & D)
Number
Average Value
Number
Average Value
Number
Average Value
Number
Average Value
Number
Average Value
Number
Average Value
LOANS ORIGINATED
224
$443,408
133
$385,030
28
$148,856
19
$2,679,819
23
$531,433
0
$0
APPLICATIONS APPROVED, NOT ACCEPTED
77
$383,935
54
$460,922
11
$341,114
4
$1,696,150
2
$395,500
0
$0
APPLICATIONS DENIED
100
$425,068
114
$381,198
58
$140,893
6
$1,945,180
33
$203,660
2
$8,985
APPLICATIONS WITHDRAWN
49
$508,816
54
$340,574
1
$20,000
0
$0
5
$566,520
0
$0
FILES CLOSED FOR INCOMPLETENESS
26
$307,800
26
$248,616
4
$232,745
1
$25,370
3
$232,837
0
$0
Aggregated Statistics For Year 2005 (Based on 8 full and 6 partial tracts)
B) Conventional Home Purchase Loans
C) Refinancings
D) Home Improvement Loans
E) Loans on Dwellings For 5+ Families
F) Non-occupant Loans on < 5 Family Dwellings (A B C & D)
G) Loans On Manufactured Home Dwelling (A B C & D)
Number
Average Value
Number
Average Value
Number
Average Value
Number
Average Value
Number
Average Value
Number
Average Value
LOANS ORIGINATED
364
$359,533
109
$399,426
18
$182,145
17
$3,042,226
39
$433,461
0
$0
APPLICATIONS APPROVED, NOT ACCEPTED
75
$490,781
43
$351,953
8
$284,076
0
$0
17
$546,539
0
$0
APPLICATIONS DENIED
96
$426,766
98
$387,864
32
$102,845
4
$4,168,095
19
$372,212
0
$0
APPLICATIONS WITHDRAWN
63
$396,823
60
$392,034
12
$222,327
4
$4,711,480
18
$444,753
0
$0
FILES CLOSED FOR INCOMPLETENESS
29
$409,111
33
$388,913
4
$57,370
2
$598,920
5
$170,140
2
$39,930
Aggregated Statistics For Year 2004 (Based on 8 full and 6 partial tracts)
B) Conventional Home Purchase Loans
C) Refinancings
D) Home Improvement Loans
E) Loans on Dwellings For 5+ Families
F) Non-occupant Loans on < 5 Family Dwellings (A B C & D)
Number
Average Value
Number
Average Value
Number
Average Value
Number
Average Value
Number
Average Value
LOANS ORIGINATED
331
$251,718
141
$257,056
17
$69,955
30
$1,848,636
32
$280,264
APPLICATIONS APPROVED, NOT ACCEPTED
92
$305,372
52
$235,241
6
$94,122
4
$284,852
4
$235,905
APPLICATIONS DENIED
117
$371,364
113
$331,872
35
$108,517
4
$2,482,792
14
$274,097
APPLICATIONS WITHDRAWN
66
$295,683
62
$265,957
6
$166,563
2
$72,500
7
$325,154
FILES CLOSED FOR INCOMPLETENESS
30
$311,527
16
$349,748
3
$52,187
0
$0
1
$545,910
Aggregated Statistics For Year 2003 (Based on 8 full and 6 partial tracts)
A) FHA, FSA/RHS & VA Home Purchase Loans
B) Conventional Home Purchase Loans
C) Refinancings
D) Home Improvement Loans
E) Loans on Dwellings For 5+ Families
F) Non-occupant Loans on < 5 Family Dwellings (A B C & D)
Number
Average Value
Number
Average Value
Number
Average Value
Number
Average Value
Number
Average Value
Number
Average Value
LOANS ORIGINATED
0
$0
166
$266,026
192
$227,801
11
$60,914
15
$1,189,021
17
$306,783
APPLICATIONS APPROVED, NOT ACCEPTED
0
$0
52
$324,943
37
$238,665
6
$86,783
2
$719,995
5
$359,530
APPLICATIONS DENIED
0
$0
67
$334,631
115
$256,608
14
$38,192
0
$0
12
$317,656
APPLICATIONS WITHDRAWN
0
$0
29
$359,552
55
$259,892
9
$27,358
2
$782,335
4
$634,822
FILES CLOSED FOR INCOMPLETENESS
1
$436,220
17
$213,766
15
$187,883
0
$0
2
$266,240
3
$219,747
Aggregated Statistics For Year 2002 (Based on 8 full and 6 partial tracts)
A) FHA, FSA/RHS & VA Home Purchase Loans
B) Conventional Home Purchase Loans
C) Refinancings
D) Home Improvement Loans
E) Loans on Dwellings For 5+ Families
F) Non-occupant Loans on < 5 Family Dwellings (A B C & D)
Number
Average Value
Number
Average Value
Number
Average Value
Number
Average Value
Number
Average Value
Number
Average Value
LOANS ORIGINATED
1
$373,760
73
$268,412
116
$226,437
3
$23,253
17
$870,284
12
$226,369
APPLICATIONS APPROVED, NOT ACCEPTED
3
$302,067
32
$254,194
66
$218,991
5
$65,206
1
$102,400
8
$196,930
APPLICATIONS DENIED
1
$458,000
39
$276,178
76
$255,004
33
$73,828
1
$460,800
6
$201,407
APPLICATIONS WITHDRAWN
2
$159,890
16
$350,606
71
$176,488
14
$82,946
3
$1,245,413
8
$285,835
FILES CLOSED FOR INCOMPLETENESS
0
$0
4
$461,875
26
$151,525
1
$153,600
0
$0
4
$302,188
Aggregated Statistics For Year 2001 (Based on 8 full and 6 partial tracts)
A) FHA, FSA/RHS & VA Home Purchase Loans
B) Conventional Home Purchase Loans
C) Refinancings
D) Home Improvement Loans
E) Loans on Dwellings For 5+ Families
F) Non-occupant Loans on < 5 Family Dwellings (A B C & D)
Number
Average Value
Number
Average Value
Number
Average Value
Number
Average Value
Number
Average Value
Number
Average Value
LOANS ORIGINATED
3
$401,297
158
$184,631
86
$219,526
18
$43,187
18
$853,939
9
$253,104
APPLICATIONS APPROVED, NOT ACCEPTED
1
$433,150
23
$285,024
39
$141,943
7
$30,971
2
$225,280
9
$140,428
APPLICATIONS DENIED
2
$406,995
50
$176,916
77
$234,594
24
$36,420
0
$0
9
$206,913
APPLICATIONS WITHDRAWN
1
$307,200
13
$282,942
25
$178,173
7
$36,286
4
$689,345
1
$337,920
FILES CLOSED FOR INCOMPLETENESS
1
$100,350
3
$177,817
7
$200,969
0
$0
0
$0
1
$260,000
Aggregated Statistics For Year 2000 (Based on 8 full and 6 partial tracts)
A) FHA, FSA/RHS & VA Home Purchase Loans
B) Conventional Home Purchase Loans
C) Refinancings
D) Home Improvement Loans
E) Loans on Dwellings For 5+ Families
F) Non-occupant Loans on < 5 Family Dwellings (A B C & D)
Number
Average Value
Number
Average Value
Number
Average Value
Number
Average Value
Number
Average Value
Number
Average Value
LOANS ORIGINATED
3
$379,253
129
$213,632
32
$156,952
48
$10,130
8
$692,745
5
$167,504
APPLICATIONS APPROVED, NOT ACCEPTED
0
$0
32
$236,778
10
$113,097
0
$0
0
$0
1
$227,720
APPLICATIONS DENIED
1
$304,000
58
$219,001
75
$125,919
36
$27,893
2
$236,085
18
$267,698
APPLICATIONS WITHDRAWN
2
$61,445
24
$213,665
37
$105,543
1
$61,440
0
$0
5
$239,718
FILES CLOSED FOR INCOMPLETENESS
0
$0
23
$281,708
11
$164,881
0
$0
0
$0
3
$481,700
Aggregated Statistics For Year 1999 (Based on 3 full and 6 partial tracts)
A) FHA, FSA/RHS & VA Home Purchase Loans
B) Conventional Home Purchase Loans
C) Refinancings
D) Home Improvement Loans
E) Loans on Dwellings For 5+ Families
F) Non-occupant Loans on < 5 Family Dwellings (A B C & D)
2007 - 2018 National Fire Incident Reporting System (NFIRS) incidents
Based on the data from the years 2007 - 2018 the average number of fires per year is 242. The highest number of reported fire incidents - 298 took place in 2017, and the least - 161 in 2007. The data has a rising trend.
When looking into fire subcategories, the most reports belonged to: Structure Fires (78.3%), and Outside Fires (16.0%).
Fire incident types reported to NFIRS in Zip Code 10026


 Nearest zip codes: 10027, 10029, 10115, 10025, 10030, 10037.


 Based on the data from the years 2007 - 2018 the average number of fires per year is 242. The highest number of reported fire incidents - 298 took place in 2017, and the least - 161 in 2007. The data has a rising trend.
 When looking into fire subcategories, the most reports belonged to: Structure Fires (78.3%), and Outside Fires (16.0%).