Estimated zip code population in 2022: 95,449 Zip code population in 2010: 94,600 Zip code population in 2000: 97,086
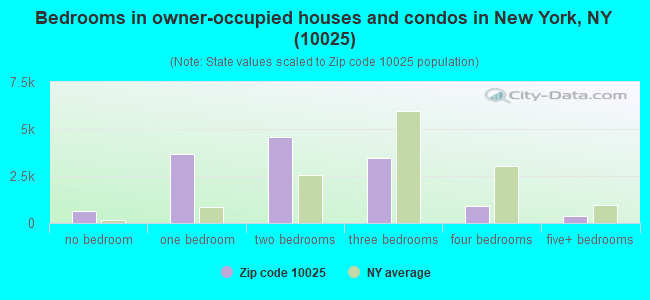
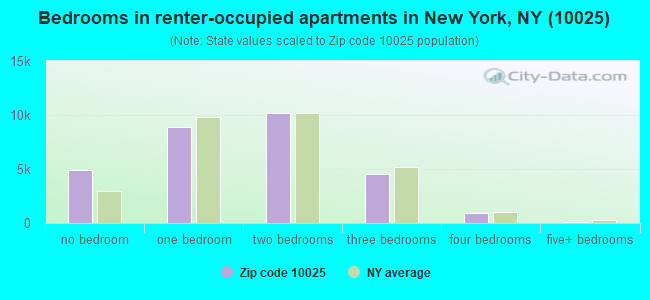
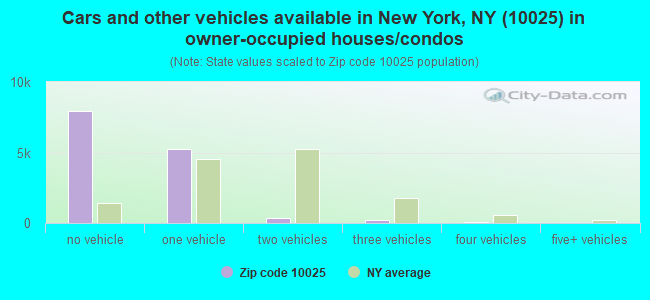
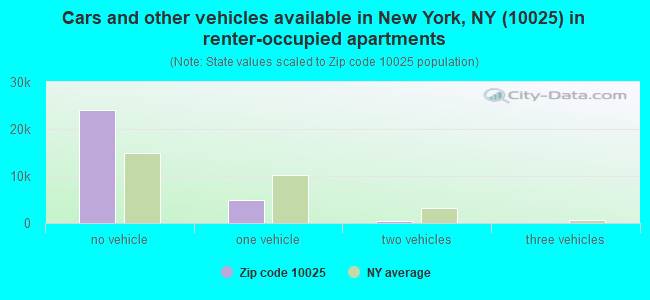
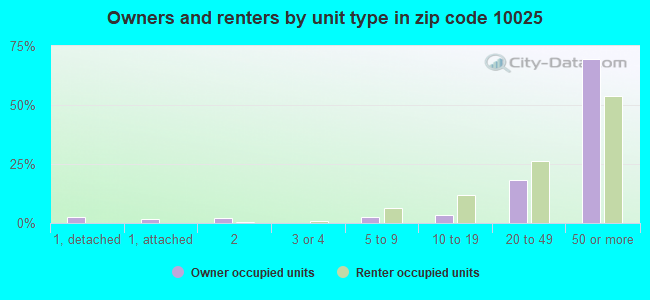
Houses and condos: 48,228 Renter-occupied apartments: 29,306
% of renters here:
69%
State:
46%
March 2022 cost of living index in zip code 10025: 154.5 (very high, U.S. average is 100)
Land area: 0.8 sq. mi. Water area: 0.0 sq. mi.
Population density: 126,989 people per square mile
(very high).
OSM Map
General Map
Google Map
MSN Map
OSM Map
General Map
Google Map
MSN Map
OSM Map
General Map
Google Map
MSN Map
OSM Map
General Map
Google Map
MSN Map
Please wait while loading the map...
Real estate property taxes paid for housing units in 2022:
This zip code:
0.8% ($9,115)
New York:
1.5% ($6,180)
Median real estate property taxes paid for housing units with mortgages in 2022: $9,763 (0.8%) Median real estate property taxes paid for housing units with no mortgage in 2022: $8,023 (0.7%)
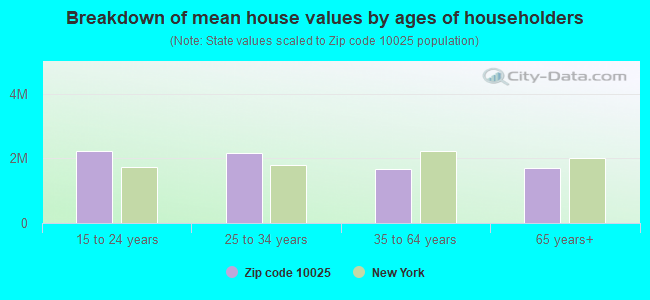
Estimated median house/condo value in 2022: $1,151,997
10025:
$1,151,997
New York:
$400,400
According to our research of New York and other state lists, there were 32 registered sex offenders living in 10025 zip code as of April 27, 2024. The ratio of all residents to sex offenders in zip code 10025 is 3,002 to 1. The ratio of registered sex offenders to all residents in this zip code is much lower than the state average.
Median resident age:
This zip code:
40.5 years
New York median age:
40.0 years
Average household size:
This zip code:
2.1 people
New York:
2.5 people
Averages for the 2020 tax year for zip code 10025, filed in 2021:
Average Adjusted Gross Income (AGI) in 2020: $170,915 (Individual Income Tax Returns)
Here:
$170,915
State:
$90,930
Salary/wage: $133,318 (reported on 76.0% of returns)
Here:
$133,318
State:
$72,104
(% of AGI for various income ranges: 927.7% for AGIs below $25k, 3456.2% for AGIs $25k-50k, 6781.7% for AGIs $50k-75k, 10354.3% for AGIs $75k-100k, 19919.2% for AGIs $100k-200k, 166035.5% for AGIs over 200k)
Taxable interest for individuals: $4,563 (reported on 44.6% of returns)
This zip code:
$4,563
New York:
$3,075
(% of AGI for various income ranges: 27.4% for AGIs below $25k, 40.6% for AGIs $25k-50k, 69.5% for AGIs $50k-75k, 128.9% for AGIs $75k-100k, 274.5% for AGIs $100k-200k, 3878.1% for AGIs over 200k)
Ordinary dividends: $15,065 (reported on 40.7% of returns)
Here:
$15,065
State:
$11,095
(% of AGI for various income ranges: 93.8% for AGIs below $25k, 144.5% for AGIs $25k-50k, 253.2% for AGIs $50k-75k, 514.2% for AGIs $75k-100k, 1184.7% for AGIs $100k-200k, 10639.0% for AGIs over 200k)
Net capital gain/loss in AGI: +$56,462 (reported on 38.1% of returns)
Here:
+$56,462
State:
+$44,925
(% of AGI for various income ranges: 53.9% for AGIs below $25k, 113.5% for AGIs $25k-50k, 339.1% for AGIs $50k-75k, 450.7% for AGIs $75k-100k, 1236.4% for AGIs $100k-200k, 48031.8% for AGIs over 200k)
Profit/loss from business: +$26,908 (reported on 22.9% of returns)
Here:
+$26,908
State:
+$14,940
(% of AGI for various income ranges: 183.5% for AGIs below $25k, 239.2% for AGIs $25k-50k, 406.3% for AGIs $50k-75k, 565.9% for AGIs $75k-100k, 1377.9% for AGIs $100k-200k, 9328.8% for AGIs over 200k)
Taxable individual retirement arrangement distribution: $27,805 (reported on 9.6% of returns)
10025:
$27,805
New York:
$19,609
(% of AGI for various income ranges: 50.8% for AGIs below $25k, 101.1% for AGIs $25k-50k, 218.2% for AGIs $50k-75k, 424.4% for AGIs $75k-100k, 895.2% for AGIs $100k-200k, 3261.4% for AGIs over 200k)
Self-employed (Keogh) retirement plans: $35,336 (reported on 3.7% of returns)
10025:
$35,336
New York:
$32,497
(% of AGI for various income ranges: 2.2% for AGIs below $25k, 12.0% for AGIs $25k-50k, 30.5% for AGIs $50k-75k, 59.6% for AGIs $75k-100k, 190.2% for AGIs $100k-200k, 2622.5% for AGIs over 200k)
Total itemized deductions: $47,048 (reported on 18.1% of returns)
Here:
$47,048
State:
$39,326
(% of AGI for various income ranges: 114.3% for AGIs below $25k, 196.6% for AGIs $25k-50k, 404.7% for AGIs $50k-75k, 834.6% for AGIs $75k-100k, 1739.8% for AGIs $100k-200k, 14406.2% for AGIs over 200k)
Charity contributions: $20,095 (reported on 16.2% of returns)
Here:
$20,095
State:
$15,420
(% of AGI for various income ranges: 6.5% for AGIs below $25k, 23.8% for AGIs $25k-50k, 64.0% for AGIs $50k-75k, 140.7% for AGIs $75k-100k, 359.5% for AGIs $100k-200k, 6820.2% for AGIs over 200k)
Taxes paid: $9,462 (reported on 18.1% of returns)
10025:
$9,462
State:
$9,183
(% of AGI for various income ranges: 28.8% for AGIs below $25k, 52.2% for AGIs $25k-50k, 106.2% for AGIs $50k-75k, 256.4% for AGIs $75k-100k, 542.2% for AGIs $100k-200k, 2284.7% for AGIs over 200k)
Earned income credit: $1,579 (reported on 9.3% of returns)
Here:
$1,579
State:
$2,138
(% of AGI for various income ranges: 64.4% for AGIs below $25k, 38.9% for AGIs $25k-50k)
Percentage of individuals using paid preparers for their 2020 taxes: 93.9%
Here:
94%
State:
95%
(% for various income ranges: 91.8% for AGIs below $25k, 94.3% for AGIs $25k-50k, 94.2% for AGIs $50k-75k, 93.5% for AGIs $75k-100k, 94.2% for AGIs $100k-200k, 96.1% for AGIs over 200k)
Averages for the 2012 tax year for zip code 10025, filed in 2013:
Average Adjusted Gross Income (AGI) in 2012: $131,910 (Individual Income Tax Returns)
Here:
$131,910
State:
$77,088
Salary/wage: $105,222 (reported on 79.8% of returns)
Here:
$105,222
State:
$60,593
(% of AGI for various income ranges: 64.4% for AGIs below $25k, 79.4% for AGIs $25k-50k, 76.6% for AGIs $50k-75k, 73.8% for AGIs $75k-100k, 72.8% for AGIs $100k-200k, 57.9% for AGIs over 200k)
Taxable interest for individuals: $3,735 (reported on 48.0% of returns)
This zip code:
$3,735
New York:
$3,125
(% of AGI for various income ranges: 1.6% for AGIs below $25k, 0.9% for AGIs $25k-50k, 0.9% for AGIs $50k-75k, 1.0% for AGIs $75k-100k, 0.9% for AGIs $100k-200k, 1.6% for AGIs over 200k)
Ordinary dividends: $13,603 (reported on 36.8% of returns)
Here:
$13,603
State:
$10,299
(% of AGI for various income ranges: 4.3% for AGIs below $25k, 2.3% for AGIs $25k-50k, 2.5% for AGIs $50k-75k, 2.7% for AGIs $75k-100k, 3.4% for AGIs $100k-200k, 4.2% for AGIs over 200k)
Net capital gain/loss in AGI: +$37,170 (reported on 32.6% of returns)
Here:
+$37,170
State:
+$42,474
(% of AGI for various income ranges: 0.6% for AGIs below $25k, 0.5% for AGIs $25k-50k, 0.9% for AGIs $50k-75k, 1.2% for AGIs $75k-100k, 1.9% for AGIs $100k-200k, 13.6% for AGIs over 200k)
Profit/loss from business: +$25,419 (reported on 24.6% of returns)
Here:
+$25,419
State:
+$16,168
(% of AGI for various income ranges: 15.6% for AGIs below $25k, 5.7% for AGIs $25k-50k, 5.0% for AGIs $50k-75k, 5.4% for AGIs $75k-100k, 5.5% for AGIs $100k-200k, 3.9% for AGIs over 200k)
Taxable individual retirement arrangement distribution: $22,942 (reported on 10.1% of returns)
10025:
$22,942
New York:
$17,621
(% of AGI for various income ranges: 2.7% for AGIs below $25k, 1.9% for AGIs $25k-50k, 2.1% for AGIs $50k-75k, 2.8% for AGIs $75k-100k, 2.8% for AGIs $100k-200k, 1.3% for AGIs over 200k)
Self-employment retirement plans: $28,768 (reported on 3.9% of returns)
10025:
$28,768
New York:
$27,330
(% of AGI for various income ranges: 0.2% for AGIs below $25k, 0.3% for AGIs $25k-50k, 0.4% for AGIs $50k-75k, 0.5% for AGIs $75k-100k, 0.8% for AGIs $100k-200k, 1.0% for AGIs over 200k)
Total itemized deductions: $46,833 (19% of AGI, reported on 47.0% of returns)
Here:
$46,833
State:
$34,985
Here:
19.2% of AGI
State:
21.3% of AGI
(% of AGI for various income ranges: 12.0% for AGIs below $25k, 10.6% for AGIs $25k-50k, 13.1% for AGIs $50k-75k, 16.7% for AGIs $75k-100k, 18.2% for AGIs $100k-200k, 17.3% for AGIs over 200k)
Charity contributions: $6,759 (reported on 40.4% of returns)
Here:
$6,759
State:
$5,572
(% of AGI for various income ranges: 0.7% for AGIs below $25k, 1.2% for AGIs $25k-50k, 1.6% for AGIs $50k-75k, 1.9% for AGIs $75k-100k, 1.9% for AGIs $100k-200k, 2.3% for AGIs over 200k)
Taxes paid: $28,842 (reported on 46.7% of returns)
10025:
$28,842
State:
$18,656
(% of AGI for various income ranges: 3.2% for AGIs below $25k, 2.8% for AGIs $25k-50k, 5.3% for AGIs $50k-75k, 8.1% for AGIs $75k-100k, 10.0% for AGIs $100k-200k, 11.8% for AGIs over 200k)
Earned income credit: $1,749 (reported on 11.7% of returns)
Here:
$1,749
State:
$2,230
(% of AGI for various income ranges: 5.0% for AGIs below $25k, 0.4% for AGIs $25k-50k)
Percentage of individuals using paid preparers for their 2012 taxes: 65.6%
Here:
66%
State:
66%
(% for various income ranges: 62.0% for AGIs below $25k, 60.1% for AGIs $25k-50k, 61.6% for AGIs $50k-75k, 65.5% for AGIs $75k-100k, 70.6% for AGIs $100k-200k, 80.3% for AGIs over 200k)
Averages for the 2004 tax year for zip code 10025, filed in 2005:
Average Adjusted Gross Income (AGI) in 2004: $87,004 (Individual Income Tax Returns)
Here:
$87,004
State:
$59,519
Salary/wage: $73,448 (reported on 80.6% of returns)
Here:
$73,448
State:
$50,673
(% of AGI for various income ranges: 112.1% for AGIs below $10k, 72.3% for AGIs $10k-25k, 84.0% for AGIs $25k-50k, 79.8% for AGIs $50k-75k, 77.8% for AGIs $75k-100k, 62.6% for AGIs over 100k)
Taxable interest for individuals: $2,372 (reported on 56.0% of returns)
This zip code:
$2,372
New York:
$2,377
(% of AGI for various income ranges: 9.6% for AGIs below $10k, 2.5% for AGIs $10k-25k, 1.4% for AGIs $25k-50k, 1.4% for AGIs $50k-75k, 1.5% for AGIs $75k-100k, 1.4% for AGIs over 100k)
Taxable dividends: $5,802 (reported on 37.7% of returns)
Here:
$5,802
State:
$5,394
(% of AGI for various income ranges: 13.4% for AGIs below $10k, 2.9% for AGIs $10k-25k, 1.6% for AGIs $25k-50k, 2.1% for AGIs $50k-75k, 2.4% for AGIs $75k-100k, 2.6% for AGIs over 100k)
Net capital gain/loss: +$28,928 (reported on 32.2% of returns)
Here:
+$28,928
State:
+$23,581
(% of AGI for various income ranges: 8.1% for AGIs below $10k, 0.6% for AGIs $10k-25k, 0.8% for AGIs $25k-50k, 0.9% for AGIs $50k-75k, 1.4% for AGIs $75k-100k, 15.0% for AGIs over 100k)
Profit/loss from business: +$16,895 (reported on 25.4% of returns)
Here:
+$16,895
State:
+$13,809
(% of AGI for various income ranges: 29.2% for AGIs below $10k, 11.3% for AGIs $10k-25k, 4.9% for AGIs $25k-50k, 4.7% for AGIs $50k-75k, 5.6% for AGIs $75k-100k, 4.3% for AGIs over 100k)
IRA payment deduction: $2,904 (reported on 3.6% of returns)
10025:
$2,904
New York:
$3,115
(% of AGI for various income ranges: 0.9% for AGIs below $10k, 0.5% for AGIs $10k-25k, 0.4% for AGIs $25k-50k, 0.2% for AGIs $50k-75k, 0.2% for AGIs $75k-100k, 0.0% for AGIs over 100k)
Self-employed pension: $18,985 (reported on 4.0% of returns)
Here:
$18,985
New York:
$19,016
(% of AGI for various income ranges: 0.4% for AGIs below $10k, 0.4% for AGIs $10k-25k, 0.4% for AGIs $25k-50k, 0.5% for AGIs $50k-75k, 0.6% for AGIs $75k-100k, 1.1% for AGIs over 100k)
Total itemized deductions: $31,103 (20% of AGI, reported on 46.2% of returns)
Here:
$31,103
State:
$25,864
Here:
19.5% of AGI
State:
21.9% of AGI
(% of AGI for various income ranges: 20.0% for AGIs below $10k, 11.6% for AGIs $10k-25k, 12.6% for AGIs $25k-50k, 17.0% for AGIs $50k-75k, 18.0% for AGIs $75k-100k, 17.1% for AGIs over 100k)
Charity contributions deductions: $5,461 (3% of AGI, reported on 41.8% of returns)
Here:
$5,461
State:
$4,439
Here:
3.2% of AGI
State:
3.6% of AGI
(% of AGI for various income ranges: 1.0% for AGIs below $10k, 1.3% for AGIs $10k-25k, 1.9% for AGIs $25k-50k, 2.5% for AGIs $50k-75k, 2.4% for AGIs $75k-100k, 2.9% for AGIs over 100k)
Total tax: $19,488 (reported on 82.0% of returns)
10025:
$19,488
State:
$11,730
(% of AGI for various income ranges: 8.3% for AGIs below $10k, 5.3% for AGIs $10k-25k, 8.7% for AGIs $25k-50k, 12.6% for AGIs $50k-75k, 14.1% for AGIs $75k-100k, 21.7% for AGIs over 100k)
Earned income credit: $1,448 (reported on 12.2% of returns)
Here:
$1,448
State:
$1,757
Percentage of individuals using paid preparers for their 2004 taxes: 66.8%
Here:
67%
State:
67%
(% for various income ranges: 61.9% for AGIs below $10k, 65.8% for AGIs $10k-25k, 62.1% for AGIs $25k-50k, 65.3% for AGIs $50k-75k, 69.6% for AGIs $75k-100k, 78.0% for AGIs over 100k)
Likely homosexual households (counted as self-reported same-sex unmarried-partner households)
Lesbian couples: 0.2% of all households
Gay men: 0.7% of all households
Household received Food Stamps/SNAP in the past 12 months: 4,820 Household did not receive Food Stamps/SNAP in the past 12 months: 37,516
Women who had a birth in the past 12 months: 1,236 (929 now married, 303 unmarried) Women who did not have a birth in the past 12 months: 23,927 (5,773 now married, 18,296 unmarried)
Housing units in zip code 10025 with a mortgage: 6,364 (803 second mortgage, 726 both second mortgage and home equity loan) Houses without a mortgage: 23
Median monthly owner costs for units with a mortgage: $3,710 Median monthly owner costs for units without a mortgage: $1,087
Residents with income below the poverty level in 2022:
This zip code:
15.6%
Whole state:
14.3%
Residents with income below 50% of the poverty level in 2022:
This zip code:
5.3%
Whole state:
6.8%
Median number of rooms in houses and condos:
Here:
4.4
State:
6.3
Median number of rooms in apartments:
Here:
3.6
State:
3.8
Notable locations in this zip code not listed on our city pages
Notable locations in zip code 10025: Consolidated Edison West 110th Street Substation (A), Armstrong Hall (B), Carman Hall (C), Casa Hispanica (D), John Jay Hall (E), McBain Hall (F), Ruggles Hall (G), Eli White Hall (H), Hogan Hall (I), McVickar Hall (J), River Hall (K), Watt Hall (L), William And June Warren Hall (M), Woodbridge Hall (N), Metro Theater (O), Jefferson Towers (P), Ukrainian Academy of Arts and Sciences (Q), Ivy Court (R), Symphony Space (S), The Columbia (T). Display/hide their locations on the map
Churches in zip code 10025 include: Cathedral of Saint John the Divine (A), Broadway Presbyterian Church (B), Eglise De Notre Dame (C), Saint Gerasimos Greek Orthodox Church (D), Templo Adventista Del Septimo Dia (E), Congregation Ohab Zedek (F), Crenshaw Christian Center East (G), Church of the Ascension (H), Saint Michael's Episcopal Church (I). Display/hide their locations on the map
Parks in zip code 10025 include: Joan of Arc Park (1), Carrere Memorial (2), Firemen's Memorial (3), Straus Park (4), Morningside Park (5), Joan of Arc Statue (6), Riverside-West 105th Street Historic District (7), West 111th Street People's Garden (8), Anibal Aviles Playground (9). Display/hide their locations on the map
Tourist attractions (not listed on the city page) : AGNI Yoga Society Inc (Museums; 319 West 107th Street), Columbia University - Libraries- Hours (Cultural Attractions- Events- & Facilities; 622 West 113th Street), American International Lyric Theatre- Inc. (Arcades & Amusements; 322 Duke Ellington Boulevard).
9,300 married couples with children.
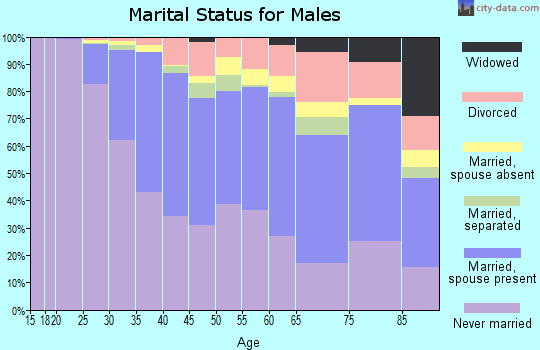
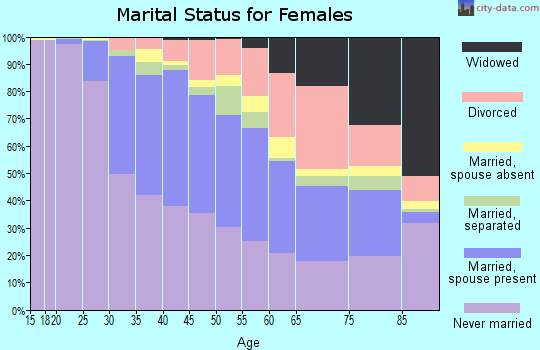
3,445 single-parent households (831 men, 2,614 women).
62.8% of residents of 10025 zip code speak English at home.
19.0% of residents speak Spanish at home (64% very well, 12% well, 18% not well, 6% not at all).
9.0% of residents speak other Indo-European language at home (83% very well, 13% well, 4% not well).
6.9% of residents speak Asian or Pacific Island language at home (71% very well, 21% well, 5% not well, 3% not at all).
2.6% of residents speak other language at home (75% very well, 19% well, 5% not well).
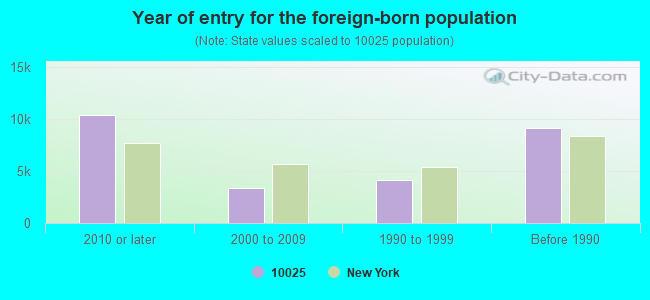
Foreign born population: 23,131 (24.2%) (50.4% of them are naturalized citizens)
Major facilities with environmental interests located in this zip code:
HUDSON B Y DRY CLEANERS (2655 BROADWAY in NEW YORK, NY)
AIR MINOR (AIRS/AFS) STATE MASTER (New York facility tracking) - AIR PROGRAM, HAZARDOUS WASTE PROGRAM (Resource Conservation and Recovery Act (tracking hazardous waste)) Business SIC classification: DRYCLEANING PLANTS, EXCEPT RUG CLEANING Business NAICS classification: DRYCLEANING AND LAUNDRY SERVICES (EXCEPT COIN-OPERATED). Organizations: HUDSON DRY CLEANERS INC (LEGALLY RESPONSIBLE PARTY)
Alternative names: HUDSON DRY CLEANERS
HAN MI DRY CLEANERS (405 CENTRAL PARK WEST in NEW YORK CITY, NY)
AIR MINOR (AIRS/AFS) STATE MASTER (New York facility tracking) - AIR PROGRAM Conditionally Exempt Small Quantity Generators, less than 100 kg/month of hazardous waste (Resource Conservation and Recovery Act (tracking hazardous waste)) Business SIC classification: DRYCLEANING PLANTS, EXCEPT RUG CLEANING Business NAICS classification: DRYCLEANING AND LAUNDRY SERVICES (EXCEPT COIN-OPERATED). Organizations: DO KYUN KIM (CONTACT/OPERATOR)
, HAN MI DRY CLEANERS CORP (LEGALLY RESPONSIBLE PARTY)
Alternative names: C P W CLEANERS, CANOPY CLEANERS, HANMI CLEANERS CORP
BIBA FRENCH CLEANERS (102 W 96TH ST in NEW YORK, NY)
AIR MINOR (AIRS/AFS) STATE MASTER (New York facility tracking) - AIR PROGRAM Small Quantity Generators, between 100 kg and 1000 kg of hazardous waste/month (Resource Conservation and Recovery Act (tracking hazardous waste)) Business SIC classification: DRYCLEANING PLANTS, EXCEPT RUG CLEANING Business NAICS classification: DRYCLEANING AND LAUNDRY SERVICES (EXCEPT COIN-OPERATED). Organizations: JAY LEE (CONTACT/OPERATOR)
, DAE YOUNG NEW YORK CORP (LEGALLY RESPONSIBLE PARTY)
600 W 113TH ST BUILDING (600 W 113TH ST in NEW YORK, NY)
AIR MINOR (AIRS/AFS) STATE MASTER (New York facility tracking) - AIR FACILITY REGISTRATION, AIR PROGRAM Business SIC classification: OPERATORS OF APARTMENT BUILDINGS; COLLEGES, UNIVERSITIES, AND PROFESSIONAL SCHOOLS Organizations: COLUMBIA UNIVERSITY
97 STREET CLEANERS (241 WEST 97TH ST in NEW YORK, NY)
AIR MINOR (AIRS/AFS) STATE MASTER (New York facility tracking) - AIR PROGRAM Business SIC classification: DRYCLEANING PLANTS, EXCEPT RUG CLEANING Business NAICS classification: DRYCLEANING AND LAUNDRY SERVICES (EXCEPT COIN-OPERATED). Organizations: AMERY S DRY CLEANING CORP (LEGALLY RESPONSIBLE PARTY)
COMMUNITY CENTER DRYCLEANERS (83 W 104TH STREET in NEW YORK, NY)
AIR MINOR (AIRS/AFS) STATE MASTER (New York facility tracking) - AIR PROGRAM Business SIC classification: DRYCLEANING PLANTS, EXCEPT RUG CLEANING Business NAICS classification: DRYCLEANING AND LAUNDRY SERVICES (EXCEPT COIN-OPERATED). Organizations: COMMUNITY CENTER DRYCLEANERS INC (LEGALLY RESPONSIBLE PARTY)
220 WEST 98TH ST BLDG (220 WEST 98TH STREET in NEW YORK CITY, NY)
AIR SYNTHETIC MINOR (AIRS/AFS) STATE MASTER (New York facility tracking) - AIR PROGRAM Business SIC classification: OPERATORS OF APARTMENT BUILDINGS Business NAICS classification: LESSORS OF RESIDENTIAL BUILDINGS AND DWELLINGS. Organizations: 220 WEST 98 REALTY LLC (LEGALLY RESPONSIBLE PARTY)
, THE EXPANSION GROUP INC (LEGALLY RESPONSIBLE PARTY)
Alternative names: 220 WEST 98TH STREET BUILDING, EXPANSION GROUP
241 WEST 97TH STREET BUILDING (241 WEST 97TH STREET in NEW YORK CITY, NY)
AIR SYNTHETIC MINOR (AIRS/AFS) STATE MASTER (New York facility tracking) - AIR PROGRAM Business SIC classification: OPERATORS OF APARTMENT BUILDINGS Business NAICS classification: LESSORS OF RESIDENTIAL BUILDINGS AND DWELLINGS. Organizations: 3950 BLACKSTONE ASSOCIATES (LEGALLY RESPONSIBLE PARTY)
, 240 WEST 98TH STREET ASSOCIATES (LEGALLY RESPONSIBLE PARTY)
Alternative names: WEINREB MANAGEMENT
350 CENTRAL PARK WEST BUILDING (350 CENTRAL PARK WEST in NEW YORK CITY, NY)
AIR SYNTHETIC MINOR (AIRS/AFS) STATE MASTER (New York facility tracking) - AIR PROGRAM Business SIC classification: OPERATORS OF APARTMENT BUILDINGS Business NAICS classification: LESSORS OF RESIDENTIAL BUILDINGS AND DWELLINGS. Organizations: 3950 BLACKSTONE ASSOCIATES (LEGALLY RESPONSIBLE PARTY)
, 350 CENTRAL PARK WEST ASSOCIATES (LEGALLY RESPONSIBLE PARTY)
100 WEST 93RD STREET BUILDING (100 WEST 93 STREET in NEW YORK CITY, NY)
AIR SYNTHETIC MINOR (AIRS/AFS) STATE MASTER (New York facility tracking) - AIR PROGRAM Business SIC classification: OPERATORS OF APARTMENT BUILDINGS Business NAICS classification: LESSORS OF RESIDENTIAL BUILDINGS AND DWELLINGS. Organizations: LEADER HOUSE ASSOCIATES (LEGALLY RESPONSIBLE PARTY)
Alternative names: LEADER HOUSE ASSOCIATES - 100 WEST 93
250 W 94TH ST BUILDING (250 W 94TH ST in NEW YORK CITY, NY)
AIR SYNTHETIC MINOR (AIRS/AFS) STATE MASTER (New York facility tracking) - AIR PROGRAM Business SIC classification: OPERATORS OF APARTMENT BUILDINGS Business NAICS classification: LESSORS OF RESIDENTIAL BUILDINGS AND DWELLINGS. Organizations: 250 TENANTS CORP (LEGALLY RESPONSIBLE PARTY)
360 CENTRAL PARK WEST BUILDING (360 CENTRAL PARK WEST in NEW YORK, NY)
AIR SYNTHETIC MINOR (AIRS/AFS) STATE MASTER (New York facility tracking) - AIR PROGRAM Business SIC classification: OPERATORS OF APARTMENT BUILDINGS Business NAICS classification: LESSORS OF RESIDENTIAL BUILDINGS AND DWELLINGS. Organizations: ARGO CORP (LEGALLY RESPONSIBLE PARTY)
375 RIVERSIDE DRIVE BUILDING (375 RIVERSIDE DRIVE in NEW YORK CITY, NY)
AIR SYNTHETIC MINOR (AIRS/AFS) STATE MASTER (New York facility tracking) - AIR PROGRAM Business SIC classification: OPERATORS OF APARTMENT BUILDINGS Business NAICS classification: LESSORS OF RESIDENTIAL BUILDINGS AND DWELLINGS. Organizations: 375 RIVERSIDE DRIVE CORP (LEGALLY RESPONSIBLE PARTY)
Housing units lacking complete plumbing facilities: 1.5% Housing units lacking complete kitchen facilities: 1.4%
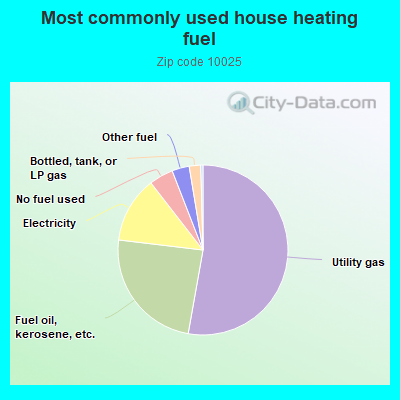
52.8%Utility gas
24.1%Fuel oil, kerosene, etc.
12.6%Electricity
4.6%No fuel used
3.3%Other fuel
2.2%Bottled, tank, or LP gas
Population in 1990: 100,027.
Place of birth for U.S.-born residents:
This state: 44,833
Northeast: 9,121
Midwest: 4,476
South: 6,530
West: 4,329
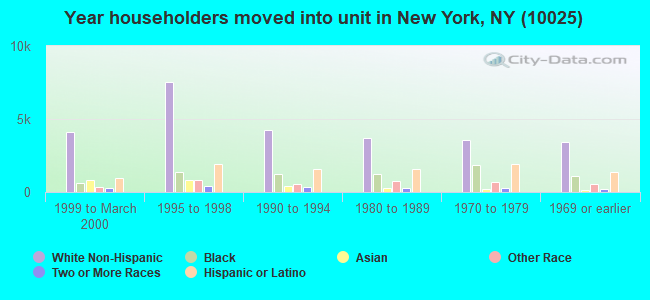
63% of the 10025 zip code residents lived in the same house 5 years ago. Out of people who lived in different houses, 47% lived in this county. Out of people who lived in different counties, 50% lived in New York.
86% of the 10025 zip code residents lived in the same house 1 year ago. Out of people who lived in different houses, 41% moved from this county. Out of people who lived in different houses, 17% moved from different county within same state. Out of people who lived in different houses, 26% moved from different state. Out of people who lived in different houses, 19% moved from abroad.
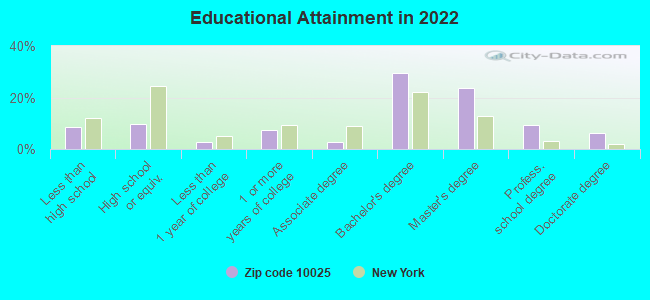
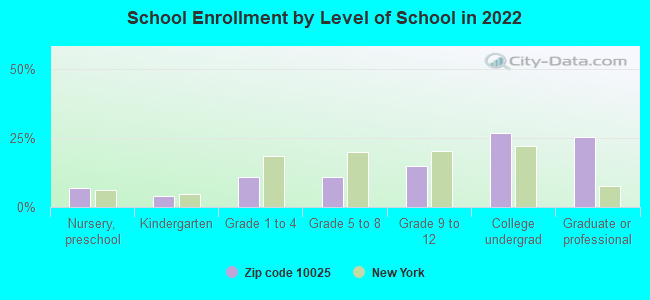
Private vs. public school enrollment:
Students in private schools in grades 1 to 8 (elementary and middle school): 1,926
Here:
37.4%
New York:
15.6%
Students in private schools in grades 9 to 12 (high school): 1,036
Here:
29.4%
New York:
15.0%
Students in private undergraduate colleges: 5,126
Here:
78.3%
New York:
39.2%
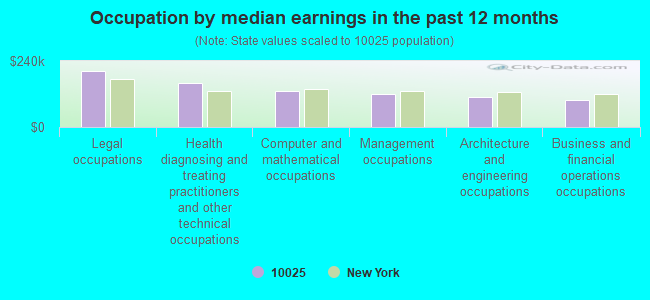
Occupation by median earnings in the past 12 months ($)
204,979Legal occupations
160,080Health diagnosing and treating practitioners and other technical occupations
129,097Computer and mathematical occupations
119,411Management occupations
110,785Architecture and engineering occupations
97,174Business and financial operations occupations
Companies with biggest federal contracts located in this zip code:
JOSEPH D CONNORS (50 MORNINGSIDE DRIVE, SUIT in NEW YORK, NY; small business) 50 employees, $0 revenue: $538,170 in 14 contractsfrom 2004 to 2006
Contracts for Engineering and Technical Services, Non-nuclear Ship Repair (West) Ship repair (including overhauls and conversions) performed on. non-nuclear propelled and nonpropelled ships west of the 108th meridian, Non-nuclear Ship Repair (East) Ship repair (including overhauls and conversions) performed on non-nuclear propelled and nonpropelled ships east of the 108th meridian by Navy Signed by year:2000: $0; 2001: $0; 2002: $0; 2003: $0; 2004: $342,994; 2005: $153,012; 2006: $42,164.
Biggest contracts:
$285,100 with Navy for Engineering and Technical Services. Signed on 2004-12-17. Completion date: 2005-07-20.
$40,200 with Navy for Non-nuclear Ship Repair (West) Ship repair (including overhauls and conversions) performed on. non-nuclear propelled and nonpropelled ships west of the 108th meridian. Taking place in CA. Signed on 2005-02-10. Completion date: 2005-02-11.
$34,747 with Navy for Non-nuclear Ship Repair (East) Ship repair (including overhauls and conversions) performed on non-nuclear propelled and nonpropelled ships east of the 108th meridian. Taking place in VA. Signed on 2006-05-17. Completion date: 2006-05-30.
$31,780 with Navy for Non-nuclear Ship Repair (West) Ship repair (including overhauls and conversions) performed on. non-nuclear propelled and nonpropelled ships west of the 108th meridian. Taking place in CA. Signed on 2005-01-04. Completion date: 2005-01-07.
john delaney (372 Central Park West, 4S in New York, NY; small business) : $427,363 in 3 contractsfrom 2005 to 2006
$206,006 with Departmental Offices for Personal Services Contracts. Taking place in DC. Signed on 2005-05-20. Effective on 2005-05-09. Completion date: 2006-05-08.
$193,323, same as above.Signed on 2006-05-09. Completion date: 2010-05-08.
$28,034, same as above.Signed on 2006-04-04. Completion date: 2010-05-08.
ENTERPRISEAIR INCORPORATED (260 RIVERSIDE DR APT 7 E in NEW YORK, NY; small business) 20 employees, $1000000 revenue. : $89,950 in 5 contractsin 2006
Contracts for Maintenance, Repair or Alteration of Real Property -- Office Buildings, Pesticides Support Services, Communications Security Equipment and Components by Public Buildings Service, Animal and Plant Health Inspection Service, Office of the Secretary, Department of Homeland Security Signed by year:2000: $0; 2001: $0; 2002: $0; 2003: $0; 2004: $0; 2005: $0; 2006: $89,950.
Biggest contracts:
$30,230 with Public Buildings Service for Maintenance, Repair or Alteration of Real Property -- Office Buildings. Signed on 2006-04-26. Completion date: 2006-05-31.
$22,100 with Animal and Plant Health Inspection Service for Pesticides Support Services. Signed on 2006-05-19. Completion date: 2006-09-30.
$21,520 with Office of the Secretary, Department of Homeland Security for Communications Security Equipment and Components. Taking place in DC. Signed on 2006-03-20. Completion date: 2006-03-22.
$12,500, same as above.Signed on 2006-04-05. Completion date: 2006-05-01.
LEWIS CONFERENCE SERVICES INTE (777 WEST END AVE in NEW YORK, NY; small business) : $65,000 in 3 contractsfrom 2002 to 2004
$32,500 with Navy for Other Professional Services. Taking place in WA. Signed on 2004-02-03. Completion date: 2005-03-31.
$17,500, same as above.Signed on 2003-04-01. Completion date: 2005-03-31.
$15,000, same as above.Signed on 2002-10-16. Completion date: 2005-03-31.
KESSLIN ASSOCIATES INC (230 W 107TH ST 3F in NEW YORK, NY; small business) : $43,412 in 5 contractsfrom 2000 to 2002
Contracts for Other Management Support Services by Army Signed by year:2000: $37,440; 2001: $1,930; 2002: $4,042; 2003: $0; 2004: $0; 2005: $0; 2006: $0.
Biggest contracts:
$37,440 with Army for Other Management Support Services. Signed on 2000-10-25. Completion date: 2004-09-30.
$4,900, same as above.Signed on 2001-12-11. Completion date: 2004-09-30.
$4,042, same as above.Signed on 2002-09-17. Completion date: 2004-09-30.
$0, same as above.Signed on 2000-10-25. Completion date: 2004-09-30.
ROCCO, JAMIE (250 WEST 104 ST APT 92 in NEW YORK, NY; small business)
$39,145 with Air Force for Patent and Trademark Services. Taking place in DC. Signed on 2003-05-13. Completion date: 2003-09-21.
AXEL J POLLAK (317 WEST 104TH STREET, APT in NEW YORK, NY; small business)
$30,570 with U.S. Army Corps of Engineers - civil program financing only for Other Research and Development -- Applied Research and Exploratory Development (R&D). Signed on 2001-06-08. Completion date: 2001-11-30.
WISHNICK, ELIZABETH (305 W 98TH ST 3ES in NEW YORK, NY; small business)
$13,000 with Army for Policy Review/Development Services. Taking place in PA. Signed on 2003-09-25. Completion date: 2003-12-30.
INTERNATIONAL SPORTS AND EVENT (2710 BROADWAY FL 2 in NEW YORK, NY; small business)
$12,500 with Navy for Miscellaneous Items. Signed on 2005-04-28. Completion date: 2005-05-08.
NITSO PRODUCTIONS (771 W END AVE APT 11B in NEW YORK, NY; small business)
$8,236 with Air Force for Other Social Services. Taking place in TX. Signed on 2005-06-30. Completion date: 2005-07-25.
Top industries in this zip code by the number of employees in 2005:
Health Care and Social Assistance: Nursing Care Facilities (over 1000 employees: 1 establishment, 500-999 employees: 1 establishment)
Health Care and Social Assistance: General Medical and Surgical Hospitals (over 1000: 1)
Other Services (except Public Administration): Other Similar Organizations (except Business, Professional, Labor, and Political Organizations) (50-99: 1, 20-49: 2, 10-19: 20, 5-9: 38, 1-4: 64)
Health Care and Social Assistance: Home Health Care Services (500-999: 1, 50-99: 1, 5-9: 1, 1-4: 1)
Educational Services: Colleges, Universities, and Professional Schools (500-999: 1, 10-19: 1, 1-4: 1)
People in group quarters in 2010:
3,915 people in college/university student housing
1,043 people in nursing facilities/skilled-nursing facilities
781 people in emergency and transitional shelters (with sleeping facilities) for people experiencing homelessness
413 people in other noninstitutional facilities
184 people in residential treatment centers for adults
166 people in group homes intended for adults
73 people in workers' group living quarters and job corps centers
32 people in residential treatment centers for juveniles (non-correctional)
21 people in mental (psychiatric) hospitals and psychiatric units in other hospitals
People in group quarters in 2000:
3,602 people in college dormitories (includes college quarters off campus)
892 people in nursing homes
334 people in other group homes
180 people in other noninstitutional group quarters
174 people in homes for the mentally ill
171 people in homes or halfway houses for drug/alcohol abuse
79 people in other types of correctional institutions
54 people in homes for the mentally retarded
49 people in religious group quarters
32 people in mental (psychiatric) hospitals or wards
Fatal accident statistics in 2014:
Fatal accident count: 6
Vehicles involved in fatal accidents: 7
Fatal accidents caused by drunken drivers: 0
Fatalities: 6
Persons involved in fatal accidents: 11
Pedestrians involved in fatal accidents: 7
Fatal accident statistics in 2013:
Fatal accident count: 1
Vehicles involved in fatal accidents: 2
Fatal accidents caused by drunken drivers: 0
Fatalities: 1
Persons involved in fatal accidents: 1
Pedestrians involved in fatal accidents: 2
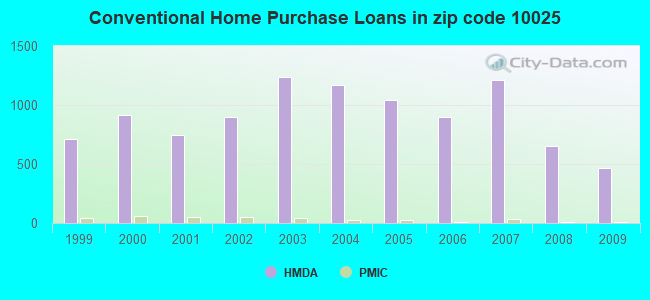
Home Mortgage Disclosure Act Aggregated Statistics For Year 2009 (Based on 11 full and 10 partial tracts)
A) FHA, FSA/RHS & VA Home Purchase Loans
B) Conventional Home Purchase Loans
C) Refinancings
D) Home Improvement Loans
E) Loans on Dwellings For 5+ Families
F) Non-occupant Loans on < 5 Family Dwellings (A B C & D)
G) Loans On Manufactured Home Dwelling (A B C & D)
Number
Average Value
Number
Average Value
Number
Average Value
Number
Average Value
Number
Average Value
Number
Average Value
Number
Average Value
LOANS ORIGINATED
0
$0
469
$523,118
1,190
$432,648
38
$295,471
29
$1,611,661
94
$405,217
0
$0
APPLICATIONS APPROVED, NOT ACCEPTED
2
$326,470
69
$557,324
140
$493,079
0
$0
17
$2,581,382
13
$416,525
0
$0
APPLICATIONS DENIED
3
$624,667
116
$504,781
432
$466,242
23
$38,887
0
$0
57
$308,570
1
$3,000
APPLICATIONS WITHDRAWN
1
$689,000
81
$509,800
145
$484,811
3
$252,333
2
$2,889,000
24
$550,461
0
$0
FILES CLOSED FOR INCOMPLETENESS
2
$490,000
30
$528,121
70
$451,568
2
$317,005
0
$0
8
$323,424
0
$0
Aggregated Statistics For Year 2008 (Based on 11 full and 10 partial tracts)
A) FHA, FSA/RHS & VA Home Purchase Loans
B) Conventional Home Purchase Loans
C) Refinancings
D) Home Improvement Loans
E) Loans on Dwellings For 5+ Families
F) Non-occupant Loans on < 5 Family Dwellings (A B C & D)
G) Loans On Manufactured Home Dwelling (A B C & D)
Number
Average Value
Number
Average Value
Number
Average Value
Number
Average Value
Number
Average Value
Number
Average Value
Number
Average Value
LOANS ORIGINATED
0
$0
650
$743,913
415
$536,480
48
$455,206
41
$5,875,486
93
$548,031
0
$0
APPLICATIONS APPROVED, NOT ACCEPTED
0
$0
176
$879,249
59
$466,346
16
$473,651
2
$4,572,500
24
$1,420,269
0
$0
APPLICATIONS DENIED
2
$592,590
218
$681,887
169
$522,712
42
$148,454
4
$18,150,925
51
$461,855
1
$25,000
APPLICATIONS WITHDRAWN
0
$0
133
$901,245
70
$630,912
0
$0
5
$9,481,116
23
$748,196
0
$0
FILES CLOSED FOR INCOMPLETENESS
0
$0
51
$754,704
28
$662,372
3
$978,973
0
$0
12
$543,908
0
$0
Aggregated Statistics For Year 2007 (Based on 11 full and 10 partial tracts)
B) Conventional Home Purchase Loans
C) Refinancings
D) Home Improvement Loans
E) Loans on Dwellings For 5+ Families
F) Non-occupant Loans on < 5 Family Dwellings (A B C & D)
Number
Average Value
Number
Average Value
Number
Average Value
Number
Average Value
Number
Average Value
LOANS ORIGINATED
1,216
$630,778
353
$462,744
56
$304,690
122
$4,030,762
165
$567,760
APPLICATIONS APPROVED, NOT ACCEPTED
269
$821,984
70
$548,556
25
$115,291
2
$890,370
36
$633,213
APPLICATIONS DENIED
238
$615,196
173
$533,134
46
$210,417
5
$1,049,398
39
$331,918
APPLICATIONS WITHDRAWN
163
$724,045
61
$365,148
9
$297,011
4
$2,535,200
25
$609,025
FILES CLOSED FOR INCOMPLETENESS
40
$763,435
27
$557,530
3
$295,167
0
$0
6
$878,613
Aggregated Statistics For Year 2006 (Based on 11 full and 10 partial tracts)
B) Conventional Home Purchase Loans
C) Refinancings
D) Home Improvement Loans
E) Loans on Dwellings For 5+ Families
F) Non-occupant Loans on < 5 Family Dwellings (A B C & D)
Number
Average Value
Number
Average Value
Number
Average Value
Number
Average Value
Number
Average Value
LOANS ORIGINATED
901
$624,701
360
$481,241
59
$304,029
55
$3,279,490
154
$546,832
APPLICATIONS APPROVED, NOT ACCEPTED
172
$578,859
66
$385,153
16
$182,874
1
$1,500,000
33
$502,928
APPLICATIONS DENIED
230
$687,849
136
$472,380
48
$121,856
4
$378,250
49
$461,082
APPLICATIONS WITHDRAWN
176
$663,488
102
$472,057
1
$100,000
4
$1,605,000
30
$530,042
FILES CLOSED FOR INCOMPLETENESS
44
$688,377
36
$413,601
10
$269,147
0
$0
12
$457,277
Aggregated Statistics For Year 2005 (Based on 11 full and 10 partial tracts)
B) Conventional Home Purchase Loans
C) Refinancings
D) Home Improvement Loans
E) Loans on Dwellings For 5+ Families
F) Non-occupant Loans on < 5 Family Dwellings (A B C & D)
Number
Average Value
Number
Average Value
Number
Average Value
Number
Average Value
Number
Average Value
LOANS ORIGINATED
1,040
$615,542
603
$403,889
74
$240,187
65
$1,520,819
164
$515,539
APPLICATIONS APPROVED, NOT ACCEPTED
201
$598,862
92
$363,131
13
$153,080
2
$3,050,000
35
$389,569
APPLICATIONS DENIED
213
$574,530
169
$359,532
57
$148,337
4
$1,768,345
61
$466,255
APPLICATIONS WITHDRAWN
149
$631,434
102
$339,900
17
$264,761
5
$13,480,000
18
$381,482
FILES CLOSED FOR INCOMPLETENESS
51
$536,427
52
$417,867
5
$297,082
0
$0
13
$507,718
Aggregated Statistics For Year 2004 (Based on 11 full and 10 partial tracts)
B) Conventional Home Purchase Loans
C) Refinancings
D) Home Improvement Loans
E) Loans on Dwellings For 5+ Families
F) Non-occupant Loans on < 5 Family Dwellings (A B C & D)
Number
Average Value
Number
Average Value
Number
Average Value
Number
Average Value
Number
Average Value
LOANS ORIGINATED
1,169
$505,400
742
$377,606
70
$211,494
79
$2,459,957
143
$388,133
APPLICATIONS APPROVED, NOT ACCEPTED
181
$535,465
120
$409,446
19
$176,915
4
$10,025,500
19
$427,791
APPLICATIONS DENIED
213
$545,701
206
$366,700
56
$110,170
2
$15,088,000
38
$275,545
APPLICATIONS WITHDRAWN
153
$504,073
112
$394,111
17
$368,739
8
$2,418,742
19
$378,382
FILES CLOSED FOR INCOMPLETENESS
32
$524,869
43
$319,358
11
$217,525
0
$0
6
$155,818
Aggregated Statistics For Year 2003 (Based on 11 full and 10 partial tracts)
B) Conventional Home Purchase Loans
C) Refinancings
D) Home Improvement Loans
E) Loans on Dwellings For 5+ Families
F) Non-occupant Loans on < 5 Family Dwellings (A B C & D)
Number
Average Value
Number
Average Value
Number
Average Value
Number
Average Value
Number
Average Value
LOANS ORIGINATED
1,237
$472,627
2,527
$317,502
23
$111,973
61
$2,317,974
245
$331,246
APPLICATIONS APPROVED, NOT ACCEPTED
158
$467,656
321
$320,722
7
$28,794
8
$597,759
36
$331,983
APPLICATIONS DENIED
195
$475,464
418
$354,849
39
$52,973
4
$721,750
85
$328,130
APPLICATIONS WITHDRAWN
86
$542,020
158
$310,078
9
$77,421
9
$3,518,667
33
$313,748
FILES CLOSED FOR INCOMPLETENESS
49
$444,545
107
$292,583
2
$91,015
2
$438,500
11
$343,627
Aggregated Statistics For Year 2002 (Based on 11 full and 10 partial tracts)
A) FHA, FSA/RHS & VA Home Purchase Loans
B) Conventional Home Purchase Loans
C) Refinancings
D) Home Improvement Loans
E) Loans on Dwellings For 5+ Families
F) Non-occupant Loans on < 5 Family Dwellings (A B C & D)
Number
Average Value
Number
Average Value
Number
Average Value
Number
Average Value
Number
Average Value
Number
Average Value
LOANS ORIGINATED
0
$0
898
$403,685
1,571
$333,772
29
$65,581
50
$2,305,416
146
$331,317
APPLICATIONS APPROVED, NOT ACCEPTED
0
$0
132
$424,631
251
$330,126
7
$110,803
4
$2,049,750
35
$260,651
APPLICATIONS DENIED
1
$111,000
119
$488,553
273
$299,596
48
$27,782
12
$524,976
56
$171,440
APPLICATIONS WITHDRAWN
0
$0
92
$410,316
156
$340,319
8
$105,556
6
$2,499,027
29
$432,478
FILES CLOSED FOR INCOMPLETENESS
0
$0
37
$394,299
71
$298,266
6
$48,233
1
$894,000
17
$283,641
Aggregated Statistics For Year 2001 (Based on 11 full and 10 partial tracts)
B) Conventional Home Purchase Loans
C) Refinancings
D) Home Improvement Loans
E) Loans on Dwellings For 5+ Families
F) Non-occupant Loans on < 5 Family Dwellings (A B C & D)
Number
Average Value
Number
Average Value
Number
Average Value
Number
Average Value
Number
Average Value
LOANS ORIGINATED
747
$345,596
765
$306,551
20
$94,736
51
$3,685,819
84
$265,077
APPLICATIONS APPROVED, NOT ACCEPTED
127
$375,867
106
$362,348
5
$68,160
1
$4,500,000
23
$195,718
APPLICATIONS DENIED
133
$380,622
178
$277,109
37
$61,040
4
$849,615
38
$194,352
APPLICATIONS WITHDRAWN
68
$344,482
137
$235,594
18
$54,429
1
$1,220,000
17
$164,630
FILES CLOSED FOR INCOMPLETENESS
26
$315,969
53
$225,852
5
$41,950
1
$2,500,000
6
$297,833
Aggregated Statistics For Year 2000 (Based on 11 full and 10 partial tracts)
A) FHA, FSA/RHS & VA Home Purchase Loans
B) Conventional Home Purchase Loans
C) Refinancings
D) Home Improvement Loans
E) Loans on Dwellings For 5+ Families
F) Non-occupant Loans on < 5 Family Dwellings (A B C & D)
Number
Average Value
Number
Average Value
Number
Average Value
Number
Average Value
Number
Average Value
Number
Average Value
LOANS ORIGINATED
1
$165,000
913
$350,787
228
$276,771
55
$64,888
38
$3,641,799
88
$266,522
APPLICATIONS APPROVED, NOT ACCEPTED
0
$0
150
$397,416
68
$286,224
9
$56,439
0
$0
13
$262,222
APPLICATIONS DENIED
1
$168,000
180
$341,981
143
$156,612
41
$39,305
7
$1,623,204
25
$228,481
APPLICATIONS WITHDRAWN
1
$164,000
93
$544,163
73
$183,537
9
$36,858
1
$3,400,000
11
$264,125
FILES CLOSED FOR INCOMPLETENESS
0
$0
33
$384,641
16
$221,913
12
$66,302
0
$0
9
$281,288
Aggregated Statistics For Year 1999 (Based on 9 full and 5 partial tracts)
A) FHA, FSA/RHS & VA Home Purchase Loans
B) Conventional Home Purchase Loans
C) Refinancings
D) Home Improvement Loans
E) Loans on Dwellings For 5+ Families
F) Non-occupant Loans on < 5 Family Dwellings (A B C & D)
2007 - 2018 National Fire Incident Reporting System (NFIRS) incidents
According to the data from the years 2007 - 2018 the average number of fire incidents per year is 414. The highest number of reported fires - 511 took place in 2008, and the least - 292 in 2007. The data has a growing trend.
When looking into fire subcategories, the most reports belonged to: Structure Fires (78.1%), and Outside Fires (15.4%).
Fire incident types reported to NFIRS in Zip Code 10025

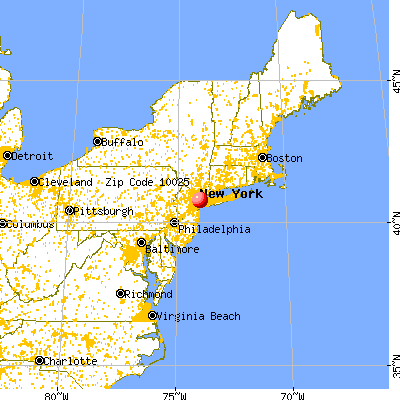


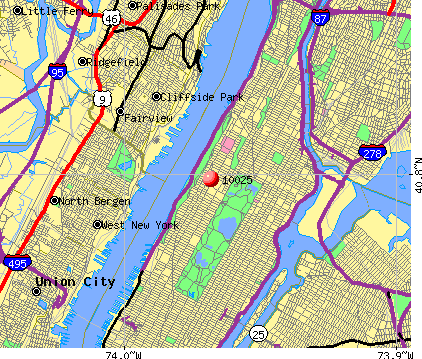 Nearest zip codes: 10024, 10115, 10026, 10027, 10029, 10128.


 According to the data from the years 2007 - 2018 the average number of fire incidents per year is 414. The highest number of reported fires - 511 took place in 2008, and the least - 292 in 2007. The data has a growing trend.
 When looking into fire subcategories, the most reports belonged to: Structure Fires (78.1%), and Outside Fires (15.4%).