Estimated zip code population in 2022: 60,075 Zip code population in 2010: 56,438 Zip code population in 2000: 60,221
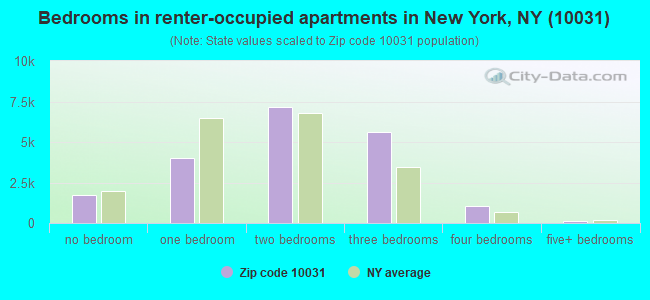
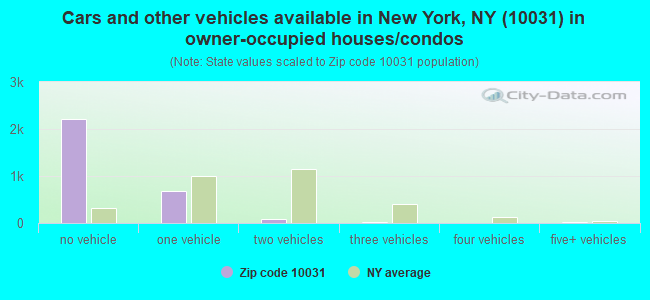
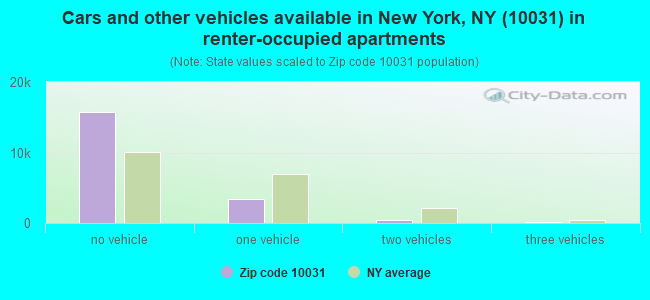
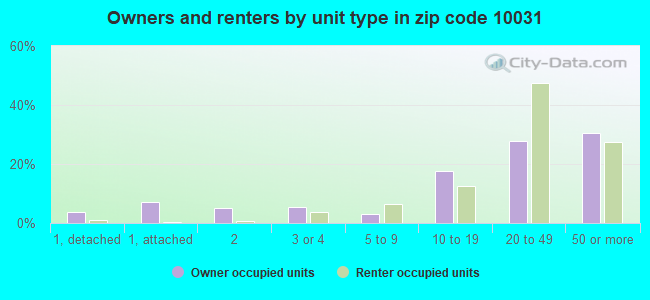
Houses and condos: 24,575 Renter-occupied apartments: 19,686
% of renters here:
87%
State:
46%
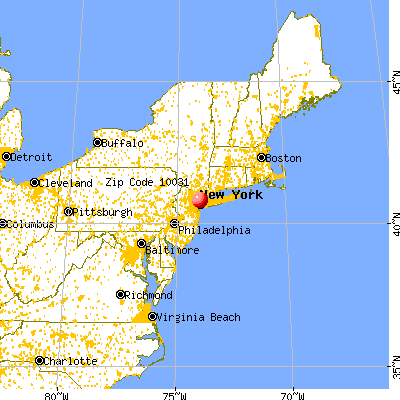
March 2022 cost of living index in zip code 10031: 153.1 (very high, U.S. average is 100)
Land area: 0.7 sq. mi. Water area: 0.0 sq. mi.
Population density: 92,311 people per square mile
(very high).
OSM Map
General Map
Google Map
MSN Map
OSM Map
General Map
Google Map
MSN Map
OSM Map
General Map
Google Map
MSN Map
OSM Map
General Map
Google Map
MSN Map
Please wait while loading the map...
Real estate property taxes paid for housing units in 2022:
This zip code:
0.7% ($4,489)
New York:
1.5% ($6,180)
Median real estate property taxes paid for housing units with mortgages in 2022: $4,642 (0.6%) Median real estate property taxes paid for housing units with no mortgage in 2022: $4,348 (0.7%)
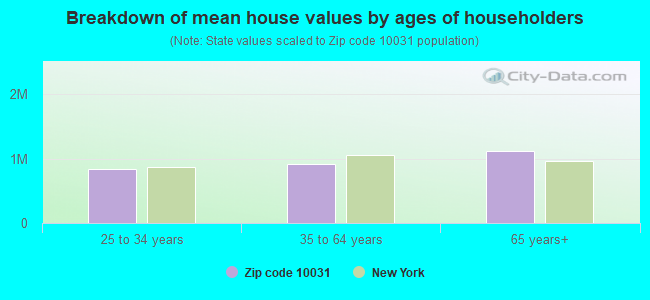
Estimated median house/condo value in 2022: $656,631
10031:
$656,631
New York:
$400,400
According to our research of New York and other state lists, there were 56 registered sex offenders living in 10031 zip code as of April 27, 2024. The ratio of all residents to sex offenders in zip code 10031 is 1,101 to 1. The ratio of registered sex offenders to all residents in this zip code is near the state average.
Median resident age:
This zip code:
36.7 years
New York median age:
40.0 years
Average household size:
This zip code:
2.6 people
New York:
2.5 people
Averages for the 2020 tax year for zip code 10031, filed in 2021:
Average Adjusted Gross Income (AGI) in 2020: $45,285 (Individual Income Tax Returns)
Here:
$45,285
State:
$90,930
Salary/wage: $44,276 (reported on 79.3% of returns)
Here:
$44,276
State:
$72,104
(% of AGI for various income ranges: 913.2% for AGIs below $25k, 3301.9% for AGIs $25k-50k, 6880.0% for AGIs $50k-75k, 10838.5% for AGIs $75k-100k, 19081.2% for AGIs $100k-200k, 90751.2% for AGIs over 200k)
Taxable interest for individuals: $845 (reported on 15.2% of returns)
This zip code:
$845
New York:
$3,075
(% of AGI for various income ranges: 3.4% for AGIs below $25k, 4.3% for AGIs $25k-50k, 8.5% for AGIs $50k-75k, 21.7% for AGIs $75k-100k, 48.7% for AGIs $100k-200k, 1288.1% for AGIs over 200k)
Ordinary dividends: $2,907 (reported on 9.1% of returns)
Here:
$2,907
State:
$11,095
(% of AGI for various income ranges: 5.6% for AGIs below $25k, 11.5% for AGIs $25k-50k, 22.1% for AGIs $50k-75k, 50.4% for AGIs $75k-100k, 136.6% for AGIs $100k-200k, 2257.5% for AGIs over 200k)
Net capital gain/loss in AGI: +$7,184 (reported on 9.2% of returns)
Here:
+$7,184
State:
+$44,925
(% of AGI for various income ranges: 5.7% for AGIs below $25k, 13.5% for AGIs $25k-50k, 32.4% for AGIs $50k-75k, 85.9% for AGIs $75k-100k, 323.7% for AGIs $100k-200k, 7637.5% for AGIs over 200k)
Profit/loss from business: +$7,148 (reported on 22.1% of returns)
Here:
+$7,148
State:
+$14,940
(% of AGI for various income ranges: 223.2% for AGIs below $25k, 121.2% for AGIs $25k-50k, 122.0% for AGIs $50k-75k, 203.7% for AGIs $75k-100k, 570.7% for AGIs $100k-200k, 4130.6% for AGIs over 200k)
Taxable individual retirement arrangement distribution: $12,676 (reported on 1.6% of returns)
10031:
$12,676
New York:
$19,609
(% of AGI for various income ranges: 7.7% for AGIs below $25k, 11.8% for AGIs $25k-50k, 26.0% for AGIs $50k-75k, 44.1% for AGIs $75k-100k, 180.1% for AGIs $100k-200k, 625.6% for AGIs over 200k)
Self-employed (Keogh) retirement plans: $18,518 (reported on 0.4% of returns)
10031:
$18,518
New York:
$32,497
(% of AGI for various income ranges: 4.8% for AGIs $25k-50k, 34.4% for AGIs $75k-100k, 785.6% for AGIs over 200k)
Total itemized deductions: $27,732 (reported on 3.9% of returns)
Here:
$27,732
State:
$39,326
(% of AGI for various income ranges: 18.9% for AGIs below $25k, 32.2% for AGIs $25k-50k, 130.1% for AGIs $50k-75k, 342.6% for AGIs $75k-100k, 858.3% for AGIs $100k-200k, 5966.9% for AGIs over 200k)
Charity contributions: $7,557 (reported on 3.1% of returns)
Here:
$7,557
State:
$15,420
(% of AGI for various income ranges: 1.3% for AGIs below $25k, 5.5% for AGIs $25k-50k, 25.1% for AGIs $50k-75k, 64.1% for AGIs $75k-100k, 226.3% for AGIs $100k-200k, 1373.1% for AGIs over 200k)
Taxes paid: $8,418 (reported on 3.8% of returns)
10031:
$8,418
State:
$9,183
(% of AGI for various income ranges: 4.0% for AGIs below $25k, 8.3% for AGIs $25k-50k, 39.1% for AGIs $50k-75k, 127.6% for AGIs $75k-100k, 309.9% for AGIs $100k-200k, 1393.8% for AGIs over 200k)
Earned income credit: $1,925 (reported on 21.2% of returns)
Here:
$1,925
State:
$2,138
(% of AGI for various income ranges: 96.8% for AGIs below $25k, 57.0% for AGIs $25k-50k, 0.3% for AGIs $50k-75k)
Percentage of individuals using paid preparers for their 2020 taxes: 93.3%
Here:
93%
State:
95%
(% for various income ranges: 90.9% for AGIs below $25k, 95.0% for AGIs $25k-50k, 94.8% for AGIs $50k-75k, 94.6% for AGIs $75k-100k, 94.6% for AGIs $100k-200k, 98.0% for AGIs over 200k)
Averages for the 2012 tax year for zip code 10031, filed in 2013:
Average Adjusted Gross Income (AGI) in 2012: $33,193 (Individual Income Tax Returns)
Here:
$33,193
State:
$77,088
Salary/wage: $34,632 (reported on 81.8% of returns)
Here:
$34,632
State:
$60,593
(% of AGI for various income ranges: 72.3% for AGIs below $25k, 92.2% for AGIs $25k-50k, 91.9% for AGIs $50k-75k, 88.7% for AGIs $75k-100k, 86.3% for AGIs $100k-200k, 74.3% for AGIs over 200k)
Taxable interest for individuals: $366 (reported on 14.3% of returns)
This zip code:
$366
New York:
$3,125
(% of AGI for various income ranges: 0.2% for AGIs below $25k, 0.1% for AGIs $25k-50k, 0.1% for AGIs $75k-100k, 0.2% for AGIs $100k-200k, 0.4% for AGIs over 200k)
Ordinary dividends: $1,906 (reported on 5.4% of returns)
Here:
$1,906
State:
$10,299
(% of AGI for various income ranges: 0.3% for AGIs below $25k, 0.2% for AGIs $25k-50k, 0.2% for AGIs $50k-75k, 0.2% for AGIs $75k-100k, 0.4% for AGIs $100k-200k, 0.9% for AGIs over 200k)
Net capital gain/loss in AGI: +$7,354 (reported on 4.7% of returns)
Here:
+$7,354
State:
+$42,474
(% of AGI for various income ranges: 0.3% for AGIs $75k-100k, 0.7% for AGIs $100k-200k, 10.3% for AGIs over 200k)
Profit/loss from business: +$7,876 (reported on 22.8% of returns)
Here:
+$7,876
State:
+$16,168
(% of AGI for various income ranges: 18.5% for AGIs below $25k, 2.1% for AGIs $25k-50k, 1.1% for AGIs $50k-75k, 1.6% for AGIs $75k-100k, 3.1% for AGIs $100k-200k, 3.5% for AGIs over 200k)
Taxable individual retirement arrangement distribution: $9,441 (reported on 1.8% of returns)
10031:
$9,441
New York:
$17,621
(% of AGI for various income ranges: 0.4% for AGIs below $25k, 0.3% for AGIs $25k-50k, 0.6% for AGIs $50k-75k, 0.5% for AGIs $75k-100k, 0.9% for AGIs $100k-200k, 0.7% for AGIs over 200k)
Self-employment retirement plans: $14,283 (reported on 0.2% of returns)
10031:
$14,283
New York:
$27,330
Total itemized deductions: $18,306 (24% of AGI, reported on 19.2% of returns)
Here:
$18,306
State:
$34,985
Here:
23.6% of AGI
State:
21.3% of AGI
(% of AGI for various income ranges: 3.2% for AGIs below $25k, 8.6% for AGIs $25k-50k, 12.5% for AGIs $50k-75k, 14.5% for AGIs $75k-100k, 16.7% for AGIs $100k-200k, 15.7% for AGIs over 200k)
Charity contributions: $2,904 (reported on 14.8% of returns)
Here:
$2,904
State:
$5,572
(% of AGI for various income ranges: 0.3% for AGIs below $25k, 1.1% for AGIs $25k-50k, 1.7% for AGIs $50k-75k, 1.9% for AGIs $75k-100k, 2.0% for AGIs $100k-200k, 1.7% for AGIs over 200k)
Taxes paid: $7,581 (reported on 19.0% of returns)
10031:
$7,581
State:
$18,656
(% of AGI for various income ranges: 0.5% for AGIs below $25k, 2.0% for AGIs $25k-50k, 4.7% for AGIs $50k-75k, 6.8% for AGIs $75k-100k, 8.9% for AGIs $100k-200k, 10.2% for AGIs over 200k)
Earned income credit: $2,256 (reported on 32.1% of returns)
Here:
$2,256
State:
$2,230
(% of AGI for various income ranges: 9.6% for AGIs below $25k, 0.9% for AGIs $25k-50k)
Percentage of individuals using paid preparers for their 2012 taxes: 65.2%
Here:
65%
State:
66%
(% for various income ranges: 65.9% for AGIs below $25k, 64.0% for AGIs $25k-50k, 64.0% for AGIs $50k-75k, 63.2% for AGIs $75k-100k, 65.9% for AGIs $100k-200k, 77.3% for AGIs over 200k)
Averages for the 2004 tax year for zip code 10031, filed in 2005:
Average Adjusted Gross Income (AGI) in 2004: $25,209 (Individual Income Tax Returns)
Here:
$25,209
State:
$59,519
Salary/wage: $26,686 (reported on 82.7% of returns)
Here:
$26,686
State:
$50,673
(% of AGI for various income ranges: 61.5% for AGIs below $10k, 82.1% for AGIs $10k-25k, 94.7% for AGIs $25k-50k, 91.6% for AGIs $50k-75k, 90.3% for AGIs $75k-100k, 81.3% for AGIs over 100k)
Taxable interest for individuals: $483 (reported on 17.7% of returns)
This zip code:
$483
New York:
$2,377
(% of AGI for various income ranges: 0.4% for AGIs below $10k, 0.3% for AGIs $10k-25k, 0.2% for AGIs $25k-50k, 0.3% for AGIs $50k-75k, 0.7% for AGIs $75k-100k, 0.6% for AGIs over 100k)
Taxable dividends: $994 (reported on 4.9% of returns)
Here:
$994
State:
$5,394
(% of AGI for various income ranges: 0.2% for AGIs below $10k, 0.1% for AGIs $10k-25k, 0.1% for AGIs $25k-50k, 0.3% for AGIs $50k-75k, 0.4% for AGIs $75k-100k, 0.5% for AGIs over 100k)
Net capital gain/loss: +$2,345 (reported on 3.6% of returns)
Here:
+$2,345
State:
+$23,581
(% of AGI for various income ranges: -0.1% for AGIs below $10k, 0.0% for AGIs $10k-25k, -0.0% for AGIs $25k-50k, 0.1% for AGIs $50k-75k, 0.1% for AGIs $75k-100k, 3.0% for AGIs over 100k)
Profit/loss from business: +$6,435 (reported on 23.2% of returns)
Here:
+$6,435
State:
+$13,809
(% of AGI for various income ranges: 41.0% for AGIs below $10k, 11.7% for AGIs $10k-25k, 0.9% for AGIs $25k-50k, 0.6% for AGIs $50k-75k, 1.8% for AGIs $75k-100k, 1.9% for AGIs over 100k)
IRA payment deduction: $2,019 (reported on 1.1% of returns)
10031:
$2,019
New York:
$3,115
(% of AGI for various income ranges: 0.1% for AGIs below $10k, 0.1% for AGIs $10k-25k, 0.1% for AGIs $25k-50k, 0.1% for AGIs $50k-75k, 0.2% for AGIs $75k-100k)
Self-employed pension: $7,088 (reported on 0.1% of returns)
Here:
$7,088
New York:
$19,016
Total itemized deductions: $15,684 (29% of AGI, reported on 19.7% of returns)
Here:
$15,684
State:
$25,864
Here:
29.0% of AGI
State:
21.9% of AGI
(% of AGI for various income ranges: 1.5% for AGIs below $10k, 4.6% for AGIs $10k-25k, 13.2% for AGIs $25k-50k, 17.8% for AGIs $50k-75k, 17.9% for AGIs $75k-100k, 19.1% for AGIs over 100k)
Charity contributions deductions: $2,993 (5% of AGI, reported on 17.9% of returns)
Here:
$2,993
State:
$4,439
Here:
5.4% of AGI
State:
3.6% of AGI
(% of AGI for various income ranges: 0.1% for AGIs below $10k, 0.8% for AGIs $10k-25k, 2.4% for AGIs $25k-50k, 3.4% for AGIs $50k-75k, 3.1% for AGIs $75k-100k, 2.7% for AGIs over 100k)
Total tax: $3,083 (reported on 65.4% of returns)
10031:
$3,083
State:
$11,730
(% of AGI for various income ranges: 6.5% for AGIs below $10k, 3.8% for AGIs $10k-25k, 5.9% for AGIs $25k-50k, 10.0% for AGIs $50k-75k, 12.8% for AGIs $75k-100k, 19.0% for AGIs over 100k)
Earned income credit: $2,002 (reported on 41.6% of returns)
Here:
$2,002
State:
$1,757
Percentage of individuals using paid preparers for their 2004 taxes: 72.8%
Here:
73%
State:
67%
(% for various income ranges: 71.2% for AGIs below $10k, 77.5% for AGIs $10k-25k, 69.0% for AGIs $25k-50k, 70.5% for AGIs $50k-75k, 71.0% for AGIs $75k-100k, 74.9% for AGIs over 100k)
Likely homosexual households (counted as self-reported same-sex unmarried-partner households)
Lesbian couples: 0.4% of all households
Gay men: 0.9% of all households
Household received Food Stamps/SNAP in the past 12 months: 6,618 Household did not receive Food Stamps/SNAP in the past 12 months: 16,256
Women who had a birth in the past 12 months: 544 (180 now married, 374 unmarried) Women who did not have a birth in the past 12 months: 15,854 (4,018 now married, 11,920 unmarried)
Housing units in zip code 10031 with a mortgage: 1,400 (102 second mortgage, 90 both second mortgage and home equity loan) Houses without a mortgage: 23
Residents with income below the poverty level in 2022:
This zip code:
21.8%
Whole state:
14.3%
Residents with income below 50% of the poverty level in 2022:
This zip code:
11.5%
Whole state:
6.8%
Median number of rooms in houses and condos:
Here:
4.6
State:
6.3
Median number of rooms in apartments:
Here:
4.1
State:
3.8
Notable locations in this zip code not listed on our city pages
Notable locations in zip code 10031: North River Water Pollution Control Plant (A), Onehundredthirtyfifth Street Gatehouse New Croton Aqueduct (B), Wilson Major Morris Community Center (C), New York Ladder Company 23 (D), Fire Department New York Engine 80 Ladder 23 (E), Dance Theatre of Harlem (F), Hamilton Grange Branch New York Public Library (G), Marshak Hall (H), Wingate Hall (I), Thirtieth Precinct Police Station (J), Shepard Hall (K), Harris Hall (L), Goethals Hall (M), Compton Hall (N), Baskerville Hall (O). Display/hide their locations on the map
Churches in zip code 10031 include: Russian Holy Fathers Church (A), Church of Saint Catherine of Genoa (B), Saint Luke African Methodist Episcopal Church (C), Saint John's Baptist Church (D), City Tabernacle (E), Church of the Crucifixion (F), Our Lady of Lourdes Church (G), Saint Luke's Church (H). Display/hide their locations on the map
Parks in zip code 10031 include: Riverbank State Park (1), Hamilton Grange National Monument (2), Alexander Hamilton Square (3), Jackie Robinson Play Center (4), Hamilton Heights Historic District (5), Carmansville Playground (6), Convent Garden (7), Donnellan Square (8), Montefiore Park (9). Display/hide their locations on the map
3,697 married couples with children.
2,566 single-parent households (685 men, 1,881 women).
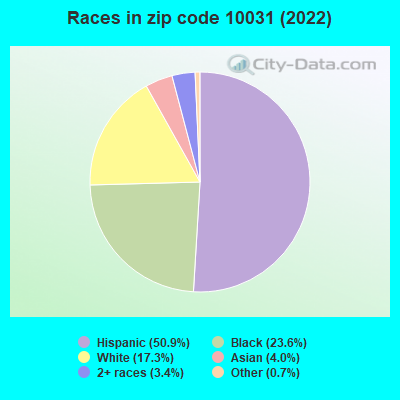
44.8% of residents of 10031 zip code speak English at home.
44.4% of residents speak Spanish at home (50% very well, 13% well, 21% not well, 15% not at all).
5.6% of residents speak other Indo-European language at home (83% very well, 15% well, 1% not well).
2.2% of residents speak Asian or Pacific Island language at home (83% very well, 15% well, 1% not well, 1% not at all).
2.5% of residents speak other language at home (85% very well, 9% well, 6% not well).
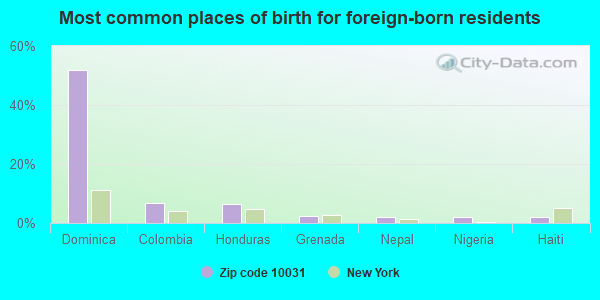
Foreign born population: 22,229 (37.0%) (55.1% of them are naturalized citizens)
Major facilities with environmental interests located in this zip code:
CITY COLLEGE OF NEW YORK (201 CONVENT AVENUE AVE in NEW YORK, NY)
AIR SYNTHETIC MINOR (AIRS/AFS) STATE MASTER (New York facility tracking) - REFUSE DISPOSAL, HAZARDOUS WASTE PROGRAM, AIR PROGRAM CRITERIA AND HAZARDOUS AIR POLLUTANT INVENTORY (Inventory of air pollution sources) STATE MASTER (New Jersey environmental info) - NJEMS-210126, REFUSE DISPOSAL HAZARDOUS WASTE BIENNIAL REPORTER (Resource Conservation and Recovery Act (tracking hazardous waste)) - ICIS-, ENFORCEMENT/COMPLIANCE ACTIVITY, ICIS-02-2004-0883, Large Quantity Generators, more that 1000 kg of hazardous waste/month (Resource Conservation and Recovery Act (tracking hazardous waste)) - ICIS-, ENFORCEMENT/COMPLIANCE ACTIVITY, ICIS-02-2004-0883, Business SIC and NAICS classification: COLLEGES, UNIVERSITIES, AND PROFESSIONAL SCHOOLS Organizations: CITY UNIVERSITY OF NEW YORK (CONTACT/OWNER)
Alternative names: NYSDA-CITY COLLEGE
I & O CLEANERS (3411 BROADWAY in MANHATTAN, NY)
AIR MINOR (AIRS/AFS) STATE MASTER (New York facility tracking) - AIR PROGRAM, HAZARDOUS WASTE PROGRAM (Integrated Compliance Information System) - ICIS-02-2002-1281, FORMAL ENFORCEMENT ACTION Small Quantity Generators, between 100 kg and 1000 kg of hazardous waste/month (Resource Conservation and Recovery Act (tracking hazardous waste)) Business SIC classification: DRYCLEANING PLANTS, EXCEPT RUG CLEANING Business NAICS classification: DRYCLEANING AND LAUNDRY SERVICES (EXCEPT COIN-OPERATED). Organizations: P & A DRY CLEANERS (LEGALLY RESPONSIBLE PARTY)
, I & O DRYCLEANERS INC (LEGALLY RESPONSIBLE PARTY)
Alternative names: P&A CLEANERS, P & A DRY CLEANERS
J & J CLEANERS (1480 AMSTERDAM AVENUE in NEW YORK, NY)
AIR MINOR (AIRS/AFS) STATE MASTER (New York facility tracking) - HAZARDOUS WASTE PROGRAM (Resource Conservation and Recovery Act (tracking hazardous waste)) Business SIC classification: DRYCLEANING PLANTS, EXCEPT RUG CLEANING Business NAICS classification: DRYCLEANING AND LAUNDRY SERVICES (EXCEPT COIN-OPERATED). Organizations: IRMA PINEYRO (CONTACT/OWNER)
Alternative names: LA ESTRELLA CLEANERS
610 WEST 141ST STREET BUILDING (610 WEST 141 STREET in NEW YORK CITY, NY)
AIR SYNTHETIC MINOR (AIRS/AFS) STATE MASTER (New York facility tracking) - AIR PROGRAM Business SIC classification: OPERATORS OF APARTMENT BUILDINGS Business NAICS classification: LESSORS OF RESIDENTIAL BUILDINGS AND DWELLINGS. Organizations: WIMBLEDON PROPERTIES CORP (LEGALLY RESPONSIBLE PARTY)
Alternative names: WIMBLEDON PROPERTIES CORPORATION
A. PHILIP RANDOLPH CAMPUS HIGH SCHOOL (433 W 135TH ST. in NEW YORK, NY)
(National Center for Education Statistics) - STATE ID-317800010540 Organizations: NEW YORK CITY PUBLIC SCHOOLS (SCHOOL DISTRICT)
Alternative names: A. PHILIP RANDOLPH CAMPUS HS
A Z FRENCH DRY CLEANERS (3346 BROADWAY in NEW YORK CITY, NY)
(Resource Conservation and Recovery Act (tracking hazardous waste)) Alternative names: A & Z DRY CLEANERS
CON EDISON - VS 5606 (554 RIVERSIDE DRIVE in NEW YORK, NY)
Large Quantity Generators, more that 1000 kg of hazardous waste/month (Resource Conservation and Recovery Act (tracking hazardous waste)) Organizations: CONSOLIDATED EDISON COMPANY OF NY, INC. (CONTACT/OPERATOR)
CITY COLLEGE OF NEW YORK - SCHIFF HOUSE (160 CONVENT AVE in NEW YORK, NY)
Large Quantity Generators, more that 1000 kg of hazardous waste/month (Resource Conservation and Recovery Act (tracking hazardous waste)) Organizations: CITY UNIVERSITY OF NEW YORK (CONTACT/OPERATOR)
CON ED - V 1376 (W 145TH ST & RIVERSIDE DR in NEW YORK, NY)
HAZARDOUS WASTE BIENNIAL REPORTER (Resource Conservation and Recovery Act (tracking hazardous waste)) (Resource Conservation and Recovery Act (tracking hazardous waste))
CON ED - V 3015 (U 145TH ST & RIVERSIDE DR in NEW YORK, NY)
HAZARDOUS WASTE BIENNIAL REPORTER (Resource Conservation and Recovery Act (tracking hazardous waste)) (Resource Conservation and Recovery Act (tracking hazardous waste))
CON ED - V 3306 (545 W 114 ST in NEW YORK, NY)
HAZARDOUS WASTE BIENNIAL REPORTER (Resource Conservation and Recovery Act (tracking hazardous waste)) (Resource Conservation and Recovery Act (tracking hazardous waste))
CON ED-MH 2177 (S/S W 135 ST 64' W/O LENOX AVE in MANHATTAN, NY)
HAZARDOUS WASTE BIENNIAL REPORTER (Resource Conservation and Recovery Act (tracking hazardous waste)) (Resource Conservation and Recovery Act (tracking hazardous waste))
532 WEST 143RD STREET - FRIEDMAN MGMT (532 W 143RD ST APT 51 in NEW YORK, NY)
(Resource Conservation and Recovery Act (tracking hazardous waste))
Housing units lacking complete plumbing facilities: 1.3% Housing units lacking complete kitchen facilities: 2.5%
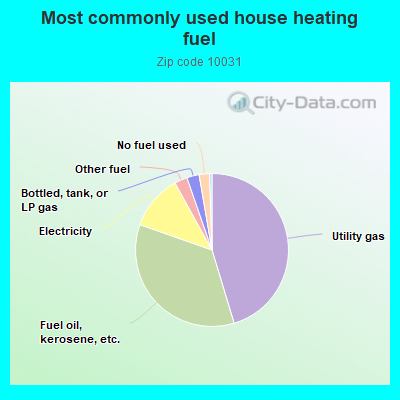
45.3%Utility gas
35.0%Fuel oil, kerosene, etc.
11.6%Electricity
2.7%Other fuel
2.6%Bottled, tank, or LP gas
2.2%No fuel used
0.5%Coal or coke
Population in 1990: 55,989. Population change in the 1990s: +4,232 (+7.6%).
Place of birth for U.S.-born residents:
This state: 23,644
Northeast: 3,085
Midwest: 1,615
South: 4,897
West: 2,568
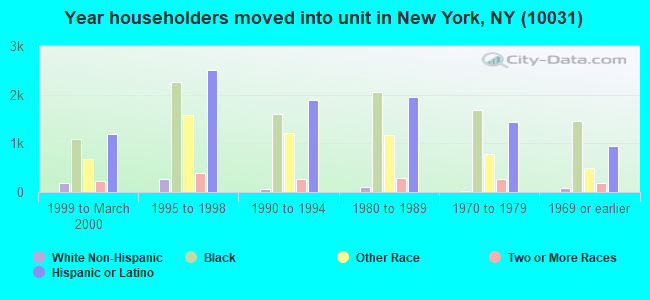
71% of the 10031 zip code residents lived in the same house 5 years ago. Out of people who lived in different houses, 60% lived in this county. Out of people who lived in different counties, 50% lived in New York.
88% of the 10031 zip code residents lived in the same house 1 year ago. Out of people who lived in different houses, 42% moved from this county. Out of people who lived in different houses, 25% moved from different county within same state. Out of people who lived in different houses, 17% moved from different state. Out of people who lived in different houses, 17% moved from abroad.
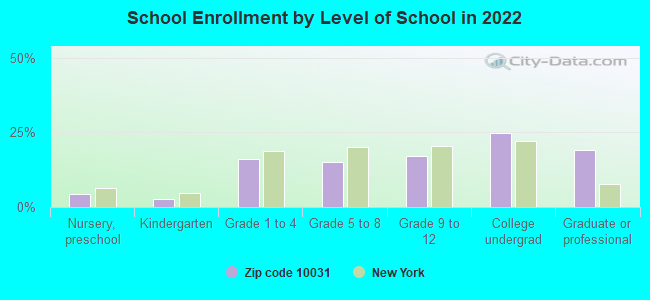
Private vs. public school enrollment:
Students in private schools in grades 1 to 8 (elementary and middle school): 346
Here:
9.2%
New York:
15.6%
Students in private schools in grades 9 to 12 (high school): 185
Here:
8.9%
New York:
15.0%
Students in private undergraduate colleges: 1,060
Here:
35.3%
New York:
39.2%
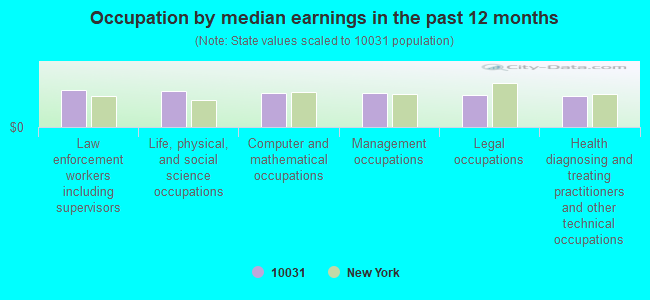
Occupation by median earnings in the past 12 months ($)
91,655Law enforcement workers including supervisors
89,553Life, physical, and social science occupations
84,422Computer and mathematical occupations
84,140Management occupations
80,307Legal occupations
76,912Health diagnosing and treating practitioners and other technical occupations
Top industries in this zip code by the number of employees in 2005:
Professional, Scientific, and Technical Services: Research and Development in the Physical, Engineering, and Life Sciences (500-999 employees: 1 establishment)
Real Estate and Rental and Leasing: Lessors of Residential Buildings and Dwellings (50-99: 1, 10-19: 5, 5-9: 4, 1-4: 95)
2007 - 2018 National Fire Incident Reporting System (NFIRS) incidents
According to the data from the years 2007 - 2018 the average number of fire incidents per year is 310. The highest number of reported fires - 390 took place in 2010, and the least - 274 in 2007. The data has a growing trend.
When looking into fire subcategories, the most reports belonged to: Structure Fires (82.0%), and Outside Fires (12.7%).
Fire incident types reported to NFIRS in Zip Code 10031


 Nearest zip codes: 10030, 10027, 10039, 10032, 10037, 10115.


 According to the data from the years 2007 - 2018 the average number of fire incidents per year is 310. The highest number of reported fires - 390 took place in 2010, and the least - 274 in 2007. The data has a growing trend.
 When looking into fire subcategories, the most reports belonged to: Structure Fires (82.0%), and Outside Fires (12.7%).