Estimated zip code population in 2022: 59,520 Zip code population in 2010: 57,331 Zip code population in 2000: 63,842
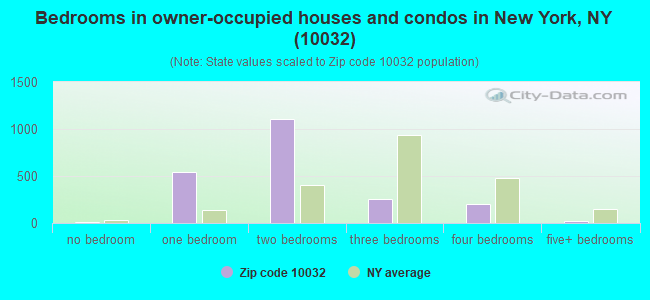
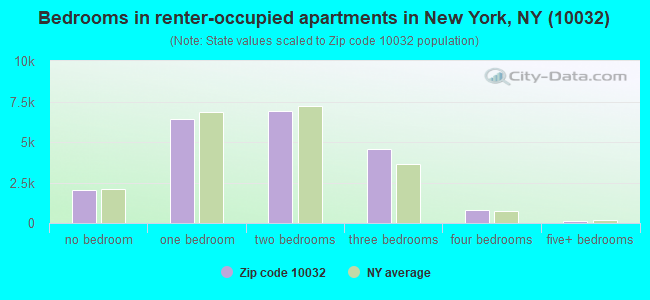
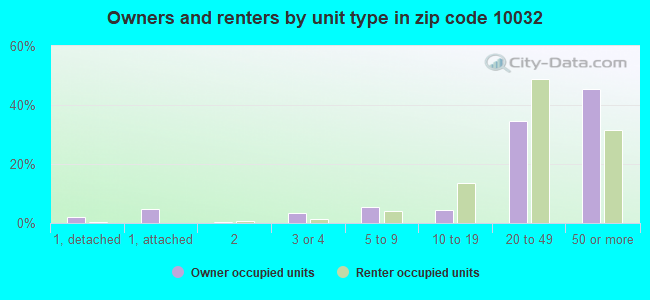
Houses and condos: 24,419 Renter-occupied apartments: 20,758
% of renters here:
91%
State:
46%
March 2022 cost of living index in zip code 10032: 153.3 (very high, U.S. average is 100)
Land area: 0.7 sq. mi. Water area: 0.0 sq. mi.
Population density: 90,529 people per square mile
(very high).
OSM Map
General Map
Google Map
MSN Map
OSM Map
General Map
Google Map
MSN Map
OSM Map
General Map
Google Map
MSN Map
OSM Map
General Map
Google Map
MSN Map
Please wait while loading the map...
Real estate property taxes paid for housing units in 2022:
This zip code:
0.8% ($4,681)
New York:
1.5% ($6,180)
Median real estate property taxes paid for housing units with mortgages in 2022: $6,160 (0.7%) Median real estate property taxes paid for housing units with no mortgage in 2022: $2,275 (4.5%)
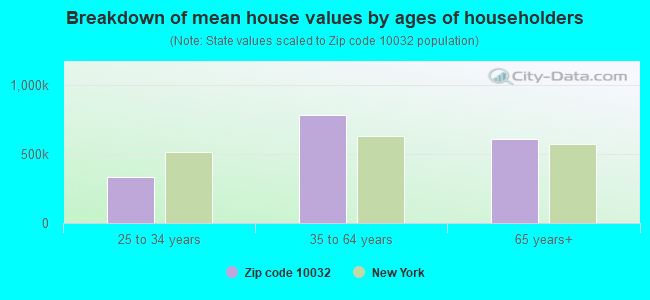
Estimated median house/condo value in 2022: $618,165
10032:
$618,165
New York:
$400,400
According to our research of New York and other state lists, there were 44 registered sex offenders living in 10032 zip code as of April 27, 2024. The ratio of all residents to sex offenders in zip code 10032 is 1,457 to 1. The ratio of registered sex offenders to all residents in this zip code is lower than the state average.
Median resident age:
This zip code:
38.0 years
New York median age:
40.0 years
Average household size:
This zip code:
2.5 people
New York:
2.5 people
Averages for the 2020 tax year for zip code 10032, filed in 2021:
Average Adjusted Gross Income (AGI) in 2020: $42,104 (Individual Income Tax Returns)
Here:
$42,104
State:
$90,930
Salary/wage: $42,133 (reported on 77.4% of returns)
Here:
$42,133
State:
$72,104
(% of AGI for various income ranges: 911.4% for AGIs below $25k, 3382.1% for AGIs $25k-50k, 6756.3% for AGIs $50k-75k, 10584.4% for AGIs $75k-100k, 18762.4% for AGIs $100k-200k, 78999.2% for AGIs over 200k)
Taxable interest for individuals: $513 (reported on 15.3% of returns)
This zip code:
$513
New York:
$3,075
(% of AGI for various income ranges: 4.2% for AGIs below $25k, 5.2% for AGIs $25k-50k, 8.4% for AGIs $50k-75k, 26.0% for AGIs $75k-100k, 46.5% for AGIs $100k-200k, 403.1% for AGIs over 200k)
Ordinary dividends: $2,711 (reported on 8.2% of returns)
Here:
$2,711
State:
$11,095
(% of AGI for various income ranges: 5.8% for AGIs below $25k, 9.9% for AGIs $25k-50k, 20.9% for AGIs $50k-75k, 66.0% for AGIs $75k-100k, 182.9% for AGIs $100k-200k, 1544.6% for AGIs over 200k)
Net capital gain/loss in AGI: +$8,134 (reported on 8.4% of returns)
Here:
+$8,134
State:
+$44,925
(% of AGI for various income ranges: 2.3% for AGIs below $25k, 12.1% for AGIs $25k-50k, 28.2% for AGIs $50k-75k, 82.1% for AGIs $75k-100k, 268.2% for AGIs $100k-200k, 10950.8% for AGIs over 200k)
Profit/loss from business: +$6,767 (reported on 21.1% of returns)
Here:
+$6,767
State:
+$14,940
(% of AGI for various income ranges: 203.6% for AGIs below $25k, 99.9% for AGIs $25k-50k, 124.2% for AGIs $50k-75k, 283.3% for AGIs $75k-100k, 585.0% for AGIs $100k-200k, 3605.4% for AGIs over 200k)
Taxable individual retirement arrangement distribution: $14,402 (reported on 1.7% of returns)
10032:
$14,402
New York:
$19,609
(% of AGI for various income ranges: 8.4% for AGIs below $25k, 13.9% for AGIs $25k-50k, 32.6% for AGIs $50k-75k, 72.1% for AGIs $75k-100k, 229.2% for AGIs $100k-200k, 1080.8% for AGIs over 200k)
Self-employed (Keogh) retirement plans: $21,989 (reported on 0.3% of returns)
10032:
$21,989
New York:
$32,497
(% of AGI for various income ranges: 11.9% for AGIs $50k-75k, 44.3% for AGIs $100k-200k, 886.9% for AGIs over 200k)
Total itemized deductions: $26,511 (reported on 3.3% of returns)
Here:
$26,511
State:
$39,326
(% of AGI for various income ranges: 11.9% for AGIs below $25k, 31.7% for AGIs $25k-50k, 118.0% for AGIs $50k-75k, 349.8% for AGIs $75k-100k, 732.9% for AGIs $100k-200k, 5318.5% for AGIs over 200k)
Charity contributions: $7,673 (reported on 2.6% of returns)
Here:
$7,673
State:
$15,420
(% of AGI for various income ranges: 0.7% for AGIs below $25k, 3.7% for AGIs $25k-50k, 21.2% for AGIs $50k-75k, 75.6% for AGIs $75k-100k, 183.7% for AGIs $100k-200k, 1502.3% for AGIs over 200k)
Taxes paid: $8,636 (reported on 3.3% of returns)
10032:
$8,636
State:
$9,183
(% of AGI for various income ranges: 2.1% for AGIs below $25k, 10.2% for AGIs $25k-50k, 41.1% for AGIs $50k-75k, 122.4% for AGIs $75k-100k, 278.5% for AGIs $100k-200k, 1327.7% for AGIs over 200k)
Earned income credit: $2,007 (reported on 21.7% of returns)
Here:
$2,007
State:
$2,138
(% of AGI for various income ranges: 102.0% for AGIs below $25k, 62.2% for AGIs $25k-50k, 0.3% for AGIs $50k-75k)
Percentage of individuals using paid preparers for their 2020 taxes: 94.4%
Here:
94%
State:
95%
(% for various income ranges: 92.6% for AGIs below $25k, 95.8% for AGIs $25k-50k, 95.8% for AGIs $50k-75k, 94.5% for AGIs $75k-100k, 95.9% for AGIs $100k-200k, 95.0% for AGIs over 200k)
Averages for the 2012 tax year for zip code 10032, filed in 2013:
Average Adjusted Gross Income (AGI) in 2012: $31,728 (Individual Income Tax Returns)
Here:
$31,728
State:
$77,088
Salary/wage: $33,381 (reported on 81.5% of returns)
Here:
$33,381
State:
$60,593
(% of AGI for various income ranges: 74.1% for AGIs below $25k, 92.4% for AGIs $25k-50k, 91.5% for AGIs $50k-75k, 89.4% for AGIs $75k-100k, 84.8% for AGIs $100k-200k, 76.3% for AGIs over 200k)
Taxable interest for individuals: $532 (reported on 14.6% of returns)
This zip code:
$532
New York:
$3,125
(% of AGI for various income ranges: 0.2% for AGIs below $25k, 0.2% for AGIs $25k-50k, 0.2% for AGIs $50k-75k, 0.3% for AGIs $75k-100k, 0.4% for AGIs $100k-200k, 0.5% for AGIs over 200k)
Ordinary dividends: $2,720 (reported on 5.3% of returns)
Here:
$2,720
State:
$10,299
(% of AGI for various income ranges: 0.4% for AGIs below $25k, 0.3% for AGIs $25k-50k, 0.3% for AGIs $50k-75k, 0.4% for AGIs $75k-100k, 0.9% for AGIs $100k-200k, 1.2% for AGIs over 200k)
Net capital gain/loss in AGI: +$4,296 (reported on 4.3% of returns)
Here:
+$4,296
State:
+$42,474
(% of AGI for various income ranges: 0.1% for AGIs $25k-50k, 0.7% for AGIs $100k-200k, 6.4% for AGIs over 200k)
Profit/loss from business: +$8,095 (reported on 21.1% of returns)
Here:
+$8,095
State:
+$16,168
(% of AGI for various income ranges: 17.4% for AGIs below $25k, 1.6% for AGIs $25k-50k, 1.4% for AGIs $50k-75k, 2.0% for AGIs $75k-100k, 2.3% for AGIs $100k-200k, 5.5% for AGIs over 200k)
Taxable individual retirement arrangement distribution: $12,528 (reported on 1.9% of returns)
10032:
$12,528
New York:
$17,621
(% of AGI for various income ranges: 0.4% for AGIs below $25k, 0.5% for AGIs $25k-50k, 0.7% for AGIs $50k-75k, 0.8% for AGIs $75k-100k, 1.6% for AGIs $100k-200k, 1.6% for AGIs over 200k)
Self-employment retirement plans: $15,083 (reported on 0.2% of returns)
10032:
$15,083
New York:
$27,330
Total itemized deductions: $18,206 (25% of AGI, reported on 18.8% of returns)
Here:
$18,206
State:
$34,985
Here:
25.0% of AGI
State:
21.3% of AGI
(% of AGI for various income ranges: 3.5% for AGIs below $25k, 9.6% for AGIs $25k-50k, 12.1% for AGIs $50k-75k, 14.4% for AGIs $75k-100k, 16.4% for AGIs $100k-200k, 18.7% for AGIs over 200k)
Charity contributions: $2,614 (reported on 14.6% of returns)
Here:
$2,614
State:
$5,572
(% of AGI for various income ranges: 0.2% for AGIs below $25k, 1.1% for AGIs $25k-50k, 1.5% for AGIs $50k-75k, 1.7% for AGIs $75k-100k, 1.9% for AGIs $100k-200k, 2.0% for AGIs over 200k)
Taxes paid: $6,822 (reported on 18.7% of returns)
10032:
$6,822
State:
$18,656
(% of AGI for various income ranges: 0.5% for AGIs below $25k, 1.9% for AGIs $25k-50k, 4.2% for AGIs $50k-75k, 6.6% for AGIs $75k-100k, 8.4% for AGIs $100k-200k, 10.6% for AGIs over 200k)
Earned income credit: $2,357 (reported on 34.8% of returns)
Here:
$2,357
State:
$2,230
(% of AGI for various income ranges: 10.6% for AGIs below $25k, 1.0% for AGIs $25k-50k)
Percentage of individuals using paid preparers for their 2012 taxes: 69.8%
Here:
70%
State:
66%
(% for various income ranges: 71.3% for AGIs below $25k, 68.1% for AGIs $25k-50k, 66.3% for AGIs $50k-75k, 67.5% for AGIs $75k-100k, 69.1% for AGIs $100k-200k, 81.0% for AGIs over 200k)
Averages for the 2004 tax year for zip code 10032, filed in 2005:
Average Adjusted Gross Income (AGI) in 2004: $24,850 (Individual Income Tax Returns)
Here:
$24,850
State:
$59,519
Salary/wage: $26,481 (reported on 81.6% of returns)
Here:
$26,481
State:
$50,673
(% of AGI for various income ranges: 57.8% for AGIs below $10k, 81.9% for AGIs $10k-25k, 94.5% for AGIs $25k-50k, 91.3% for AGIs $50k-75k, 89.0% for AGIs $75k-100k, 81.1% for AGIs over 100k)
Taxable interest for individuals: $571 (reported on 18.3% of returns)
This zip code:
$571
New York:
$2,377
(% of AGI for various income ranges: 0.8% for AGIs below $10k, 0.4% for AGIs $10k-25k, 0.3% for AGIs $25k-50k, 0.4% for AGIs $50k-75k, 0.6% for AGIs $75k-100k, 0.7% for AGIs over 100k)
Taxable dividends: $1,781 (reported on 5.6% of returns)
Here:
$1,781
State:
$5,394
(% of AGI for various income ranges: 0.5% for AGIs below $10k, 0.2% for AGIs $10k-25k, 0.2% for AGIs $25k-50k, 0.3% for AGIs $50k-75k, 0.6% for AGIs $75k-100k, 1.4% for AGIs over 100k)
Net capital gain/loss: +$2,324 (reported on 4.2% of returns)
Here:
+$2,324
State:
+$23,581
(% of AGI for various income ranges: -0.2% for AGIs below $10k, -0.1% for AGIs $10k-25k, 0.1% for AGIs $25k-50k, 0.2% for AGIs $50k-75k, 0.6% for AGIs $75k-100k, 3.1% for AGIs over 100k)
Profit/loss from business: +$7,050 (reported on 23.4% of returns)
Here:
+$7,050
State:
+$13,809
(% of AGI for various income ranges: 45.4% for AGIs below $10k, 12.1% for AGIs $10k-25k, 1.1% for AGIs $25k-50k, 0.8% for AGIs $50k-75k, 1.3% for AGIs $75k-100k, 2.9% for AGIs over 100k)
IRA payment deduction: $2,288 (reported on 1.1% of returns)
10032:
$2,288
New York:
$3,115
(% of AGI for various income ranges: 0.1% for AGIs below $10k, 0.1% for AGIs $10k-25k, 0.1% for AGIs $25k-50k, 0.1% for AGIs $50k-75k, 0.1% for AGIs $75k-100k, 0.1% for AGIs over 100k)
Self-employed pension: $9,034 (reported on 0.2% of returns)
Here:
$9,034
New York:
$19,016
(% of AGI for various income ranges: 0.0% for AGIs $10k-25k, 0.0% for AGIs $25k-50k, 0.1% for AGIs $50k-75k, 0.5% for AGIs over 100k)
Total itemized deductions: $14,907 (28% of AGI, reported on 18.7% of returns)
Here:
$14,907
State:
$25,864
Here:
27.7% of AGI
State:
21.9% of AGI
(% of AGI for various income ranges: 1.2% for AGIs below $10k, 4.3% for AGIs $10k-25k, 12.1% for AGIs $25k-50k, 16.1% for AGIs $50k-75k, 17.1% for AGIs $75k-100k, 18.0% for AGIs over 100k)
Charity contributions deductions: $2,667 (5% of AGI, reported on 16.3% of returns)
Here:
$2,667
State:
$4,439
Here:
4.8% of AGI
State:
3.6% of AGI
(% of AGI for various income ranges: 0.1% for AGIs below $10k, 0.6% for AGIs $10k-25k, 1.9% for AGIs $25k-50k, 2.8% for AGIs $50k-75k, 2.6% for AGIs $75k-100k, 2.5% for AGIs over 100k)
Total tax: $2,968 (reported on 66.2% of returns)
10032:
$2,968
State:
$11,730
(% of AGI for various income ranges: 7.0% for AGIs below $10k, 3.8% for AGIs $10k-25k, 6.0% for AGIs $25k-50k, 10.1% for AGIs $50k-75k, 12.7% for AGIs $75k-100k, 17.9% for AGIs over 100k)
Earned income credit: $2,021 (reported on 42.3% of returns)
Here:
$2,021
State:
$1,757
Percentage of individuals using paid preparers for their 2004 taxes: 73.7%
Here:
74%
State:
67%
(% for various income ranges: 72.4% for AGIs below $10k, 78.2% for AGIs $10k-25k, 70.5% for AGIs $25k-50k, 68.3% for AGIs $50k-75k, 70.9% for AGIs $75k-100k, 75.1% for AGIs over 100k)
Likely homosexual households (counted as self-reported same-sex unmarried-partner households)
Lesbian couples: 0.1% of all households
Gay men: 0.9% of all households
Household received Food Stamps/SNAP in the past 12 months: 7,351 Household did not receive Food Stamps/SNAP in the past 12 months: 15,858
Women who had a birth in the past 12 months: 430 (291 now married, 139 unmarried) Women who did not have a birth in the past 12 months: 14,856 (3,600 now married, 11,343 unmarried)
Housing units in zip code 10032 with a mortgage: 1,192 (122 second mortgage, 90 both second mortgage and home equity loan) Median monthly owner costs for units with a mortgage: $3,050 Median monthly owner costs for units without a mortgage: $376
Residents with income below the poverty level in 2022:
This zip code:
20.7%
Whole state:
14.3%
Residents with income below 50% of the poverty level in 2022:
This zip code:
11.2%
Whole state:
6.8%
Median number of rooms in houses and condos:
Here:
4.1
State:
6.3
Median number of rooms in apartments:
Here:
3.9
State:
3.8
Notable locations in this zip code not listed on our city pages
Notable locations in zip code 10032: National Institute of Arts and Letters (A), American Numismatic Society (B), Hispanic Society of America (C), New York Ladder Company 34 (D), Fire Department New York Engine 84 Ladder 34 (E), Fire Department New York Engine 67 (F), Alumni Auditorium (G), Washington Heights Branch New York Public Library (H), Morris - Jumel Mansion (I), Lawrence C Kolb Research Building (J), Herbert Irving Pavilion (K), Harkness Pavilion (L), Georgian Residence Building (M), Eye Institute Research Laboratories (N), Bard Haven Towers (O), Bard Hall (P), Augustus C Long Library (Q), Thirtythird Precinct Station House (R), Julius and Armand Hammer Health Sciences Center (S). Display/hide their locations on the map
Churches in zip code 10032 include: First Spanish Presbyterian Church (A), Convent of the Church of the Incarnation (B), Broadway Temple-Washington Heights United Methodist Church (C), Church of the Intercession (D), Church of Our Lady of Esperanza (E), Pauline A Hartford Memorial Chapel (F). Display/hide their locations on the map
Parks in zip code 10032 include: McKenna Triangle (1), Audubon Terrace Historic District (2), Jumel Terrace Historic District (3), Audubon Playground (4), Roger Morris Park (5), Morris-Jumel Ecological Education Garden (6), Orville And Wilbur Playground (7), Harris Garden (8). Display/hide their locations on the map
Tourist attractions (not listed on the city page) : AMER Numismatic Society (Museums; 617 West 155th Street Floor 1), Children's Museum of the Native AMER (Cultural Attractions- Events- & Facilities; 550 West 155th Street).
2,856 married couples with children.
2,812 single-parent households (494 men, 2,318 women).
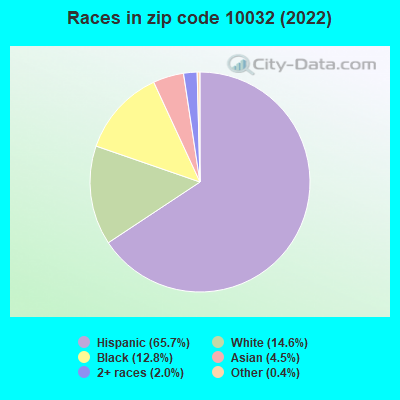
34.3% of residents of 10032 zip code speak English at home.
57.4% of residents speak Spanish at home (48% very well, 12% well, 21% not well, 19% not at all).
4.4% of residents speak other Indo-European language at home (77% very well, 14% well, 2% not well, 7% not at all).
3.1% of residents speak Asian or Pacific Island language at home (75% very well, 19% well, 3% not well, 3% not at all).
0.4% of residents speak other language at home (90% very well, 10% well).
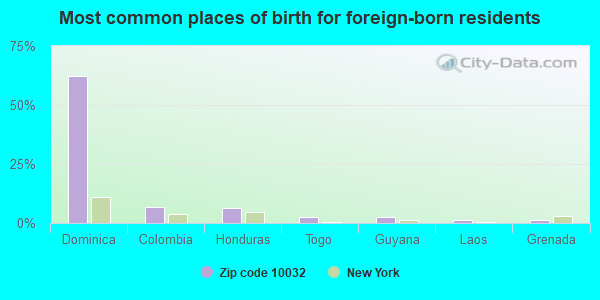
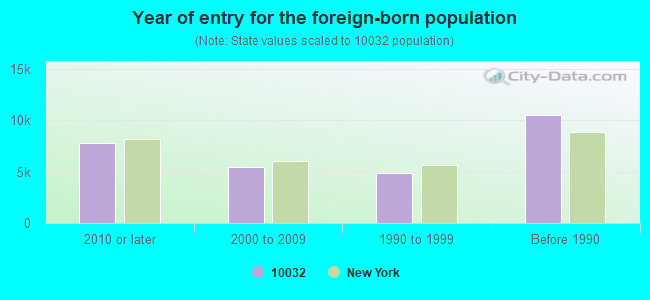
Foreign born population: 27,308 (45.9%) (57.5% of them are naturalized citizens)
Major facilities with environmental interests located in this zip code:
COLUMBIA UNIVERSITY HEALTH SCIENCES (630 WEST 168TH STREET in NEW YORK, NY)
HAZARDOUS WASTE BIENNIAL REPORTER (Resource Conservation and Recovery Act (tracking hazardous waste)) - ICIS-, ENFORCEMENT/COMPLIANCE ACTIVITY Large Quantity Generators, more that 1000 kg of hazardous waste/month (Resource Conservation and Recovery Act (tracking hazardous waste)) - notification - ICIS-, ENFORCEMENT/COMPLIANCE ACTIVITY Organizations: ROBERT LEMIEUX (CONTACT/OPERATOR)
Alternative names: COLUMBIA UNIVERSITY - PHYS & SURG
ANDRES CLEANERS (1988 AMSTERDAM AVE in NEW YORK, NY)
AIR MINOR (AIRS/AFS) STATE MASTER (New York facility tracking) - AIR PROGRAM (Resource Conservation and Recovery Act (tracking hazardous waste)) Business SIC classification: DRYCLEANING PLANTS, EXCEPT RUG CLEANING Business NAICS classification: DRYCLEANING AND LAUNDRY SERVICES (EXCEPT COIN-OPERATED). Alternative names: A & R CLEANERS
HARKNESS BUILDING NYPH (180 FORT WASHINGTON AVENUE in NEW YORK, NY)
(Integrated Compliance Information System) - ICIS-02-2005-0805, ENFORCEMENT/COMPLIANCE ACTIVITY FORMAL ENFORCEMENT ACTION (Integrated Compliance Information System) - ICIS-02-2005-0805, ENFORCEMENT/COMPLIANCE ACTIVITY
3921 BROADWAY CLEANERS (3921 BROADWAY in NEW YORK, NY)
AIR MINOR (AIRS/AFS) STATE MASTER (New York facility tracking) - AIR PROGRAM Conditionally Exempt Small Quantity Generators, less than 100 kg/month of hazardous waste (Resource Conservation and Recovery Act (tracking hazardous waste)) - notification Business SIC classification: DRYCLEANING PLANTS, EXCEPT RUG CLEANING Business NAICS classification: DRYCLEANING AND LAUNDRY SERVICES (EXCEPT COIN-OPERATED). Organizations: 3921 BROADWAY CLEANERS INC (CONTACT/OWNER)
HERMAN S AUTO BODY INC (655 EDGECOMBE AVE in NEW YORK, NY)
STATE MASTER (New York facility tracking) - AIR PROGRAM (Resource Conservation and Recovery Act (tracking hazardous waste)) Organizations: SAL COCO (LEGALLY RESPONSIBLE PARTY)
Alternative names: HERMANS AUTO BODY
260 FORT WASHINGTON AVENUE BUILDING (260 FORT WASHINGTON AVENUE in NEW YORK CITY, NY)
AIR SYNTHETIC MINOR (AIRS/AFS) STATE MASTER (New York facility tracking) - AIR PROGRAM Business SIC classification: OPERATORS OF DWELLINGS OTHER THAN APARTMENT BUILDINGS Business NAICS classification: LESSORS OF RESIDENTIAL BUILDINGS AND DWELLINGS. Organizations: KAY MANAGEMENT GROUP (LEGALLY RESPONSIBLE PARTY)
, SHALYH S REALTY INC (LEGALLY RESPONSIBLE PARTY)
AMSTERDAM 2201 ASSOCIATES (2201 AMSTERDAM AVENUE in NEW YORK CITY, NY)
AIR SYNTHETIC MINOR (AIRS/AFS) STATE MASTER (New York facility tracking) - AIR PROGRAM Business SIC classification: OPERATORS OF APARTMENT BUILDINGS Business NAICS classification: LESSORS OF RESIDENTIAL BUILDINGS AND DWELLINGS.
COLUMBIA UNIVERSITY - HHSC (701 W 168TH ST in NEW YORK, NY)
Small Quantity Generators, between 100 kg and 1000 kg of hazardous waste/month (Resource Conservation and Recovery Act (tracking hazardous waste)) - notification - ICIS-, ENFORCEMENT/COMPLIANCE ACTIVITY Organizations: TRUSTEES OF COLUMBIA UNIVERSITY (CONTACT/OPERATOR)
135-143 HAVEN AVENUE ASSOCIATES LLC (143 HAVEN AVE in NEW YORK, NY)
FORMAL ENFORCEMENT ACTION (Integrated Compliance Information System) - ICIS-02-2006-9266, ENFORCEMENT/COMPLIANCE ACTIVITY COMPLIANCE ACTIVITY (Tracking inspections of insecticide, fungicide, and rodenticide, and toxic substances) Business SIC classification: OPERATORS OF APARTMENT BUILDINGS
IS 90 MIRABEL SISTERS SCHOOL ( in NEW YORK, NY)
(National Center for Education Statistics) - STATE ID-310600010090 Organizations: NEW YORK CITY PUBLIC SCHOOLS (SCHOOL DISTRICT)
IS 164 E. W. STITT IS ( in NEW YORK, NY)
(National Center for Education Statistics) - STATE ID-310600010164 Organizations: NEW YORK CITY PUBLIC SCHOOLS (SCHOOL DISTRICT)
COLUMBIA UNIVERSITY - AUDUBON (1150 ST NICHOLAS AVE in NEW YORK, NY)
Small Quantity Generators, between 100 kg and 1000 kg of hazardous waste/month (Resource Conservation and Recovery Act (tracking hazardous waste)) - notification - ICIS-, ENFORCEMENT/COMPLIANCE ACTIVITY Organizations: TRUSTEES OF COLUMBIA UNIVERSITY (CONTACT/OWNER)
COLUMBIA PRESBYTERIAN MEDICAL CENTER NYPH (160 FORT WASHINGTON AVENUE in NEW YORK, NY)
(Integrated Compliance Information System) - ICIS-02-2005-0805, ENFORCEMENT/COMPLIANCE ACTIVITY
Housing units lacking complete plumbing facilities: 1.5% Housing units lacking complete kitchen facilities: 2.2%
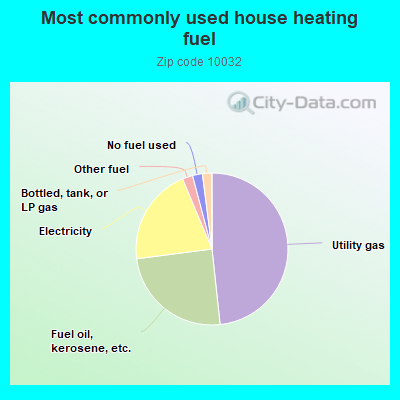
48.2%Utility gas
24.6%Fuel oil, kerosene, etc.
20.7%Electricity
2.2%Other fuel
2.1%No fuel used
1.9%Bottled, tank, or LP gas
Population in 1990: 61,332. Population change in the 1990s: +2,510 (+4.1%).
Place of birth for U.S.-born residents:
This state: 21,462
Northeast: 2,063
Midwest: 1,540
South: 3,851
West: 2,128
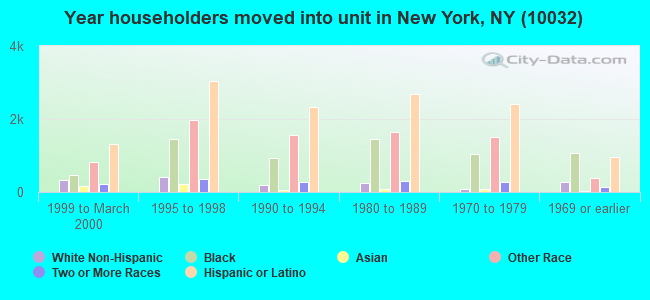
69% of the 10032 zip code residents lived in the same house 5 years ago. Out of people who lived in different houses, 63% lived in this county. Out of people who lived in different counties, 50% lived in New York.
87% of the 10032 zip code residents lived in the same house 1 year ago. Out of people who lived in different houses, 52% moved from this county. Out of people who lived in different houses, 22% moved from different county within same state. Out of people who lived in different houses, 20% moved from different state. Out of people who lived in different houses, 8% moved from abroad.
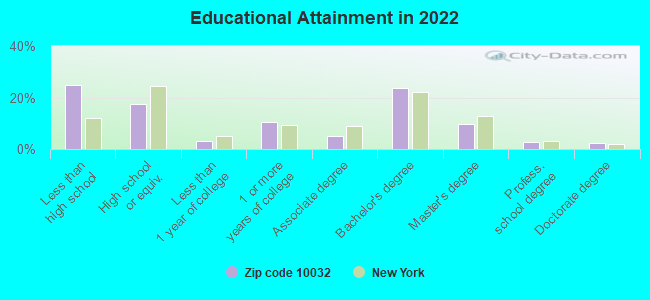
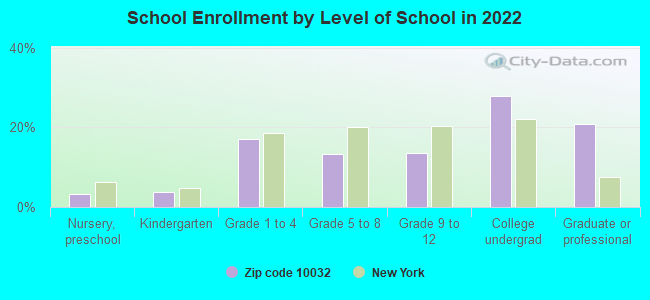
Private vs. public school enrollment:
Students in private schools in grades 1 to 8 (elementary and middle school): 267
Here:
6.9%
New York:
15.6%
Students in private schools in grades 9 to 12 (high school): 79
Here:
4.6%
New York:
15.0%
Students in private undergraduate colleges: 1,117
Here:
31.8%
New York:
39.2%
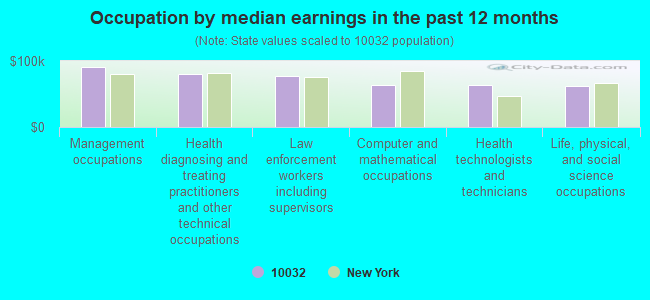
Occupation by median earnings in the past 12 months ($)
90,221Management occupations
80,593Health diagnosing and treating practitioners and other technical occupations
77,821Law enforcement workers including supervisors
63,864Computer and mathematical occupations
62,972Health technologists and technicians
61,666Life, physical, and social science occupations
Companies with federal contracts located in this zip code (NEW YORK, NY):
THE TRUSTEES OF COLUMBIA UNIVE (650 W 168TH ST) : $2,513,042 in 20 contractsfrom 2000 to 2006
Contracts for Other Research and Development -- Basic Research (R&D), Tuition, Registration, and Membership Fees, Educational Services, Training Aids by Army, Air Force, Navy, Department of Veterans Affairs, and others Signed by year:2000: $758,969; 2001: $34,888; 2002: $720,061; 2003: $259,335; 2004: $259,482; 2005: $242,089; 2006: $238,218.
Biggest contracts:
$758,969 with Army for Other Research and Development -- Basic Research (R&D). Signed on 2000-09-29. Completion date: 2003-07-28.
$426,097 with Army for Tuition, Registration, and Membership Fees. Signed on 2002-05-23. Completion date: 2002-09-30.
$223,632, same as above.Signed on 2002-10-01. Completion date: 2003-09-30.
$222,697 with Army for Educational Services. Signed on 2003-10-01. Completion date: 2004-09-30.
TRUSTEES OF COLUMBIA UNIVERSIT (630 W 168TH ST) : $191,706 in 3 contractsfrom 1999 to 2005
$87,550 with Navy for Tuition, Registration, and Membership Fees. Signed on 1999-10-01. Completion date: 1999-11-22.
$67,204 with Army for Educational Services. Signed on 2005-10-21. Completion date: 2006-09-30.
$36,952, same as above.Signed on 2005-03-11. Completion date: 2005-09-30.
howard beaton (170 WILLIAMS STREET; small business) : $91,169 in 49 contractsfrom 2004 to 2006
Contracts for Medical/Psychiatric Consultation Services, Health Services -- Basic Research (R&D), General Health Care Services by Bureau of Prisoners/Federal Prison System Signed by year:2000: $0; 2001: $0; 2002: $0; 2003: $0; 2004: $500; 2005: $58,893; 2006: $31,776.
Biggest contracts:
$7,750 with Bureau of Prisoners/Federal Prison System for Medical/Psychiatric Consultation Services. Signed on 2005-04-25. Completion date: 2005-04-25.
$4,080 with Bureau of Prisoners/Federal Prison System for Health Services -- Basic Research (R&D). Signed on 2006-03-24. Completion date: 2006-03-24.
$3,400, same as above.Signed on 2006-03-02. Completion date: 2006-03-02.
$3,000, same as above.Signed on 2006-01-24. Effective on 2006-01-20. Completion date: 2006-01-20.
INTRA-CELLULAR THERAPIES, INC (3960 BROADWAY; small business) : $69,440 in 3 contractsin 2005
$69,438 with Army for Agriculture Insect and Disease Control -- Advanced Development (R&D). Taking place in MD. Signed on 2005-11-04. Completion date: 2006-06-09.
$1, same as above.Signed on 2005-11-08. Completion date: 2006-06-09.
$1, same as above.Signed on 2005-11-17. Completion date: 2006-06-09.
Top industries in this zip code by the number of employees in 2005:
Health Care and Social Assistance: General Medical and Surgical Hospitals (over 1000 employees: 1 establishment)
Professional, Scientific, and Technical Services: Research and Development in the Physical, Engineering, and Life Sciences (500-999: 1, 100-249: 1, 20-49: 2, 10-19: 4, 1-4: 3)
Health Care and Social Assistance: Psychiatric and Substance Abuse Hospitals (250-499: 1)
2007 - 2018 National Fire Incident Reporting System (NFIRS) incidents
Based on the data from the years 2007 - 2018 the average number of fires per year is 300. The highest number of fires - 385 took place in 2008, and the least - 251 in 2011. The data has a growing trend.
When looking into fire subcategories, the most reports belonged to: Structure Fires (73.7%), and Outside Fires (19.3%).
Fire incident types reported to NFIRS in Zip Code 10032


 Nearest zip codes: 10039, 10033, 10031, 10452, 10030, 10040.


 Based on the data from the years 2007 - 2018 the average number of fires per year is 300. The highest number of fires - 385 took place in 2008, and the least - 251 in 2011. The data has a growing trend.
 When looking into fire subcategories, the most reports belonged to: Structure Fires (73.7%), and Outside Fires (19.3%).