Estimated zip code population in 2022: 77,376 Zip code population in 2010: 75,371 Zip code population in 2000: 72,138
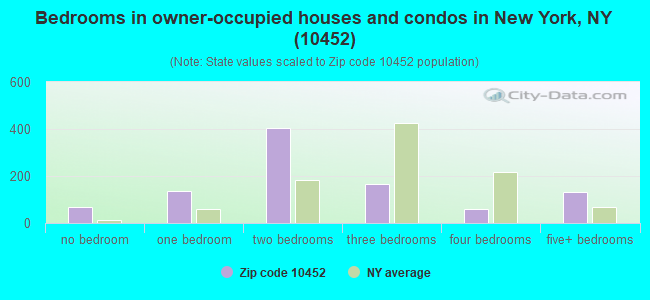
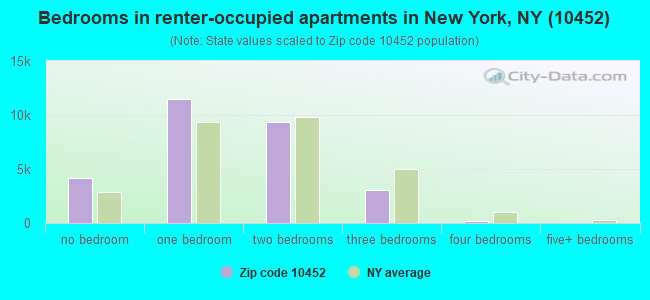
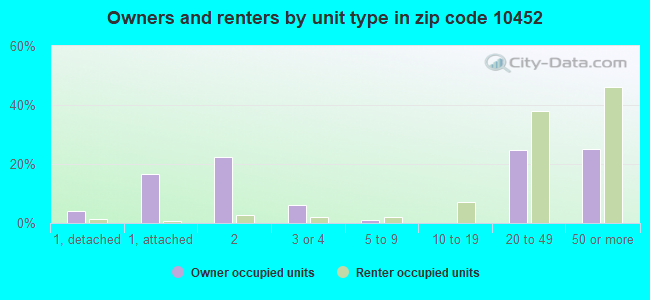
Houses and condos: 29,128 Renter-occupied apartments: 28,062
% of renters here:
97%
State:
46%
March 2022 cost of living index in zip code 10452: 156.7 (very high, U.S. average is 100)
Land area: 1.0 sq. mi. Water area: 0.0 sq. mi.
Population density: 78,585 people per square mile
(very high).
OSM Map
General Map
Google Map
MSN Map
OSM Map
General Map
Google Map
MSN Map
OSM Map
General Map
Google Map
MSN Map
OSM Map
General Map
Google Map
MSN Map
Please wait while loading the map...
Real estate property taxes paid for housing units in 2022:
This zip code:
0.6% ($2,994)
New York:
1.5% ($6,180)
Median real estate property taxes paid for housing units with mortgages in 2022: $2,591 (0.3%) Median real estate property taxes paid for housing units with no mortgage in 2022: $5,259 (0.8%)
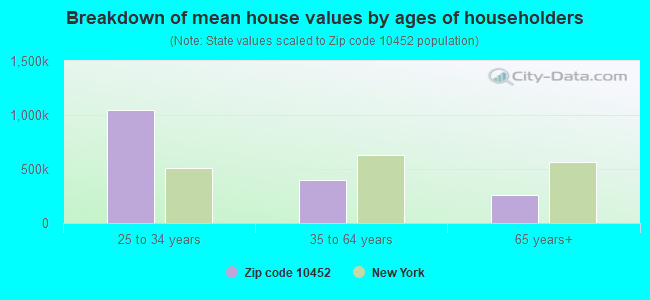
Estimated median house/condo value in 2022: $494,532
10452:
$494,532
New York:
$400,400
According to our research of New York and other state lists, there were 75 registered sex offenders living in 10452 zip code as of April 27, 2024. The ratio of all residents to sex offenders in zip code 10452 is 1,018 to 1. The ratio of registered sex offenders to all residents in this zip code is near the state average.
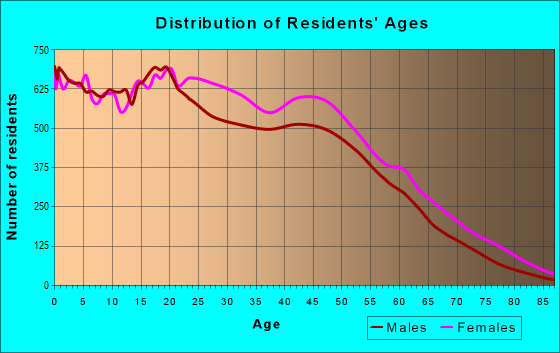
Median resident age:
This zip code:
33.7 years
New York median age:
40.0 years
Average household size:
This zip code:
2.6 people
New York:
2.5 people
Averages for the 2020 tax year for zip code 10452, filed in 2021:
Average Adjusted Gross Income (AGI) in 2020: $31,660 (Individual Income Tax Returns)
Here:
$31,660
State:
$90,930
Salary/wage: $31,558 (reported on 76.6% of returns)
Here:
$31,558
State:
$72,104
(% of AGI for various income ranges: 871.4% for AGIs below $25k, 3207.9% for AGIs $25k-50k, 6691.2% for AGIs $50k-75k, 10452.9% for AGIs $75k-100k, 16673.4% for AGIs $100k-200k, 80410.0% for AGIs over 200k)
Taxable interest for individuals: $202 (reported on 7.7% of returns)
This zip code:
$202
New York:
$3,075
(% of AGI for various income ranges: 1.2% for AGIs below $25k, 1.1% for AGIs $25k-50k, 3.3% for AGIs $50k-75k, 6.6% for AGIs $75k-100k, 15.7% for AGIs $100k-200k, 220.0% for AGIs over 200k)
Ordinary dividends: $1,173 (reported on 1.9% of returns)
Here:
$1,173
State:
$11,095
(% of AGI for various income ranges: 1.2% for AGIs below $25k, 0.9% for AGIs $25k-50k, 3.9% for AGIs $50k-75k, 6.4% for AGIs $75k-100k, 23.6% for AGIs $100k-200k, 1355.0% for AGIs over 200k)
Net capital gain/loss in AGI: +$3,138 (reported on 2.8% of returns)
Here:
+$3,138
State:
+$44,925
(% of AGI for various income ranges: 0.3% for AGIs below $25k, 0.4% for AGIs $25k-50k, 6.3% for AGIs $50k-75k, 40.5% for AGIs $75k-100k, 160.4% for AGIs $100k-200k, 8950.0% for AGIs over 200k)
Profit/loss from business: +$4,893 (reported on 21.2% of returns)
Here:
+$4,893
State:
+$14,940
(% of AGI for various income ranges: 212.3% for AGIs below $25k, 69.9% for AGIs $25k-50k, 37.5% for AGIs $50k-75k, 99.3% for AGIs $75k-100k, 316.4% for AGIs $100k-200k)
Taxable individual retirement arrangement distribution: $9,563 (reported on 0.7% of returns)
10452:
$9,563
New York:
$19,609
(% of AGI for various income ranges: 2.4% for AGIs below $25k, 5.1% for AGIs $25k-50k, 10.7% for AGIs $50k-75k, 41.1% for AGIs $75k-100k, 153.8% for AGIs $100k-200k)
Total itemized deductions: $25,682 (reported on 1.7% of returns)
Here:
$25,682
State:
$39,326
(% of AGI for various income ranges: 7.8% for AGIs below $25k, 28.0% for AGIs $25k-50k, 129.6% for AGIs $50k-75k, 250.8% for AGIs $75k-100k, 785.0% for AGIs $100k-200k, 5505.0% for AGIs over 200k)
Charity contributions: $9,330 (reported on 1.3% of returns)
Here:
$9,330
State:
$15,420
(% of AGI for various income ranges: 5.9% for AGIs $25k-50k, 35.0% for AGIs $50k-75k, 73.9% for AGIs $75k-100k, 264.8% for AGIs $100k-200k, 2175.0% for AGIs over 200k)
Taxes paid: $8,112 (reported on 1.7% of returns)
10452:
$8,112
State:
$9,183
(% of AGI for various income ranges: 1.3% for AGIs below $25k, 10.6% for AGIs $25k-50k, 37.5% for AGIs $50k-75k, 84.6% for AGIs $75k-100k, 258.0% for AGIs $100k-200k, 1610.0% for AGIs over 200k)
Earned income credit: $2,444 (reported on 34.4% of returns)
Here:
$2,444
State:
$2,138
(% of AGI for various income ranges: 160.6% for AGIs below $25k, 99.1% for AGIs $25k-50k, 0.9% for AGIs $50k-75k)
Percentage of individuals using paid preparers for their 2020 taxes: 95.0%
Here:
95%
State:
95%
(% for various income ranges: 93.2% for AGIs below $25k, 97.2% for AGIs $25k-50k, 95.8% for AGIs $50k-75k, 94.2% for AGIs $75k-100k, 95.5% for AGIs $100k-200k, 100.0% for AGIs over 200k)
Averages for the 2012 tax year for zip code 10452, filed in 2013:
Average Adjusted Gross Income (AGI) in 2012: $24,210 (Individual Income Tax Returns)
Here:
$24,210
State:
$77,088
Salary/wage: $26,004 (reported on 80.0% of returns)
Here:
$26,004
State:
$60,593
(% of AGI for various income ranges: 70.0% for AGIs below $25k, 94.5% for AGIs $25k-50k, 94.2% for AGIs $50k-75k, 91.7% for AGIs $75k-100k, 85.2% for AGIs $100k-200k)
Taxable interest for individuals: $214 (reported on 7.5% of returns)
This zip code:
$214
New York:
$3,125
(% of AGI for various income ranges: 0.1% for AGIs $100k-200k)
Ordinary dividends: $693 (reported on 1.3% of returns)
Here:
$693
State:
$10,299
(% of AGI for various income ranges: )
Profit/loss from business: +$8,498 (reported on 23.3% of returns)
Here:
+$8,498
State:
+$16,168
(% of AGI for various income ranges: 23.5% for AGIs below $25k, 1.2% for AGIs $25k-50k, 0.3% for AGIs $50k-75k, 0.7% for AGIs $75k-100k, 0.2% for AGIs $100k-200k)
Taxable individual retirement arrangement distribution: $8,261 (reported on 0.7% of returns)
10452:
$8,261
New York:
$17,621
(% of AGI for various income ranges: 0.1% for AGIs below $25k, 0.2% for AGIs $25k-50k, 0.3% for AGIs $50k-75k, 0.8% for AGIs $75k-100k)
Total itemized deductions: $16,321 (31% of AGI, reported on 14.2% of returns)
Here:
$16,321
State:
$34,985
Here:
31.4% of AGI
State:
21.3% of AGI
(% of AGI for various income ranges: 2.1% for AGIs below $25k, 10.9% for AGIs $25k-50k, 15.0% for AGIs $50k-75k, 18.2% for AGIs $75k-100k, 16.9% for AGIs $100k-200k)
Charity contributions: $2,965 (reported on 11.0% of returns)
Here:
$2,965
State:
$5,572
(% of AGI for various income ranges: 0.2% for AGIs below $25k, 1.5% for AGIs $25k-50k, 2.3% for AGIs $50k-75k, 2.8% for AGIs $75k-100k, 2.7% for AGIs $100k-200k)
Taxes paid: $4,695 (reported on 14.2% of returns)
10452:
$4,695
State:
$18,656
(% of AGI for various income ranges: 0.3% for AGIs below $25k, 2.5% for AGIs $25k-50k, 4.7% for AGIs $50k-75k, 7.2% for AGIs $75k-100k, 7.8% for AGIs $100k-200k)
Earned income credit: $2,691 (reported on 49.6% of returns)
Here:
$2,691
State:
$2,230
(% of AGI for various income ranges: 15.0% for AGIs below $25k, 1.7% for AGIs $25k-50k)
Percentage of individuals using paid preparers for their 2012 taxes: 77.2%
Here:
77%
State:
66%
(% for various income ranges: 78.2% for AGIs below $25k, 76.0% for AGIs $25k-50k, 73.3% for AGIs $50k-75k, 75.3% for AGIs $75k-100k, 75.9% for AGIs $100k-200k)
Averages for the 2004 tax year for zip code 10452, filed in 2005:
Average Adjusted Gross Income (AGI) in 2004: $21,546 (Individual Income Tax Returns)
Here:
$21,546
State:
$59,519
Salary/wage: $23,004 (reported on 83.5% of returns)
Here:
$23,004
State:
$50,673
(% of AGI for various income ranges: 56.2% for AGIs below $10k, 83.2% for AGIs $10k-25k, 97.0% for AGIs $25k-50k, 96.3% for AGIs $50k-75k, 90.5% for AGIs $75k-100k, 79.5% for AGIs over 100k)
Taxable interest for individuals: $331 (reported on 11.6% of returns)
This zip code:
$331
New York:
$2,377
(% of AGI for various income ranges: 0.3% for AGIs below $10k, 0.2% for AGIs $10k-25k, 0.1% for AGIs $25k-50k, 0.2% for AGIs $50k-75k, 0.2% for AGIs $75k-100k, 0.3% for AGIs over 100k)
Taxable dividends: $376 (reported on 1.5% of returns)
Here:
$376
State:
$5,394
(% of AGI for various income ranges: 0.0% for AGIs below $10k, 0.0% for AGIs $10k-25k, 0.0% for AGIs $25k-50k, 0.0% for AGIs $50k-75k, 0.1% for AGIs $75k-100k, 0.0% for AGIs over 100k)
Net capital gain/loss: +$561 (reported on 0.9% of returns)
Here:
+$561
State:
+$23,581
(% of AGI for various income ranges: -0.1% for AGIs below $10k, -0.0% for AGIs $10k-25k, -0.0% for AGIs $25k-50k, -0.0% for AGIs $50k-75k, 1.2% for AGIs $75k-100k)
Profit/loss from business: +$7,412 (reported on 22.0% of returns)
Here:
+$7,412
State:
+$13,809
(% of AGI for various income ranges: 43.4% for AGIs below $10k, 13.3% for AGIs $10k-25k, 0.7% for AGIs $25k-50k, 0.3% for AGIs $50k-75k, -0.2% for AGIs $75k-100k)
IRA payment deduction: $2,005 (reported on 0.7% of returns)
10452:
$2,005
New York:
$3,115
(% of AGI for various income ranges: 0.0% for AGIs below $10k, 0.1% for AGIs $10k-25k, 0.1% for AGIs $25k-50k, 0.1% for AGIs $50k-75k)
Total itemized deductions: $15,565 (36% of AGI, reported on 16.3% of returns)
Here:
$15,565
State:
$25,864
Here:
36.1% of AGI
State:
21.9% of AGI
(% of AGI for various income ranges: 0.7% for AGIs below $10k, 3.4% for AGIs $10k-25k, 15.6% for AGIs $25k-50k, 20.3% for AGIs $50k-75k, 20.0% for AGIs $75k-100k, 22.1% for AGIs over 100k)
Charity contributions deductions: $3,260 (7% of AGI, reported on 14.9% of returns)
Here:
$3,260
State:
$4,439
Here:
7.5% of AGI
State:
3.6% of AGI
(% of AGI for various income ranges: 0.1% for AGIs below $10k, 0.6% for AGIs $10k-25k, 2.8% for AGIs $25k-50k, 4.3% for AGIs $50k-75k, 4.6% for AGIs $75k-100k, 5.0% for AGIs over 100k)
Total tax: $1,891 (reported on 57.6% of returns)
10452:
$1,891
State:
$11,730
(% of AGI for various income ranges: 6.6% for AGIs below $10k, 3.3% for AGIs $10k-25k, 4.2% for AGIs $25k-50k, 7.8% for AGIs $50k-75k, 10.6% for AGIs $75k-100k, 14.6% for AGIs over 100k)
Earned income credit: $2,168 (reported on 53.8% of returns)
Here:
$2,168
State:
$1,757
Percentage of individuals using paid preparers for their 2004 taxes: 79.1%
Here:
79%
State:
67%
(% for various income ranges: 79.6% for AGIs below $10k, 82.1% for AGIs $10k-25k, 75.8% for AGIs $25k-50k, 73.6% for AGIs $50k-75k, 74.1% for AGIs $75k-100k, 69.5% for AGIs over 100k)
Likely homosexual households (counted as self-reported same-sex unmarried-partner households)
Lesbian couples: 0.3% of all households
Gay men: 0.2% of all households
Household received Food Stamps/SNAP in the past 12 months: 15,185 Household did not receive Food Stamps/SNAP in the past 12 months: 14,934
Women who had a birth in the past 12 months: 1,354 (481 now married, 898 unmarried) Women who did not have a birth in the past 12 months: 18,726 (5,081 now married, 13,727 unmarried)
Housing units in zip code 10452 with a mortgage: 423 (71 second mortgage, 9 both second mortgage and home equity loan) Houses without a mortgage: 49
Median monthly owner costs for units with a mortgage: $2,001 Median monthly owner costs for units without a mortgage: $963
Residents with income below the poverty level in 2022:
This zip code:
37.6%
Whole state:
14.3%
Residents with income below 50% of the poverty level in 2022:
This zip code:
20.8%
Whole state:
6.8%
Median number of rooms in houses and condos:
Here:
4.7
State:
6.3
Median number of rooms in apartments:
Here:
3.4
State:
3.8
Notable locations in this zip code not listed on our city pages
Notable locations in zip code 10452: Yankee Stadium (A), Fire Department New York Engine 68 Ladder 49 (B), New York Fire Patrol Number 6 (C), New York Ladder Company 49 (D), Andrew Freedman Home (E), Fortyfourth Precinct Police Station (F), Castilian Towers (G). Display/hide their locations on the map
Churches in zip code 10452 include: Iglesia De Dios Pentecostal (A), Mount Hermon Baptist Church (B), Roman Catholic Church of Christ the King (C), Sacred Heart Roman Catholic Church (D), Union Reformed Church (E), Pilgrim Evangelical Lutheran Church (F), Woodycrest Methodist Episcopal Church (G), Young Israel of the Concourse Synagogue (H), Carmelite Sisters Convent (I). Display/hide their locations on the map
Parks in zip code 10452 include: Joyce Kilmer Park (1), Keltch Memorial Park (2), Mullayly Park (3), Martin Luther King Triangle (4), Corporal Irwin Fischer Park (5), Mosaic Success Garden (6), Merriam Playground (7), High Bridge Park (8), Ogden Plimpton Playground (9). Display/hide their locations on the map
6,263 married couples with children.
10,466 single-parent households (1,527 men, 8,939 women).
29.9% of residents of 10452 zip code speak English at home.
58.2% of residents speak Spanish at home (48% very well, 21% well, 19% not well, 11% not at all).
3.4% of residents speak other Indo-European language at home (60% very well, 34% well, 4% not well, 1% not at all).
0.4% of residents speak Asian or Pacific Island language at home (51% very well, 8% well, 36% not well, 5% not at all).
8.1% of residents speak other language at home (67% very well, 30% well, 1% not well, 1% not at all).
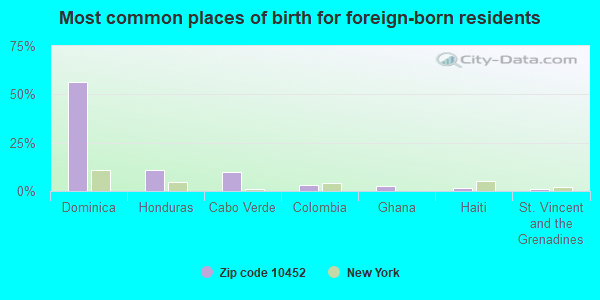
Foreign born population: 29,432 (38.0%) (56.4% of them are naturalized citizens)
This zip code:
38.0%
Whole state:
22.7%
56%Dominica
11%Honduras
10%Cabo Verde
3%Colombia
3%Ghana
2%Haiti
1%St. Vincent and the Grenadines
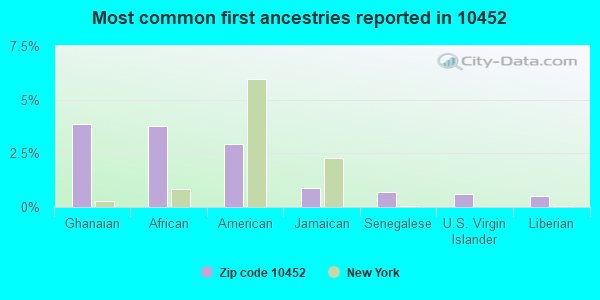
4%Ghanaian
4%African
3%American
1%Jamaican
1%Senegalese
1%U.S. Virgin Islander
0%Liberian
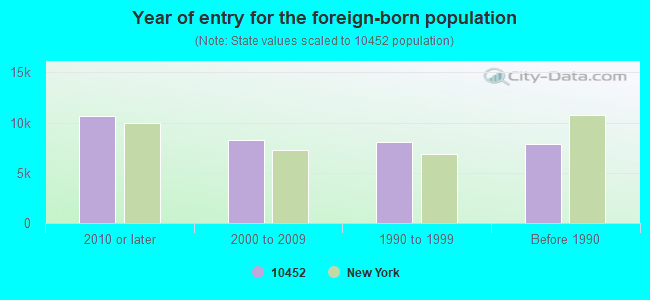
Year of entry for the foreign-born population
10,6742010 or later
8,2472000 to 2009
8,1141990 to 1999
7,888Before 1990
Major facilities with environmental interests located in this zip code:
INWOOD MEDICAL PRACTICE (1543 INWOOD AVENUE in BRONX, NY)
ENFORCEMENT/COMPLIANCE ACTIVITY (Integrated Compliance Information System) - ICIS-02-2004-0807, FORMAL ENFORCEMENT ACTION (Integrated Compliance Information System) - ICIS-02-2004-0807, FORMAL ENFORCEMENT ACTION
CPCRA PROGRAM (1645 GRAND CONCOURSE in BRONX, NY)
ENFORCEMENT/COMPLIANCE ACTIVITY (Integrated Compliance Information System) - ICIS-02-2004-0807, FORMAL ENFORCEMENT ACTION (Integrated Compliance Information System) - ICIS-02-2004-0807, FORMAL ENFORCEMENT ACTION
CROMWELL CLEANERS (2 EAST 167TH ST in BRONX, NY)
AIR MINOR (AIRS/AFS) STATE MASTER (New York facility tracking) - AIR PROGRAM (Resource Conservation and Recovery Act (tracking hazardous waste)) Business SIC classification: DRYCLEANING PLANTS, EXCEPT RUG CLEANING Business NAICS classification: DRYCLEANING AND LAUNDRY SERVICES (EXCEPT COIN-OPERATED).
AIR SYNTHETIC MINOR (AIRS/AFS) STATE MASTER (New York facility tracking) - AIR PROGRAM (Resource Conservation and Recovery Act (tracking hazardous waste)) Business SIC classification: TOP, BODY, AND UPHOLSTERY REPAIR SHOPS AND PAINT SHOPS Business NAICS classification: AUTOMOTIVE BODY, PAINT, AND INTERIOR REPAIR AND MAINTENANCE. Organizations: JOHN BISHOP (CONTACT/OWNER)
Alternative names: CROMWELL COLLISION INC
1035 WOODYCREST AVENUE BUILDING (1035 WOODYCREST AVENUE in BRONX, NY)
AIR MINOR (AIRS/AFS) STATE MASTER (New York facility tracking) - AIR PROGRAM Business SIC classification: OPERATORS OF APARTMENT BUILDINGS Business NAICS classification: LESSORS OF RESIDENTIAL BUILDINGS AND DWELLINGS. Organizations: WOODYCREST REALTY LLC (LEGALLY RESPONSIBLE PARTY)
, WOODYCREST AVENUE ASSOCIATES LLC (LEGALLY RESPONSIBLE PARTY)
AMOCO-408030178005 (1237 JEROME AVE in BRONX, NY)
AIR MINOR (AIRS/AFS) STATE MASTER (New York facility tracking) - AIR PROGRAM, Business SIC classification: GASOLINE SERVICE STATIONS Organizations: AMOCO OIL CO (LEGALLY RESPONSIBLE PARTY)
AIR SYNTHETIC MINOR (AIRS/AFS) STATE MASTER (New York facility tracking) - AIR PROGRAM Business SIC classification: OPERATORS OF NONRESIDENTIAL BUILDINGS
HW WILSON CO-950 UNIVERSITY AVE (950 UNIVERSITY AVE in BRONX, NY)
STATE MASTER (New York facility tracking) - HAZARDOUS WASTE PROGRAM, AIR PROGRAM Small Quantity Generators, between 100 kg and 1000 kg of hazardous waste/month (Resource Conservation and Recovery Act (tracking hazardous waste)) - notification Business SIC classification: NONCLASSIFIABLE ESTABLISHMENTS Organizations: H W WILSON CO (CONTACT/OWNER)
, H W WILSON COMPANY (LEGALLY RESPONSIBLE PARTY)
Alternative names: H W WILSON CO
1040 ANDERSON AVE BUILDING (1040 ANDERSON AVENUE in BRONX, NY)
AIR SYNTHETIC MINOR (AIRS/AFS) STATE MASTER (New York facility tracking) - AIR PROGRAM Business SIC classification: OPERATORS OF APARTMENT BUILDINGS Business NAICS classification: LESSORS OF RESIDENTIAL BUILDINGS AND DWELLINGS. Organizations: ANDERSON AVE ASSOCIATES (LEGALLY RESPONSIBLE PARTY)
1235 GRAND CONCOURSE BUILDING (1235 GRAND CONCOURSE in BRONX, NY)
AIR SYNTHETIC MINOR (AIRS/AFS) STATE MASTER (New York facility tracking) - AIR PROGRAM Business SIC classification: OPERATORS OF NONRESIDENTIAL BUILDINGS Organizations: J M G MANAGEMENT PLUS (LEGALLY RESPONSIBLE PARTY)
Alternative names: JMG MANAGEMENT PLUS
IS 232 ( in BRONX, NY)
(National Center for Education Statistics) - STATE ID-320900010232 Organizations: NEW YORK CITY PUBLIC SCHOOLS (SCHOOL DISTRICT)
IS 303 ( in BRONX, NY)
(National Center for Education Statistics) - STATE ID-320900010303 Organizations: NEW YORK CITY PUBLIC SCHOOLS (SCHOOL DISTRICT)
AMELIA CLEANERS & TAILORS (95 EAST 165 STREET in BRONX, NY)
AIR MINOR (AIRS/AFS) Conditionally Exempt Small Quantity Generators, less than 100 kg/month of hazardous waste (Resource Conservation and Recovery Act (tracking hazardous waste)) - notification Business SIC classification: GARMENT PRESSING, AND AGENTS FOR LAUNDRIES AND DRYCLEANERS Organizations: AMELIA ESTEVES (CONTACT/OWNER)
Housing units lacking complete plumbing facilities: 0.5% Housing units lacking complete kitchen facilities: 0.9%
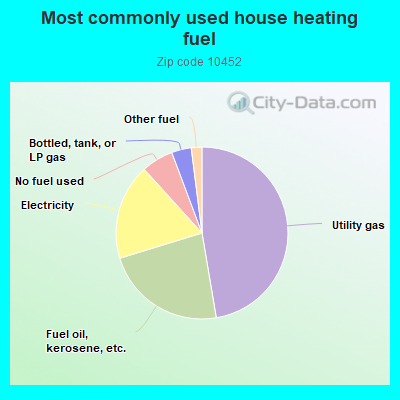
47.3%Utility gas
22.9%Fuel oil, kerosene, etc.
18.0%Electricity
6.0%No fuel used
3.7%Bottled, tank, or LP gas
2.0%Other fuel
Population in 1990: 55,890. Population change in the 1990s: +16,248 (+29.1%).
Place of birth for U.S.-born residents:
This state: 38,864
Northeast: 1,264
Midwest: 199
South: 1,844
West: 425
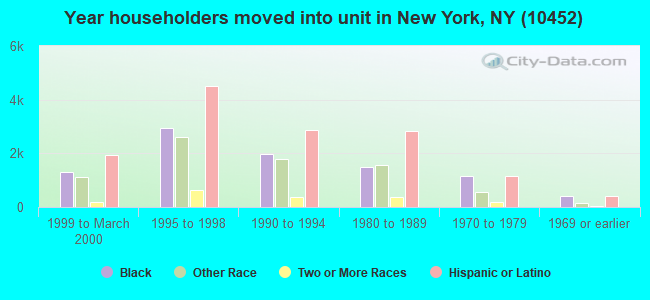
66% of the 10452 zip code residents lived in the same house 5 years ago. Out of people who lived in different houses, 66% lived in this county. Out of people who lived in different counties, 50% lived in New York.
93% of the 10452 zip code residents lived in the same house 1 year ago. Out of people who lived in different houses, 56% moved from this county. Out of people who lived in different houses, 26% moved from different county within same state. Out of people who lived in different houses, 4% moved from different state. Out of people who lived in different houses, 13% moved from abroad.
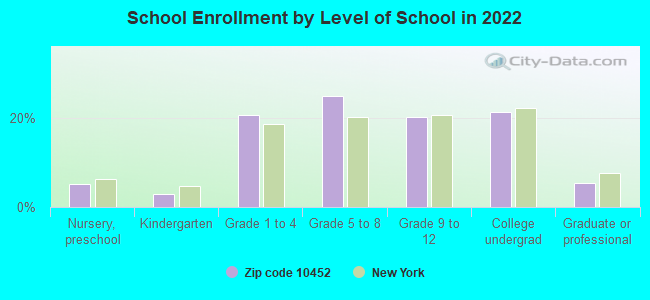
Private vs. public school enrollment:
Students in private schools in grades 1 to 8 (elementary and middle school): 782
Here:
7.5%
New York:
15.6%
Students in private schools in grades 9 to 12 (high school): 367
Here:
7.9%
New York:
15.0%
Students in private undergraduate colleges: 968
Here:
19.9%
New York:
39.2%
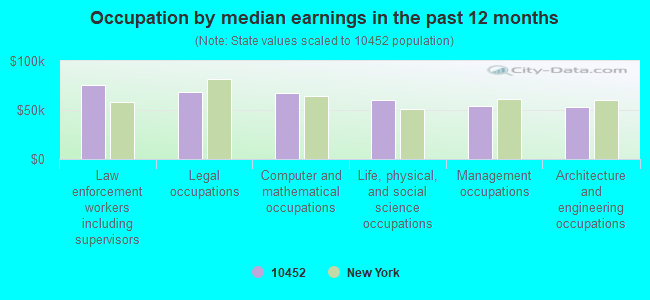
Occupation by median earnings in the past 12 months ($)
75,158Law enforcement workers including supervisors
67,918Legal occupations
66,982Computer and mathematical occupations
60,305Life, physical, and social science occupations
53,912Management occupations
52,824Architecture and engineering occupations
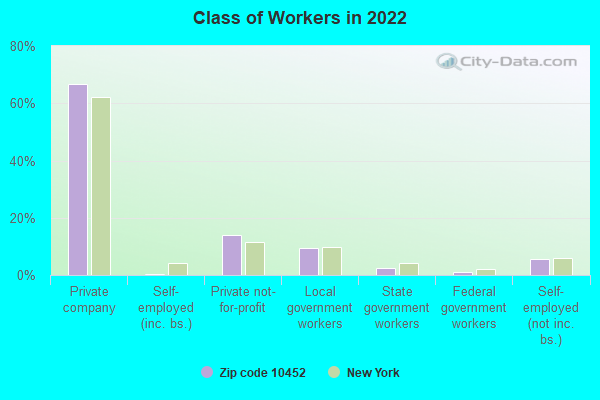
Companies with federal contracts located in this zip code:
SUPREME SCREW PRODUCTS INC (1368 CROMWELL AVE in BRONX, NY; small business) : $196,104 in 3 contractsfrom 2002 to 2005
$103,385 with Navy for Studs. Taking place in CA. Signed on 2002-10-07. Completion date: 2003-01-06.
$89,871, same as above.Signed on 2004-01-26. Completion date: 2004-06-28.
$2,848 with Defense Logistics Agency for Nuts and Washers. Signed on 2005-03-07. Completion date: 2005-04-21.
THE H W WILSON COMPANY INC (950 UNIVERSITY AVE in BRONX, NY) : $137,180 in 14 contractsfrom 2003 to 2006
Contracts for Books and Pamphlets, Research and Development Facilities, Newspapers and Periodicals, Inspection Services (including commercial testing and lab services, except medical/dental) -- Books, Maps, and Other Publications, and moreby Air Force, EDUCATION, Department of, Army, Department of State, and others Signed by year:2000: $0; 2001: $0; 2002: $0; 2003: $9,601; 2004: $20,911; 2005: $89,595; 2006: $17,073.
Biggest contracts:
$40,511 with Air Force for Books and Pamphlets. Signed on 2005-09-30. Completion date: 2006-09-30.
$14,995 with EDUCATION, Department of for Research and Development Facilities. Taking place in DC. Signed on 2005-08-10. Completion date: 2005-09-30.
$14,995, same as above.Signed on 2005-08-08. Completion date: 2005-09-30.
$10,187 with Army for Books and Pamphlets. Taking place in PA. Signed on 2006-03-06. Completion date: 2007-03-31.
Top industries in this zip code by the number of employees in 2005:
Real Estate and Rental and Leasing: Lessors of Residential Buildings and Dwellings (100-249 employees: 1 establishment, 50-99 employees: 1 establishment, 10-19 employees: 2 establishments, 5-9 employees: 12 establishments, 1-4 employees: 79 establishments)
Health Care and Social Assistance: Other Individual and Family Services (50-99: 2, 20-49: 7, 10-19: 3, 5-9: 1, 1-4: 2)
Information: Periodical Publishers (250-499: 1)
Health Care and Social Assistance: Nursing Care Facilities (100-249: 2)
2007 - 2018 National Fire Incident Reporting System (NFIRS) incidents
Based on the data from the years 2007 - 2018 the average number of fire incidents per year is 341. The highest number of fires - 458 took place in 2008, and the least - 209 in 2007. The data has a rising trend.
When looking into fire subcategories, the most incidents belonged to: Structure Fires (76.1%), and Outside Fires (13.4%).
Fire incident types reported to NFIRS in Zip Code 10452


 Nearest zip codes: 10039, 10033, 10451, 10456, 10453, 10032.


 Based on the data from the years 2007 - 2018 the average number of fire incidents per year is 341. The highest number of fires - 458 took place in 2008, and the least - 209 in 2007. The data has a rising trend.
 When looking into fire subcategories, the most incidents belonged to: Structure Fires (76.1%), and Outside Fires (13.4%).