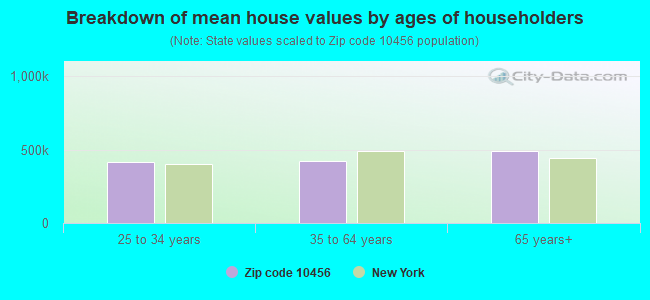
Estimated median house/condo value in 2022: $420,728
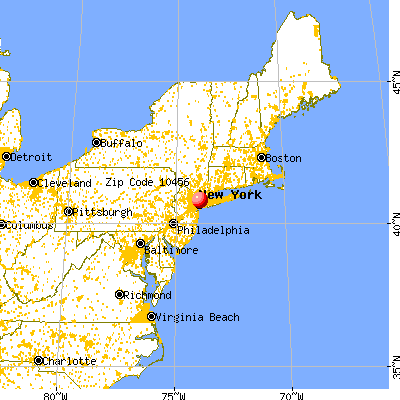
10456:
$420,728
New York:
$400,400
According to our research of New York and other state lists, there were 106 registered sex offenders living in 10456 zip code as of April 27, 2024. The ratio of all residents to sex offenders in zip code 10456 is 887 to 1. The ratio of registered sex offenders to all residents in this zip code is near the state average.
Median resident age:
This zip code:
34.2 years
New York median age:
40.0 years
Average household size:
This zip code:
2.5 people
New York:
2.5 people
Averages for the 2020 tax year for zip code 10456, filed in 2021:
Average Adjusted Gross Income (AGI) in 2020: $31,534 (Individual Income Tax Returns)
Here:
$31,534
State:
$90,930
Salary/wage: $31,006 (reported on 77.8% of returns)
Here:
$31,006
State:
$72,104
(% of AGI for various income ranges: 877.2% for AGIs below $25k, 3239.9% for AGIs $25k-50k, 6813.0% for AGIs $50k-75k, 10272.3% for AGIs $75k-100k, 16399.0% for AGIs $100k-200k, 97010.0% for AGIs over 200k)
Taxable interest for individuals: $214 (reported on 7.4% of returns)
This zip code:
$214
New York:
$3,075
(% of AGI for various income ranges: 0.9% for AGIs below $25k, 1.1% for AGIs $25k-50k, 3.3% for AGIs $50k-75k, 6.0% for AGIs $75k-100k, 17.7% for AGIs $100k-200k, 505.0% for AGIs over 200k)
Ordinary dividends: $844 (reported on 1.8% of returns)
Here:
$844
State:
$11,095
(% of AGI for various income ranges: 0.5% for AGIs below $25k, 0.7% for AGIs $25k-50k, 1.5% for AGIs $50k-75k, 13.9% for AGIs $75k-100k, 18.2% for AGIs $100k-200k, 770.0% for AGIs over 200k)
Net capital gain/loss in AGI: +$3,077 (reported on 2.4% of returns)
Here:
+$3,077
State:
+$44,925
(% of AGI for various income ranges: 0.5% for AGIs below $25k, 1.0% for AGIs $25k-50k, 6.0% for AGIs $50k-75k, 37.3% for AGIs $75k-100k, 67.0% for AGIs $100k-200k, 10045.0% for AGIs over 200k)
Profit/loss from business: +$5,136 (reported on 21.2% of returns)
Here:
+$5,136
State:
+$14,940
(% of AGI for various income ranges: 214.9% for AGIs below $25k, 63.4% for AGIs $25k-50k, 52.3% for AGIs $50k-75k, 64.4% for AGIs $75k-100k, 381.8% for AGIs $100k-200k)
Taxable individual retirement arrangement distribution: $10,008 (reported on 0.6% of returns)
10456:
$10,008
New York:
$19,609
(% of AGI for various income ranges: 2.0% for AGIs below $25k, 2.8% for AGIs $25k-50k, 11.7% for AGIs $50k-75k, 68.7% for AGIs $75k-100k, 118.7% for AGIs $100k-200k)
Total itemized deductions: $24,284 (reported on 2.1% of returns)
Here:
$24,284
State:
$39,326
(% of AGI for various income ranges: 8.0% for AGIs below $25k, 35.0% for AGIs $25k-50k, 152.3% for AGIs $50k-75k, 381.9% for AGIs $75k-100k, 835.7% for AGIs $100k-200k, 4500.0% for AGIs over 200k)
Charity contributions: $7,973 (reported on 1.5% of returns)
Here:
$7,973
State:
$15,420
(% of AGI for various income ranges: 8.0% for AGIs $25k-50k, 44.4% for AGIs $50k-75k, 85.5% for AGIs $75k-100k, 214.4% for AGIs $100k-200k, 1350.0% for AGIs over 200k)
Taxes paid: $7,754 (reported on 2.1% of returns)
10456:
$7,754
State:
$9,183
(% of AGI for various income ranges: 1.1% for AGIs below $25k, 9.3% for AGIs $25k-50k, 48.2% for AGIs $50k-75k, 135.2% for AGIs $75k-100k, 322.1% for AGIs $100k-200k, 1465.0% for AGIs over 200k)
Earned income credit: $2,548 (reported on 37.1% of returns)
Here:
$2,548
State:
$2,138
(% of AGI for various income ranges: 173.0% for AGIs below $25k, 106.7% for AGIs $25k-50k, 1.6% for AGIs $50k-75k)
Percentage of individuals using paid preparers for their 2020 taxes: 94.7%
Here:
95%
State:
95%
(% for various income ranges: 93.2% for AGIs below $25k, 96.3% for AGIs $25k-50k, 95.8% for AGIs $50k-75k, 96.6% for AGIs $75k-100k, 95.7% for AGIs $100k-200k, 87.5% for AGIs over 200k)
Averages for the 2012 tax year for zip code 10456, filed in 2013:
Average Adjusted Gross Income (AGI) in 2012: $23,501 (Individual Income Tax Returns)
Here:
$23,501
State:
$77,088
Salary/wage: $24,944 (reported on 80.3% of returns)
Here:
$24,944
State:
$60,593
(% of AGI for various income ranges: 69.7% for AGIs below $25k, 94.9% for AGIs $25k-50k, 93.6% for AGIs $50k-75k, 91.3% for AGIs $75k-100k, 84.0% for AGIs $100k-200k)
Taxable interest for individuals: $202 (reported on 7.1% of returns)
This zip code:
$202
New York:
$3,125
(% of AGI for various income ranges: 0.2% for AGIs $100k-200k)
Ordinary dividends: $743 (reported on 1.3% of returns)
Here:
$743
State:
$10,299
(% of AGI for various income ranges: 0.1% for AGIs $100k-200k)
Profit/loss from business: +$8,450 (reported on 23.8% of returns)
Here:
+$8,450
State:
+$16,168
(% of AGI for various income ranges: 23.6% for AGIs below $25k, 0.8% for AGIs $25k-50k, 0.2% for AGIs $50k-75k, 0.7% for AGIs $75k-100k, 0.5% for AGIs $100k-200k)
Taxable individual retirement arrangement distribution: $8,216 (reported on 0.7% of returns)
10456:
$8,216
New York:
$17,621
(% of AGI for various income ranges: 0.1% for AGIs below $25k, 0.2% for AGIs $25k-50k, 0.3% for AGIs $50k-75k, 1.1% for AGIs $75k-100k)
Total itemized deductions: $16,605 (32% of AGI, reported on 13.7% of returns)
Here:
$16,605
State:
$34,985
Here:
32.0% of AGI
State:
21.3% of AGI
(% of AGI for various income ranges: 2.0% for AGIs below $25k, 10.9% for AGIs $25k-50k, 17.1% for AGIs $50k-75k, 18.2% for AGIs $75k-100k, 17.9% for AGIs $100k-200k)
Charity contributions: $3,064 (reported on 10.6% of returns)
Here:
$3,064
State:
$5,572
(% of AGI for various income ranges: 0.2% for AGIs below $25k, 1.5% for AGIs $25k-50k, 2.6% for AGIs $50k-75k, 2.8% for AGIs $75k-100k, 2.7% for AGIs $100k-200k)
Taxes paid: $4,590 (reported on 13.7% of returns)
10456:
$4,590
State:
$18,656
(% of AGI for various income ranges: 0.3% for AGIs below $25k, 2.2% for AGIs $25k-50k, 5.2% for AGIs $50k-75k, 7.3% for AGIs $75k-100k, 8.0% for AGIs $100k-200k)
Earned income credit: $2,764 (reported on 53.3% of returns)
Here:
$2,764
State:
$2,230
(% of AGI for various income ranges: 16.0% for AGIs below $25k, 2.0% for AGIs $25k-50k)
Percentage of individuals using paid preparers for their 2012 taxes: 77.1%
Here:
77%
State:
66%
(% for various income ranges: 77.7% for AGIs below $25k, 75.6% for AGIs $25k-50k, 76.3% for AGIs $50k-75k, 78.4% for AGIs $75k-100k, 76.7% for AGIs $100k-200k)
Averages for the 2004 tax year for zip code 10456, filed in 2005:
Average Adjusted Gross Income (AGI) in 2004: $21,576 (Individual Income Tax Returns)
Here:
$21,576
State:
$59,519
Salary/wage: $22,730 (reported on 84.8% of returns)
Here:
$22,730
State:
$50,673
(% of AGI for various income ranges: 59.9% for AGIs below $10k, 84.4% for AGIs $10k-25k, 97.0% for AGIs $25k-50k, 94.7% for AGIs $50k-75k, 89.7% for AGIs $75k-100k, 77.4% for AGIs over 100k)
Taxable interest for individuals: $332 (reported on 11.6% of returns)
This zip code:
$332
New York:
$2,377
(% of AGI for various income ranges: 0.3% for AGIs below $10k, 0.2% for AGIs $10k-25k, 0.2% for AGIs $25k-50k, 0.2% for AGIs $50k-75k, 0.3% for AGIs $75k-100k, 0.3% for AGIs over 100k)
Taxable dividends: $473 (reported on 1.8% of returns)
Here:
$473
State:
$5,394
(% of AGI for various income ranges: 0.0% for AGIs below $10k, 0.1% for AGIs $10k-25k, 0.0% for AGIs $25k-50k, 0.0% for AGIs $50k-75k, 0.1% for AGIs $75k-100k, 0.2% for AGIs over 100k)
Profit/loss from business: +$7,195 (reported on 19.8% of returns)
Here:
+$7,195
State:
+$13,809
(% of AGI for various income ranges: 39.4% for AGIs below $10k, 11.7% for AGIs $10k-25k, 0.4% for AGIs $25k-50k, -0.4% for AGIs $50k-75k, -0.4% for AGIs $75k-100k, 0.7% for AGIs over 100k)
IRA payment deduction: $1,624 (reported on 0.8% of returns)
10456:
$1,624
New York:
$3,115
(% of AGI for various income ranges: 0.0% for AGIs below $10k, 0.0% for AGIs $10k-25k, 0.1% for AGIs $25k-50k, 0.1% for AGIs $50k-75k)
Total itemized deductions: $14,580 (33% of AGI, reported on 16.2% of returns)
Here:
$14,580
State:
$25,864
Here:
32.9% of AGI
State:
21.9% of AGI
(% of AGI for various income ranges: 0.9% for AGIs below $10k, 3.5% for AGIs $10k-25k, 13.5% for AGIs $25k-50k, 20.1% for AGIs $50k-75k, 21.2% for AGIs $75k-100k, 20.2% for AGIs over 100k)
Charity contributions deductions: $3,302 (7% of AGI, reported on 14.8% of returns)
Here:
$3,302
State:
$4,439
Here:
7.4% of AGI
State:
3.6% of AGI
(% of AGI for various income ranges: 0.1% for AGIs below $10k, 0.7% for AGIs $10k-25k, 2.9% for AGIs $25k-50k, 4.2% for AGIs $50k-75k, 4.3% for AGIs $75k-100k, 4.0% for AGIs over 100k)
Total tax: $1,938 (reported on 55.2% of returns)
10456:
$1,938
State:
$11,730
(% of AGI for various income ranges: 5.9% for AGIs below $10k, 3.1% for AGIs $10k-25k, 4.1% for AGIs $25k-50k, 7.8% for AGIs $50k-75k, 10.8% for AGIs $75k-100k, 14.6% for AGIs over 100k)
Earned income credit: $2,165 (reported on 54.6% of returns)
Here:
$2,165
State:
$1,757
Percentage of individuals using paid preparers for their 2004 taxes: 78.7%
Here:
79%
State:
67%
(% for various income ranges: 78.9% for AGIs below $10k, 80.8% for AGIs $10k-25k, 76.4% for AGIs $25k-50k, 73.9% for AGIs $50k-75k, 72.3% for AGIs $75k-100k, 75.7% for AGIs over 100k)
Likely homosexual households (counted as self-reported same-sex unmarried-partner households)
Lesbian couples: 0.0% of all households
Gay men: 0.0% of all households
Household received Food Stamps/SNAP in the past 12 months: 18,315 Household did not receive Food Stamps/SNAP in the past 12 months: 16,293
Women who had a birth in the past 12 months: 1,624 (562 now married, 1,092 unmarried) Women who did not have a birth in the past 12 months: 21,310 (6,119 now married, 15,270 unmarried)
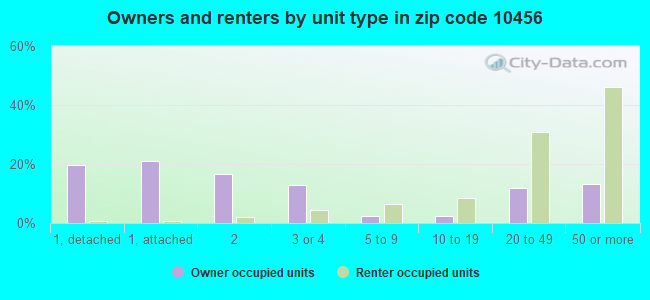
Housing units in zip code 10456 with a mortgage: 1,040 (67 second mortgage, 54 both second mortgage and home equity loan) Median monthly owner costs for units with a mortgage: $2,255 Median monthly owner costs for units without a mortgage: $777
Residents with income below the poverty level in 2022:
This zip code:
38.0%
Whole state:
14.3%
Residents with income below 50% of the poverty level in 2022:
This zip code:
17.6%
Whole state:
6.8%
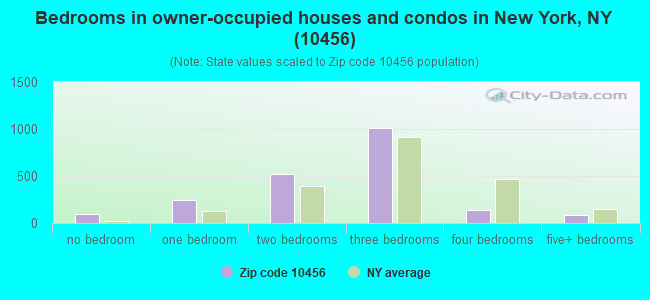
Median number of rooms in houses and condos:
Here:
4.9
State:
6.3
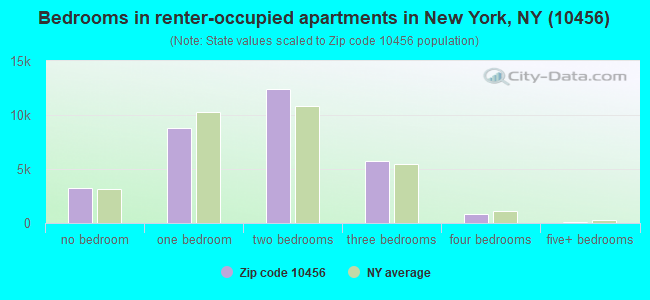
Median number of rooms in apartments:
Here:
3.8
State:
3.8
Notable locations in this zip code not listed on our city pages
Notable locations in zip code 10456: New York Hook and Ladder Company Number 32 (A), Domestic Relations Court (B), Fire Department New York Engine 92 Ladder 44 Battalion 17 (C), New York Ladder Company 19 (D), Melrose Common (E), New York Ladder Company 44 (F), Findlay House (G), Fire Department New York Engine 50 Ladder 19 Battalion 26 (H), Bronx Museum of the Arts (I), Bronx Family Court (J). Display/hide their locations on the map
Churches in zip code 10456 include: Moore Memorial African Methodist Episcopal Zion Church (A), New Covenant Dominion Cathedral (B), Centenary Methodist Church (C), Bethany Lutheran Church (D), Morrisania Community Church (E), Saint Augustine's Roman Catholic Church (F), Saint Johns Evangelical Lutheran Church (G), Saint Paul's Episcopal Church (H), Second Disciples of Christ Church (I). Display/hide their locations on the map
Parks in zip code 10456 include: Beatty Plaza (1), McKinley Square (2), Charlton Garden (3), Clay Avenue Historic District (4), Morris High School Historic District (5), Gouverneur Morris Playground (6), Grant Avenue Park (7), Dred Scott Bird Sanctuary (8), Grove Hill Playground (9). Display/hide their locations on the map
6,579 married couples with children.
12,241 single-parent households (1,407 men, 10,834 women).
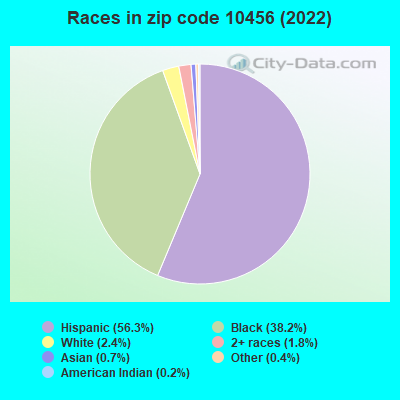
39.6% of residents of 10456 zip code speak English at home.
48.0% of residents speak Spanish at home (50% very well, 21% well, 19% not well, 10% not at all).
3.5% of residents speak other Indo-European language at home (48% very well, 37% well, 15% not well).
0.3% of residents speak Asian or Pacific Island language at home (81% very well, 13% well, 6% not well).
8.6% of residents speak other language at home (60% very well, 31% well, 9% not well).
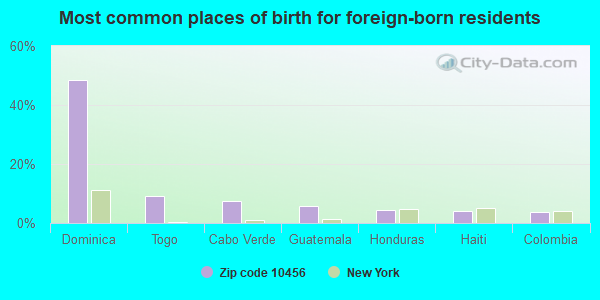
Foreign born population: 26,026 (29.9%) (53.2% of them are naturalized citizens)
This zip code:
29.9%
Whole state:
22.7%
48%Dominica
9%Togo
8%Cabo Verde
6%Guatemala
4%Honduras
4%Haiti
4%Colombia
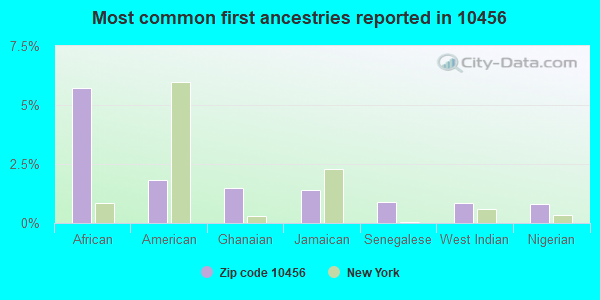
6%African
2%American
1%Ghanaian
1%Jamaican
1%Senegalese
1%West Indian
1%Nigerian
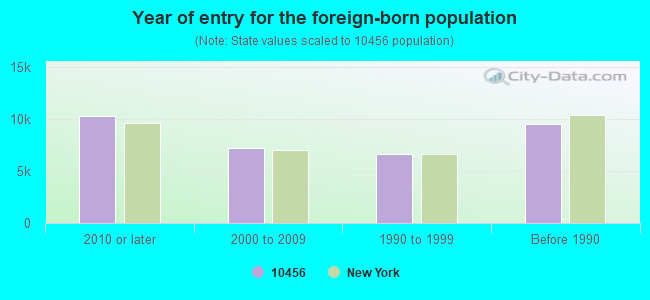
Year of entry for the foreign-born population
10,2892010 or later
7,2302000 to 2009
6,6171990 to 1999
9,513Before 1990
Major facilities with environmental interests located in this zip code:
GOOD DAY CLEANERS (209 E 165TH STREET in BRONX, NY)
AIR MINOR (AIRS/AFS) STATE MASTER (New York facility tracking) - AIR PROGRAM Conditionally Exempt Small Quantity Generators, less than 100 kg/month of hazardous waste (Resource Conservation and Recovery Act (tracking hazardous waste)) - notification Business SIC classification: DRYCLEANING PLANTS, EXCEPT RUG CLEANING Business NAICS classification: DRYCLEANING AND LAUNDRY SERVICES (EXCEPT COIN-OPERATED). Organizations: RYOUNG Q HAH (CONTACT/OPERATOR)
, YVONNE RODRIGUEZ (CONTACT/OWNER)
, YOON SOO HAH (CONTACT/OWNER)
, D & J LEE CLEANERS CORP (LEGALLY RESPONSIBLE PARTY)
, ALL DAY CLEANERS CORP (LEGALLY RESPONSIBLE PARTY)
Alternative names: ALL DAY CLEANERS, D & J CLEANERS
AMOCO-31211343005 (1303 WEBSTER AVE in BRONX, NY)
AIR MINOR (AIRS/AFS) STATE MASTER (New York facility tracking) - AIR PROGRAM Conditionally Exempt Small Quantity Generators, less than 100 kg/month of hazardous waste (Resource Conservation and Recovery Act (tracking hazardous waste)) - notification Business SIC classification: GASOLINE SERVICE STATIONS Organizations: AMOCO OIL CO (CONTACT/OWNER)
Alternative names: GURNAMS AMOCO, WEBSTER AMOCO
BELLO CLEANERS (292 EAST 166TH ST in BRONX, NY)
AIR MINOR (AIRS/AFS) STATE MASTER (New York facility tracking) - AIR PROGRAM Conditionally Exempt Small Quantity Generators, less than 100 kg/month of hazardous waste (Resource Conservation and Recovery Act (tracking hazardous waste)) - notification Business SIC classification: DRYCLEANING PLANTS, EXCEPT RUG CLEANING Business NAICS classification: DRYCLEANING AND LAUNDRY SERVICES (EXCEPT COIN-OPERATED). Organizations: EMDE REALITY (CONTACT/OWNER)
Alternative names: BELL CLEANERS
1260 FRANKLIN AVENUE SCHOOL - P-63 (1260 FRANKLIN AVENUE in BRONX, NY)
STATE MASTER (New York facility tracking) - AIR PROGRAM Conditionally Exempt Small Quantity Generators, less than 100 kg/month of hazardous waste (Resource Conservation and Recovery Act (tracking hazardous waste)) - notification Business SIC classification: ELEMENTARY AND SECONDARY SCHOOLS Organizations: NYC BOARD OF EDUCATION (CONTACT/OWNER)
, NYC DEPT OF EDUCATION (LEGALLY RESPONSIBLE PARTY)
Alternative names: NYC BD OF ED - PUBLIC SCHOOL 63 BRONX
INTERSTATE WOODWORKING-550 E 170TH ST (550 EAST 170TH STREET in BRONX, NY)
STATE MASTER (New York facility tracking) - AIR PROGRAM, Conditionally Exempt Small Quantity Generators, less than 100 kg/month of hazardous waste (Resource Conservation and Recovery Act (tracking hazardous waste)) - notification Organizations: MICHAEL VESTA (CONTACT/OWNER)
, INTERSTATE WOODWORKING CO INC (LEGALLY RESPONSIBLE PARTY)
Alternative names: INTERSTATE WOODWORKING CO INC
HARRIET TUBMAN CHARTER SCHOOL ( in BRONX, NY)
(National Center for Education Statistics) - STATE ID-320900860823
IS 120 P. L. DUNBAR IS ( in BRONX, NY)
(National Center for Education Statistics) - STATE ID-320800010120 Organizations: NEW YORK CITY PUBLIC SCHOOLS (SCHOOL DISTRICT)
IS 166 ROBERTO CLEMENTE ( in BRONX, NY)
(National Center for Education Statistics) - STATE ID-320900010166 Organizations: NEW YORK CITY PUBLIC SCHOOLS (SCHOOL DISTRICT)
IS 184 RAFAEL CORDERO Y. MOLINA SCHO ( in BRONX, NY)
(National Center for Education Statistics) - STATE ID-320700010184 Organizations: NEW YORK CITY PUBLIC SCHOOLS (SCHOOL DISTRICT)
IS 219 VENTURE COMM ACAD ( in BRONX, NY)
(National Center for Education Statistics) - STATE ID-320900010219 Organizations: NEW YORK CITY PUBLIC SCHOOLS (SCHOOL DISTRICT)
CON ED V 1324 (F/O 540 550 EAST 169TH STREET in BRONX, NY)
HAZARDOUS WASTE BIENNIAL REPORTER (Resource Conservation and Recovery Act (tracking hazardous waste)) (Resource Conservation and Recovery Act (tracking hazardous waste))
A S G GENERATOR COMPANY INCORPORATED (511 EAST 164TH STREET in BRONX, NY)
AIR MINOR (AIRS/AFS) (Resource Conservation and Recovery Act (tracking hazardous waste)) Business SIC classification: NONCLASSIFIABLE ESTABLISHMENTS
CON EDISON - MH 20487 (SEC MORRIS AVE in BRONX, NY)
Large Quantity Generators, more that 1000 kg of hazardous waste/month (Resource Conservation and Recovery Act (tracking hazardous waste)) Organizations: CONSOLIDATED EDISON COMPANY OF NY, INC. (CONTACT/OPERATOR)
Housing units lacking complete plumbing facilities: 1.0% Housing units lacking complete kitchen facilities: 1.4%
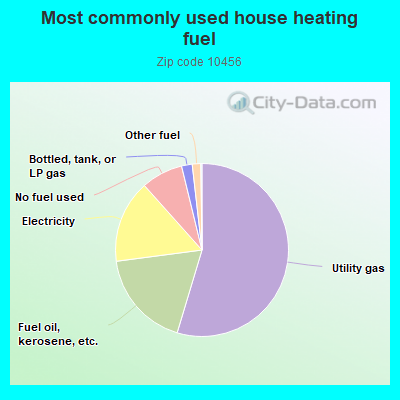
54.7%Utility gas
18.3%Fuel oil, kerosene, etc.
15.5%Electricity
7.8%No fuel used
2.0%Bottled, tank, or LP gas
1.6%Other fuel
Population in 1990: 70,157. Population change in the 1990s: +6,499 (+9.3%).
Place of birth for U.S.-born residents:
This state: 48,293
Northeast: 1,371
Midwest: 541
South: 3,018
West: 385
66% of the 10456 zip code residents lived in the same house 5 years ago. Out of people who lived in different houses, 73% lived in this county. Out of people who lived in different counties, 50% lived in New York.
92% of the 10456 zip code residents lived in the same house 1 year ago. Out of people who lived in different houses, 59% moved from this county. Out of people who lived in different houses, 21% moved from different county within same state. Out of people who lived in different houses, 11% moved from different state. Out of people who lived in different houses, 8% moved from abroad.
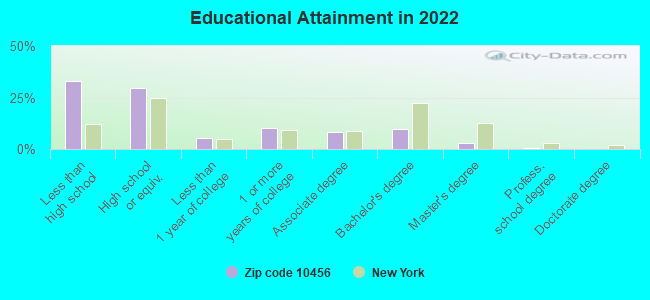
Private vs. public school enrollment:
Students in private schools in grades 1 to 8 (elementary and middle school): 953
Here:
9.4%
New York:
15.6%
Students in private schools in grades 9 to 12 (high school): 733
Here:
11.8%
New York:
15.0%
Students in private undergraduate colleges: 1,139
Here:
27.1%
New York:
39.2%
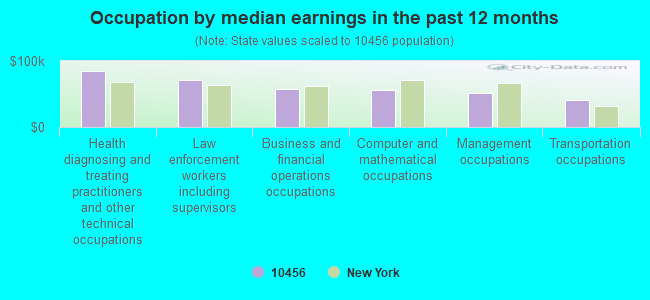
Occupation by median earnings in the past 12 months ($)
85,161Health diagnosing and treating practitioners and other technical occupations
70,473Law enforcement workers including supervisors
58,333Business and financial operations occupations
55,726Computer and mathematical occupations
51,634Management occupations
41,528Transportation occupations
Top industries in this zip code by the number of employees in 2005:
Health Care and Social Assistance: General Medical and Surgical Hospitals (over 1000 employees: 1 establishment)
Health Care and Social Assistance: Nursing Care Facilities (500-999: 1, 250-499: 1)
Health Care and Social Assistance: All Other Outpatient Care Centers (250-499: 1)
Administrative and Support and Waste Management and Remediation Services: Professional Employer Organizations (250-499: 1)
Health Care and Social Assistance: Child and Youth Services (100-249: 1, 50-99: 1, 1-4: 1)
Real Estate and Rental and Leasing: Lessors of Residential Buildings and Dwellings (10-19: 6, 5-9: 6, 1-4: 51)
Real Estate and Rental and Leasing: Residential Property Managers (100-249: 1, 10-19: 1, 5-9: 1, 1-4: 5)
Health Care and Social Assistance: Other Individual and Family Services (50-99: 2, 20-49: 1, 5-9: 1, 1-4: 4)
Health Care and Social Assistance: Child Day Care Services (20-49: 4, 10-19: 2, 5-9: 2, 1-4: 2)
People in group quarters in 2010:
975 people in emergency and transitional shelters (with sleeping facilities) for people experiencing homelessness
945 people in nursing facilities/skilled-nursing facilities
240 people in hospitals with patients who have no usual home elsewhere
226 people in residential treatment centers for adults
162 people in mental (psychiatric) hospitals and psychiatric units in other hospitals
58 people in group homes intended for adults
11 people in other noninstitutional facilities
People in group quarters in 2000:
730 people in nursing homes
286 people in other noninstitutional group quarters
225 people in hospitals or wards for drug/alcohol abuse
123 people in other group homes
99 people in homes for the mentally ill
44 people in homes for the mentally retarded
12 people in short-term care, detention or diagnostic centers for delinquent children
11 people in homes or halfway houses for drug/alcohol abuse
Fatal accident statistics in 2013:
Fatal accident count: 2
Vehicles involved in fatal accidents: 2
Fatal accidents caused by drunken drivers: 0
Fatalities: 2
Persons involved in fatal accidents: 3
Pedestrians involved in fatal accidents: 2
Fatal accident statistics in 2012:
Fatal accident count: 2
Vehicles involved in fatal accidents: 3
Fatal accidents caused by drunken drivers: 1
Fatalities: 2
Persons involved in fatal accidents: 3
Pedestrians involved in fatal accidents: 3
Home Mortgage Disclosure Act Aggregated Statistics For Year 2009 (Based on 11 full and 24 partial tracts)
A) FHA, FSA/RHS & VA Home Purchase Loans
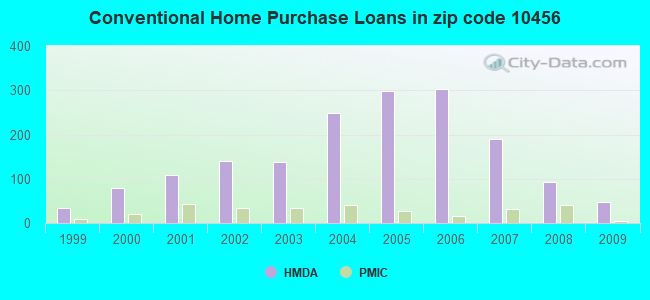
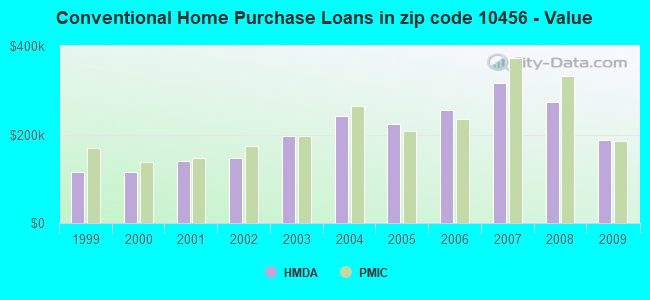
B) Conventional Home Purchase Loans
C) Refinancings
D) Home Improvement Loans
E) Loans on Dwellings For 5+ Families
F) Non-occupant Loans on < 5 Family Dwellings (A B C & D)
G) Loans On Manufactured Home Dwelling (A B C & D)
Number
Average Value
Number
Average Value
Number
Average Value
Number
Average Value
Number
Average Value
Number
Average Value
Number
Average Value
LOANS ORIGINATED
22
$414,587
47
$188,237
52
$293,530
5
$99,688
9
$1,071,090
6
$327,225
1
$262,770
APPLICATIONS APPROVED, NOT ACCEPTED
2
$218,295
10
$278,969
14
$227,362
5
$65,862
1
$4,500,000
3
$218,157
0
$0
APPLICATIONS DENIED
18
$430,138
90
$168,452
98
$264,527
22
$34,850
11
$3,802,132
8
$272,566
3
$90,830
APPLICATIONS WITHDRAWN
14
$372,941
10
$200,208
30
$261,591
0
$0
7
$874,046
4
$416,978
0
$0
FILES CLOSED FOR INCOMPLETENESS
3
$406,163
16
$122,938
18
$238,753
1
$176,900
0
$0
2
$120,215
0
$0
Aggregated Statistics For Year 2008 (Based on 13 full and 22 partial tracts)
A) FHA, FSA/RHS & VA Home Purchase Loans
B) Conventional Home Purchase Loans
C) Refinancings
D) Home Improvement Loans
E) Loans on Dwellings For 5+ Families
F) Non-occupant Loans on < 5 Family Dwellings (A B C & D)
G) Loans On Manufactured Home Dwelling (A B C & D)
Number
Average Value
Number
Average Value
Number
Average Value
Number
Average Value
Number
Average Value
Number
Average Value
Number
Average Value
LOANS ORIGINATED
10
$483,363
92
$272,370
64
$293,708
18
$116,233
21
$2,556,625
17
$351,734
0
$0
APPLICATIONS APPROVED, NOT ACCEPTED
7
$476,957
38
$353,948
28
$248,408
7
$20,763
4
$678,485
7
$317,157
1
$55,100
APPLICATIONS DENIED
10
$445,926
94
$282,402
147
$345,101
59
$76,272
33
$2,387,530
30
$288,758
3
$36,880
APPLICATIONS WITHDRAWN
6
$577,263
21
$317,538
32
$282,233
7
$146,470
1
$597,090
3
$250,273
0
$0
FILES CLOSED FOR INCOMPLETENESS
1
$459,060
15
$362,384
16
$342,524
4
$271,888
0
$0
8
$365,632
0
$0
Aggregated Statistics For Year 2007 (Based on 13 full and 24 partial tracts)
A) FHA, FSA/RHS & VA Home Purchase Loans
B) Conventional Home Purchase Loans
C) Refinancings
D) Home Improvement Loans
E) Loans on Dwellings For 5+ Families
F) Non-occupant Loans on < 5 Family Dwellings (A B C & D)
G) Loans On Manufactured Home Dwelling (A B C & D)
Number
Average Value
Number
Average Value
Number
Average Value
Number
Average Value
Number
Average Value
Number
Average Value
Number
Average Value
LOANS ORIGINATED
8
$404,194
189
$316,504
161
$278,911
27
$109,607
36
$1,458,826
39
$329,257
0
$0
APPLICATIONS APPROVED, NOT ACCEPTED
0
$0
73
$272,723
59
$319,010
15
$139,605
0
$0
10
$251,012
0
$0
APPLICATIONS DENIED
0
$0
201
$339,277
251
$305,682
70
$145,293
13
$1,558,958
62
$310,068
2
$71,460
APPLICATIONS WITHDRAWN
1
$570,000
71
$337,904
78
$413,976
6
$107,498
5
$1,653,386
18
$798,908
0
$0
FILES CLOSED FOR INCOMPLETENESS
0
$0
23
$312,926
40
$291,381
3
$212,077
1
$596,960
8
$406,276
0
$0
Aggregated Statistics For Year 2006 (Based on 13 full and 24 partial tracts)
A) FHA, FSA/RHS & VA Home Purchase Loans
B) Conventional Home Purchase Loans
C) Refinancings
D) Home Improvement Loans
E) Loans on Dwellings For 5+ Families
F) Non-occupant Loans on < 5 Family Dwellings (A B C & D)
G) Loans On Manufactured Home Dwelling (A B C & D)
Number
Average Value
Number
Average Value
Number
Average Value
Number
Average Value
Number
Average Value
Number
Average Value
Number
Average Value
LOANS ORIGINATED
3
$452,930
302
$255,780
262
$256,599
36
$117,911
41
$1,849,527
65
$277,791
0
$0
APPLICATIONS APPROVED, NOT ACCEPTED
0
$0
73
$263,985
96
$249,948
14
$42,474
3
$517,967
13
$263,648
0
$0
APPLICATIONS DENIED
2
$465,910
214
$264,323
242
$270,398
65
$120,483
3
$467,397
56
$295,681
6
$309,633
APPLICATIONS WITHDRAWN
5
$492,354
151
$269,640
136
$252,124
9
$221,867
6
$725,595
26
$325,779
0
$0
FILES CLOSED FOR INCOMPLETENESS
0
$0
41
$261,935
60
$281,932
4
$85,555
1
$325,000
1
$360,000
0
$0
Aggregated Statistics For Year 2005 (Based on 11 full and 24 partial tracts)
A) FHA, FSA/RHS & VA Home Purchase Loans
B) Conventional Home Purchase Loans
C) Refinancings
D) Home Improvement Loans
E) Loans on Dwellings For 5+ Families
F) Non-occupant Loans on < 5 Family Dwellings (A B C & D)
G) Loans On Manufactured Home Dwelling (A B C & D)
Number
Average Value
Number
Average Value
Number
Average Value
Number
Average Value
Number
Average Value
Number
Average Value
Number
Average Value
LOANS ORIGINATED
9
$446,280
298
$222,603
270
$257,896
28
$118,351
31
$1,920,155
60
$272,944
0
$0
APPLICATIONS APPROVED, NOT ACCEPTED
3
$390,527
96
$244,497
81
$215,265
6
$76,365
2
$725,925
34
$278,363
2
$36,160
APPLICATIONS DENIED
2
$333,070
188
$238,295
291
$239,852
83
$101,338
9
$245,737
41
$222,899
3
$292,667
APPLICATIONS WITHDRAWN
4
$358,195
128
$255,353
166
$223,290
19
$195,080
6
$1,501,828
29
$249,660
0
$0
FILES CLOSED FOR INCOMPLETENESS
1
$337,020
56
$232,659
105
$222,089
3
$386,347
0
$0
11
$235,278
0
$0
Aggregated Statistics For Year 2004 (Based on 13 full and 24 partial tracts)
A) FHA, FSA/RHS & VA Home Purchase Loans
B) Conventional Home Purchase Loans
C) Refinancings
D) Home Improvement Loans
E) Loans on Dwellings For 5+ Families
F) Non-occupant Loans on < 5 Family Dwellings (A B C & D)
G) Loans On Manufactured Home Dwelling (A B C & D)
Number
Average Value
Number
Average Value
Number
Average Value
Number
Average Value
Number
Average Value
Number
Average Value
Number
Average Value
LOANS ORIGINATED
18
$363,296
248
$241,754
234
$193,969
32
$64,931
69
$1,128,276
52
$235,260
0
$0
APPLICATIONS APPROVED, NOT ACCEPTED
3
$453,690
73
$275,290
118
$202,922
7
$98,049
0
$0
22
$247,220
0
$0
APPLICATIONS DENIED
5
$296,596
118
$199,793
252
$201,047
92
$75,743
10
$2,096,371
51
$173,143
4
$68,772
APPLICATIONS WITHDRAWN
7
$374,854
65
$237,696
131
$209,304
6
$140,517
4
$1,758,632
33
$268,896
0
$0
FILES CLOSED FOR INCOMPLETENESS
3
$298,897
24
$209,889
55
$233,624
7
$101,457
1
$119,390
8
$237,882
0
$0
Aggregated Statistics For Year 2003 (Based on 13 full and 24 partial tracts)
A) FHA, FSA/RHS & VA Home Purchase Loans
B) Conventional Home Purchase Loans
C) Refinancings
D) Home Improvement Loans
E) Loans on Dwellings For 5+ Families
F) Non-occupant Loans on < 5 Family Dwellings (A B C & D)
Number
Average Value
Number
Average Value
Number
Average Value
Number
Average Value
Number
Average Value
Number
Average Value
LOANS ORIGINATED
43
$261,093
138
$196,555
186
$168,730
14
$72,541
28
$895,795
34
$172,874
APPLICATIONS APPROVED, NOT ACCEPTED
3
$288,380
27
$237,337
95
$174,613
10
$106,526
0
$0
11
$226,993
APPLICATIONS DENIED
6
$227,342
58
$175,236
199
$164,821
54
$30,702
7
$261,146
28
$173,810
APPLICATIONS WITHDRAWN
8
$247,724
46
$220,895
117
$172,487
8
$41,790
1
$100,000
13
$226,331
FILES CLOSED FOR INCOMPLETENESS
1
$417,850
4
$160,655
27
$174,582
0
$0
0
$0
1
$32,330
Aggregated Statistics For Year 2002 (Based on 13 full and 24 partial tracts)
A) FHA, FSA/RHS & VA Home Purchase Loans
B) Conventional Home Purchase Loans
C) Refinancings
D) Home Improvement Loans
E) Loans on Dwellings For 5+ Families
F) Non-occupant Loans on < 5 Family Dwellings (A B C & D)
Number
Average Value
Number
Average Value
Number
Average Value
Number
Average Value
Number
Average Value
Number
Average Value
LOANS ORIGINATED
48
$265,851
141
$146,050
124
$153,707
29
$29,943
32
$1,110,115
21
$189,882
APPLICATIONS APPROVED, NOT ACCEPTED
6
$232,682
26
$190,271
74
$145,181
8
$23,971
5
$172,724
12
$184,473
APPLICATIONS DENIED
1
$314,090
55
$165,299
143
$154,470
59
$19,439
5
$1,956,840
24
$170,378
APPLICATIONS WITHDRAWN
13
$254,087
34
$200,217
77
$140,507
24
$35,219
7
$2,025,986
15
$123,666
FILES CLOSED FOR INCOMPLETENESS
1
$126,310
11
$187,532
25
$176,167
0
$0
3
$627,990
1
$920
Aggregated Statistics For Year 2001 (Based on 11 full and 24 partial tracts)
A) FHA, FSA/RHS & VA Home Purchase Loans
B) Conventional Home Purchase Loans
C) Refinancings
D) Home Improvement Loans
E) Loans on Dwellings For 5+ Families
F) Non-occupant Loans on < 5 Family Dwellings (A B C & D)
Number
Average Value
Number
Average Value
Number
Average Value
Number
Average Value
Number
Average Value
Number
Average Value
LOANS ORIGINATED
38
$226,837
109
$141,147
86
$133,371
13
$27,856
12
$845,517
19
$142,867
APPLICATIONS APPROVED, NOT ACCEPTED
8
$194,325
24
$184,558
74
$105,428
15
$23,803
1
$83,000
5
$126,192
APPLICATIONS DENIED
19
$209,174
43
$162,467
153
$116,720
81
$21,990
5
$328,918
18
$207,415
APPLICATIONS WITHDRAWN
2
$187,000
24
$198,705
97
$113,256
22
$30,580
1
$499,000
7
$134,314
FILES CLOSED FOR INCOMPLETENESS
0
$0
1
$61,880
25
$176,918
2
$46,570
0
$0
0
$0
Aggregated Statistics For Year 2000 (Based on 13 full and 24 partial tracts)
A) FHA, FSA/RHS & VA Home Purchase Loans
B) Conventional Home Purchase Loans
C) Refinancings
D) Home Improvement Loans
E) Loans on Dwellings For 5+ Families
F) Non-occupant Loans on < 5 Family Dwellings (A B C & D)
Number
Average Value
Number
Average Value
Number
Average Value
Number
Average Value
Number
Average Value
Number
Average Value
LOANS ORIGINATED
36
$193,405
80
$114,524
38
$110,869
93
$9,532
39
$1,094,892
13
$118,908
APPLICATIONS APPROVED, NOT ACCEPTED
9
$2,160,296
19
$155,612
23
$111,058
20
$26,582
0
$0
5
$177,732
APPLICATIONS DENIED
9
$175,008
71
$168,947
143
$73,740
96
$22,611
7
$688,104
12
$167,426
APPLICATIONS WITHDRAWN
14
$182,174
22
$130,095
146
$104,602
7
$17,281
2
$26,480,690
13
$298,939
FILES CLOSED FOR INCOMPLETENESS
2
$259,540
4
$120,715
8
$109,966
1
$20,000
0
$0
1
$78,130
Aggregated Statistics For Year 1999 (Based on 6 full and 18 partial tracts)
A) FHA, FSA/RHS & VA Home Purchase Loans
B) Conventional Home Purchase Loans
C) Refinancings
D) Home Improvement Loans
E) Loans on Dwellings For 5+ Families
F) Non-occupant Loans on < 5 Family Dwellings (A B C & D)
2007 - 2018 National Fire Incident Reporting System (NFIRS) incidents
Based on the data from the years 2007 - 2018 the average number of fire incidents per year is 597. The highest number of fires - 780 took place in 2008, and the least - 410 in 2007. The data has a rising trend.
When looking into fire subcategories, the most incidents belonged to: Structure Fires (80.2%), and Outside Fires (12.0%).
Fire incident types reported to NFIRS in Zip Code 10456


 Nearest zip codes: 10455, 10459, 10452, 10451, 10457, 10453.


 Based on the data from the years 2007 - 2018 the average number of fire incidents per year is 597. The highest number of fires - 780 took place in 2008, and the least - 410 in 2007. The data has a rising trend.
 When looking into fire subcategories, the most incidents belonged to: Structure Fires (80.2%), and Outside Fires (12.0%).