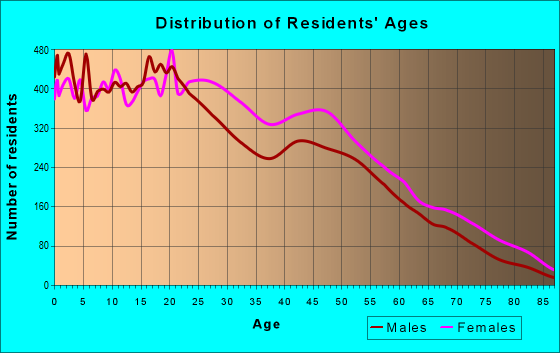
Estimated zip code population in 2022: 51,139 Zip code population in 2010: 47,308 Zip code population in 2000: 39,080
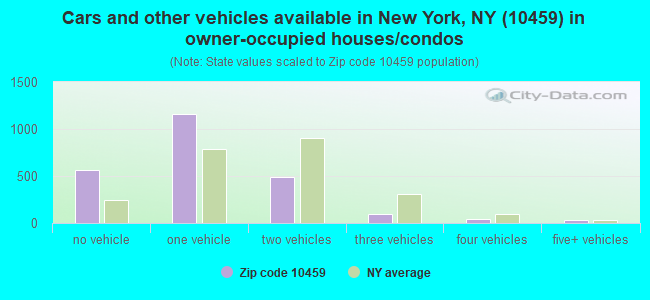
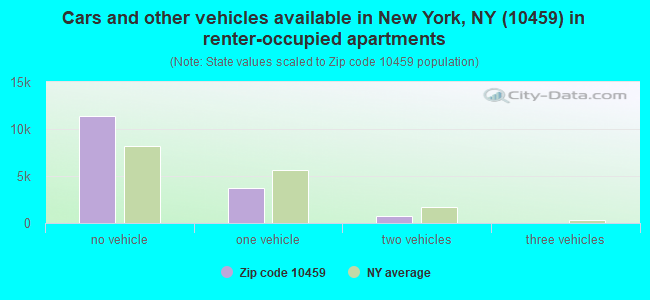
Houses and condos: 18,711 Renter-occupied apartments: 15,921
% of renters here:
87%
State:
46%
March 2022 cost of living index in zip code 10459: 158.0 (very high, U.S. average is 100)
Land area: 0.8 sq. mi. Water area: 0.0 sq. mi.
Population density: 62,596 people per square mile
(very high).
OSM Map
General Map
Google Map
MSN Map
OSM Map
General Map
Google Map
MSN Map
OSM Map
General Map
Google Map
MSN Map
OSM Map
General Map
Google Map
MSN Map
Please wait while loading the map...
Real estate property taxes paid for housing units in 2022:
This zip code:
0.8% ($4,679)
New York:
1.5% ($6,180)
Median real estate property taxes paid for housing units with mortgages in 2022: $4,619 (0.7%) Median real estate property taxes paid for housing units with no mortgage in 2022: $4,865 (1.0%)
Averages for the 2020 tax year for zip code 10459, filed in 2021:
Average Adjusted Gross Income (AGI) in 2020: $32,277 (Individual Income Tax Returns)
Here:
$32,277
State:
$90,930
Salary/wage: $32,479 (reported on 78.7% of returns)
Here:
$32,479
State:
$72,104
(% of AGI for various income ranges: 913.5% for AGIs below $25k, 3314.9% for AGIs $25k-50k, 6756.3% for AGIs $50k-75k, 10313.7% for AGIs $75k-100k, 17035.3% for AGIs $100k-200k)
Taxable interest for individuals: $188 (reported on 7.9% of returns)
This zip code:
$188
New York:
$3,075
(% of AGI for various income ranges: 1.1% for AGIs below $25k, 1.2% for AGIs $25k-50k, 2.6% for AGIs $50k-75k, 7.9% for AGIs $75k-100k, 13.7% for AGIs $100k-200k)
Ordinary dividends: $729 (reported on 1.9% of returns)
Here:
$729
State:
$11,095
(% of AGI for various income ranges: 1.1% for AGIs below $25k, 1.0% for AGIs $25k-50k, 1.9% for AGIs $50k-75k, 3.4% for AGIs $75k-100k, 26.8% for AGIs $100k-200k)
Net capital gain/loss in AGI: +$2,369 (reported on 2.8% of returns)
Here:
+$2,369
State:
+$44,925
(% of AGI for various income ranges: 0.8% for AGIs below $25k, 1.2% for AGIs $25k-50k, 9.7% for AGIs $50k-75k, 33.5% for AGIs $75k-100k, 248.7% for AGIs $100k-200k)
Profit/loss from business: +$5,183 (reported on 19.0% of returns)
Here:
+$5,183
State:
+$14,940
(% of AGI for various income ranges: 203.8% for AGIs below $25k, 60.8% for AGIs $25k-50k, 64.2% for AGIs $50k-75k, 77.5% for AGIs $75k-100k, 89.5% for AGIs $100k-200k)
Taxable individual retirement arrangement distribution: $9,988 (reported on 0.7% of returns)
10459:
$9,988
New York:
$19,609
(% of AGI for various income ranges: 3.5% for AGIs below $25k, 3.6% for AGIs $25k-50k, 13.0% for AGIs $50k-75k, 112.9% for AGIs $75k-100k)
Total itemized deductions: $24,172 (reported on 2.3% of returns)
Here:
$24,172
State:
$39,326
(% of AGI for various income ranges: 8.3% for AGIs below $25k, 29.5% for AGIs $25k-50k, 161.2% for AGIs $50k-75k, 392.9% for AGIs $75k-100k, 991.8% for AGIs $100k-200k)
Charity contributions: $7,970 (reported on 1.6% of returns)
Here:
$7,970
State:
$15,420
(% of AGI for various income ranges: 6.2% for AGIs $25k-50k, 37.0% for AGIs $50k-75k, 97.2% for AGIs $75k-100k, 267.9% for AGIs $100k-200k)
Taxes paid: $7,924 (reported on 2.3% of returns)
10459:
$7,924
State:
$9,183
(% of AGI for various income ranges: 1.7% for AGIs below $25k, 10.1% for AGIs $25k-50k, 47.6% for AGIs $50k-75k, 145.0% for AGIs $75k-100k, 362.9% for AGIs $100k-200k)
Earned income credit: $2,448 (reported on 33.5% of returns)
Here:
$2,448
State:
$2,138
(% of AGI for various income ranges: 154.4% for AGIs below $25k, 95.9% for AGIs $25k-50k, 0.7% for AGIs $50k-75k)
Percentage of individuals using paid preparers for their 2020 taxes: 94.6%
Here:
95%
State:
95%
(% for various income ranges: 93.0% for AGIs below $25k, 96.3% for AGIs $25k-50k, 95.4% for AGIs $50k-75k, 95.7% for AGIs $75k-100k, 96.7% for AGIs $100k-200k, 100.0% for AGIs over 200k)
Averages for the 2012 tax year for zip code 10459, filed in 2013:
Average Adjusted Gross Income (AGI) in 2012: $25,885 (Individual Income Tax Returns)
Here:
$25,885
State:
$77,088
Salary/wage: $27,412 (reported on 82.9% of returns)
Here:
$27,412
State:
$60,593
(% of AGI for various income ranges: 71.8% for AGIs below $25k, 95.7% for AGIs $25k-50k, 94.7% for AGIs $50k-75k, 92.4% for AGIs $75k-100k, 85.7% for AGIs $100k-200k)
Taxable interest for individuals: $171 (reported on 9.1% of returns)
This zip code:
$171
New York:
$3,125
(% of AGI for various income ranges: 0.1% for AGIs $100k-200k)
Ordinary dividends: $600 (reported on 1.4% of returns)
Here:
$600
State:
$10,299
(% of AGI for various income ranges: )
Profit/loss from business: +$8,270 (reported on 19.8% of returns)
Here:
+$8,270
State:
+$16,168
(% of AGI for various income ranges: 20.6% for AGIs below $25k, 0.8% for AGIs $25k-50k, 0.3% for AGIs $50k-75k, 0.2% for AGIs $75k-100k)
Taxable individual retirement arrangement distribution: $8,100 (reported on 0.8% of returns)
10459:
$8,100
New York:
$17,621
(% of AGI for various income ranges: 0.1% for AGIs below $25k, 0.2% for AGIs $25k-50k, 0.2% for AGIs $50k-75k, 1.4% for AGIs $75k-100k)
Total itemized deductions: $18,843 (36% of AGI, reported on 17.7% of returns)
Here:
$18,843
State:
$34,985
Here:
35.6% of AGI
State:
21.3% of AGI
(% of AGI for various income ranges: 2.7% for AGIs below $25k, 14.3% for AGIs $25k-50k, 20.9% for AGIs $50k-75k, 18.3% for AGIs $75k-100k, 20.1% for AGIs $100k-200k)
Charity contributions: $2,675 (reported on 14.1% of returns)
Here:
$2,675
State:
$5,572
(% of AGI for various income ranges: 0.3% for AGIs below $25k, 1.6% for AGIs $25k-50k, 2.4% for AGIs $50k-75k, 2.2% for AGIs $75k-100k, 2.2% for AGIs $100k-200k)
Taxes paid: $5,744 (reported on 17.7% of returns)
10459:
$5,744
State:
$18,656
(% of AGI for various income ranges: 0.4% for AGIs below $25k, 3.3% for AGIs $25k-50k, 7.2% for AGIs $50k-75k, 7.9% for AGIs $75k-100k, 9.0% for AGIs $100k-200k)
Earned income credit: $2,666 (reported on 46.8% of returns)
Here:
$2,666
State:
$2,230
(% of AGI for various income ranges: 14.5% for AGIs below $25k, 1.7% for AGIs $25k-50k)
Percentage of individuals using paid preparers for their 2012 taxes: 77.4%
Here:
77%
State:
66%
(% for various income ranges: 77.4% for AGIs below $25k, 76.5% for AGIs $25k-50k, 80.1% for AGIs $50k-75k, 74.5% for AGIs $75k-100k, 83.3% for AGIs $100k-200k)
Averages for the 2004 tax year for zip code 10459, filed in 2005:
Average Adjusted Gross Income (AGI) in 2004: $23,482 (Individual Income Tax Returns)
Here:
$23,482
State:
$59,519
Salary/wage: $24,629 (reported on 86.5% of returns)
Here:
$24,629
State:
$50,673
(% of AGI for various income ranges: 61.8% for AGIs below $10k, 86.4% for AGIs $10k-25k, 97.7% for AGIs $25k-50k, 96.2% for AGIs $50k-75k, 91.6% for AGIs $75k-100k, 69.2% for AGIs over 100k)
Taxable interest for individuals: $329 (reported on 15.2% of returns)
This zip code:
$329
New York:
$2,377
(% of AGI for various income ranges: 0.3% for AGIs below $10k, 0.2% for AGIs $10k-25k, 0.2% for AGIs $25k-50k, 0.2% for AGIs $50k-75k, 0.3% for AGIs $75k-100k, 0.2% for AGIs over 100k)
Taxable dividends: $382 (reported on 2.1% of returns)
Here:
$382
State:
$5,394
(% of AGI for various income ranges: 0.0% for AGIs below $10k, 0.0% for AGIs $10k-25k, 0.0% for AGIs $25k-50k, 0.0% for AGIs $50k-75k, 0.3% for AGIs $75k-100k, 0.1% for AGIs over 100k)
Net capital gain/loss: +$508 (reported on 1.3% of returns)
Here:
+$508
State:
+$23,581
(% of AGI for various income ranges: -0.0% for AGIs below $10k, -0.0% for AGIs $10k-25k, -0.1% for AGIs $25k-50k, -0.0% for AGIs $50k-75k, 0.1% for AGIs $75k-100k, 1.4% for AGIs over 100k)
Profit/loss from business: +$7,158 (reported on 17.4% of returns)
Here:
+$7,158
State:
+$13,809
(% of AGI for various income ranges: 37.7% for AGIs below $10k, 9.8% for AGIs $10k-25k, 0.4% for AGIs $25k-50k, 0.5% for AGIs $50k-75k, 0.0% for AGIs $75k-100k, 1.2% for AGIs over 100k)
IRA payment deduction: $1,818 (reported on 0.8% of returns)
10459:
$1,818
New York:
$3,115
Total itemized deductions: $15,470 (34% of AGI, reported on 20.4% of returns)
Here:
$15,470
State:
$25,864
Here:
33.8% of AGI
State:
21.9% of AGI
(% of AGI for various income ranges: 1.1% for AGIs below $10k, 4.8% for AGIs $10k-25k, 15.7% for AGIs $25k-50k, 21.5% for AGIs $50k-75k, 22.6% for AGIs $75k-100k, 21.2% for AGIs over 100k)
Charity contributions deductions: $2,872 (6% of AGI, reported on 18.7% of returns)
Here:
$2,872
State:
$4,439
Here:
6.1% of AGI
State:
3.6% of AGI
(% of AGI for various income ranges: 0.1% for AGIs below $10k, 0.8% for AGIs $10k-25k, 2.7% for AGIs $25k-50k, 3.7% for AGIs $50k-75k, 4.1% for AGIs $75k-100k, 2.9% for AGIs over 100k)
Total tax: $2,157 (reported on 57.5% of returns)
10459:
$2,157
State:
$11,730
(% of AGI for various income ranges: 5.7% for AGIs below $10k, 3.0% for AGIs $10k-25k, 4.3% for AGIs $25k-50k, 7.6% for AGIs $50k-75k, 10.1% for AGIs $75k-100k, 14.9% for AGIs over 100k)
Earned income credit: $2,096 (reported on 49.5% of returns)
Here:
$2,096
State:
$1,757
Percentage of individuals using paid preparers for their 2004 taxes: 74.6%
Here:
75%
State:
67%
(% for various income ranges: 75.8% for AGIs below $10k, 76.9% for AGIs $10k-25k, 71.1% for AGIs $25k-50k, 71.6% for AGIs $50k-75k, 72.8% for AGIs $75k-100k, 74.7% for AGIs over 100k)
Household received Food Stamps/SNAP in the past 12 months: 7,993 Household did not receive Food Stamps/SNAP in the past 12 months: 10,798
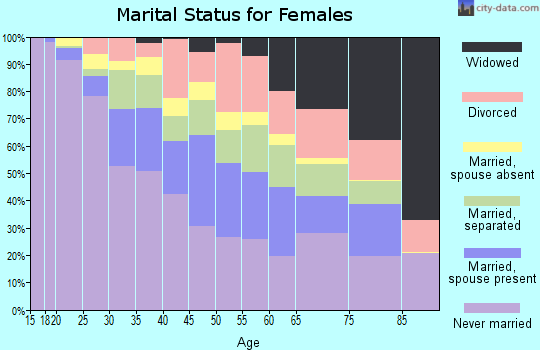
Women who had a birth in the past 12 months: 895 (305 now married, 607 unmarried) Women who did not have a birth in the past 12 months: 11,589 (2,957 now married, 8,692 unmarried)
Housing units in zip code 10459 with a mortgage: 1,704 (238 second mortgage, 112 home equity loan, 72 both second mortgage and home equity loan) Houses without a mortgage: 85
Median monthly owner costs for units with a mortgage: $2,768 Median monthly owner costs for units without a mortgage: $770
Residents with income below the poverty level in 2022:
This zip code:
32.2%
Whole state:
14.3%
Residents with income below 50% of the poverty level in 2022:
This zip code:
15.0%
Whole state:
6.8%
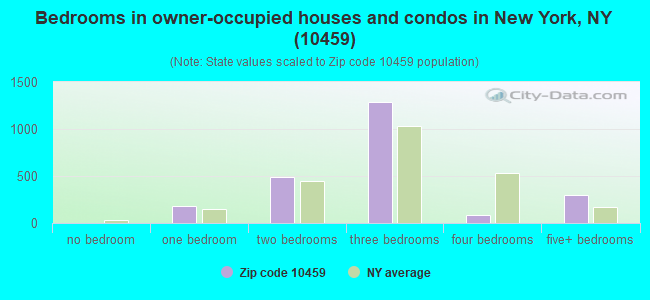
Median number of rooms in houses and condos:
Here:
5.3
State:
6.3
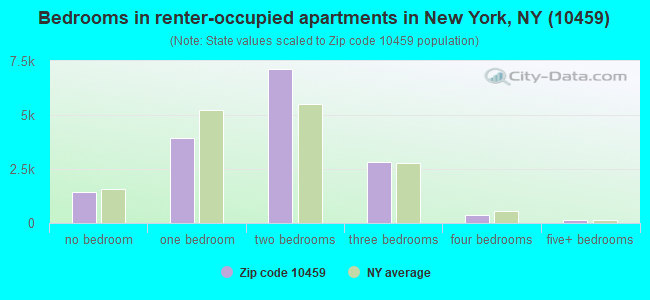
Median number of rooms in apartments:
Here:
3.9
State:
3.8
Notable locations in this zip code not listed on our city pages
Notable locations in zip code 10459: J A Steltz Square (A), Latken Square (B), Fire Department New York Engine 82 Ladder 31 (C), New York Ladder Company 31 (D), Fortyfirst Precinct Police Station (E), Police Athletic League Bronx Community Center (F), Hunt's Point Regional Branch New York Public Library (G). Display/hide their locations on the map
Churches in zip code 10459 include: Saint Anthony Roman Catholic Church (A), Saint Augustine Presbyterian Church (B), Assembly Christian Church (C), Christian and Missionary Church (D), Loyal Baptist Church (E), Rock of Salvation Christian Church (F), Spanish Intervale Seventh Day Adventist Church (G), Caldwell African Methodist Episcopal Zion Church (H), Home Street Presbyterian Church (I). Display/hide their locations on the map
Parks in zip code 10459 include: Longfellow Gardens (1), Benjamin Gladstone Square (2), Monsignor Del Valle Square (3), Bill Rainey Park (4), Dawson Playground (5), Lyons Square Playground (6), Hoe Garden (7), Sunnyvale Courts (8), Printers Park (9). Display/hide their locations on the map
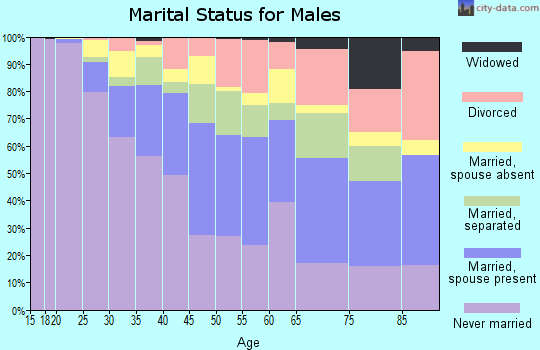
3,586 married couples with children.
6,279 single-parent households (748 men, 5,531 women).
32.7% of residents of 10459 zip code speak English at home.
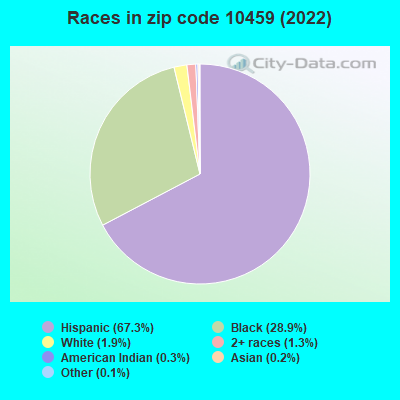
57.1% of residents speak Spanish at home (51% very well, 21% well, 18% not well, 10% not at all).
3.2% of residents speak other Indo-European language at home (67% very well, 30% well, 3% not well).
0.2% of residents speak Asian or Pacific Island language at home (9% very well, 23% not well, 68% not at all).
6.6% of residents speak other language at home (67% very well, 21% well, 12% not well, 1% not at all).
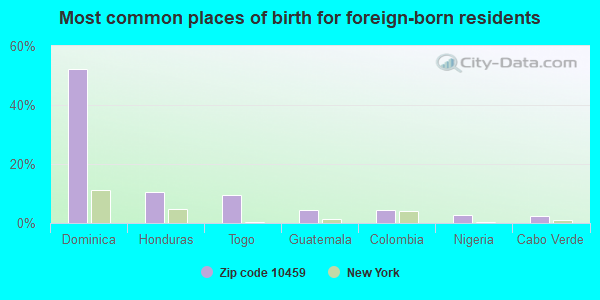
Foreign born population: 14,852 (29.0%) (51.3% of them are naturalized citizens)
This zip code:
29.0%
Whole state:
22.7%
52%Dominica
11%Honduras
10%Togo
4%Guatemala
4%Colombia
3%Nigeria
2%Cabo Verde
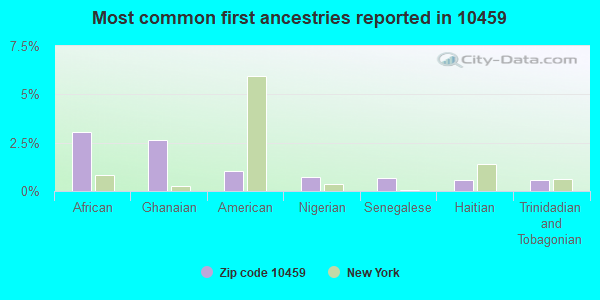
3%African
3%Ghanaian
1%American
1%Nigerian
1%Senegalese
1%Haitian
1%Trinidadian and Tobagonian
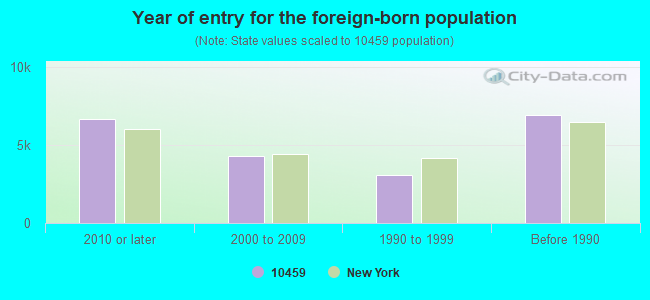
Year of entry for the foreign-born population
6,6772010 or later
4,3062000 to 2009
3,0851990 to 1999
6,912Before 1990
Major facilities with environmental interests located in this zip code:
AMBU TRANS HOLDING CORP (1028 FREEMAN STREET in BRONX, NY)
ENFORCEMENT/COMPLIANCE ACTIVITY (Integrated Compliance Information System) - ICIS-02-2003-7921, FORMAL ENFORCEMENT ACTION (Integrated Compliance Information System) - ICIS-02-2003-7921, FORMAL ENFORCEMENT ACTION Business SIC classification: LOCAL PASSENGER TRANSPORTATION
AMOCO-406230121005 (1360 BRUCKNER BLVD in BRONX, NY)
AIR MINOR (AIRS/AFS) STATE MASTER (New York facility tracking) - AIR PROGRAM (Resource Conservation and Recovery Act (tracking hazardous waste)) Business SIC classification: GASOLINE SERVICE STATIONS Organizations: AMOCO OIL CO (LEGALLY RESPONSIBLE PARTY)
Alternative names: AMOCO SERVICE STATION
ALDUS DRY CLEANERS (945 ALDUS ST in BRONX, NY)
AIR MINOR (AIRS/AFS) STATE MASTER (New York facility tracking) - AIR PROGRAM Conditionally Exempt Small Quantity Generators, less than 100 kg/month of hazardous waste (Resource Conservation and Recovery Act (tracking hazardous waste)) - notification Business SIC classification: DRYCLEANING PLANTS, EXCEPT RUG CLEANING Business NAICS classification: DRYCLEANING AND LAUNDRY SERVICES (EXCEPT COIN-OPERATED). Organizations: TONY GONZALES ZALE MANAGEMENT (CONTACT/OWNER)
AMOCO-517730448805 (1365-75 BOSTON POST in BRONX, NY)
AIR MINOR (AIRS/AFS) STATE MASTER (New York facility tracking) - AIR PROGRAM, Business SIC classification: GASOLINE SERVICE STATIONS Organizations: AMOCO OIL CO (LEGALLY RESPONSIBLE PARTY)
GETTY-T&B AUTO REPAIR SVC (185 LINCOLN AVE. in BRONX, NY)
AIR MINOR (AIRS/AFS) STATE MASTER (New York facility tracking) - AIR PROGRAM Business SIC classification: GASOLINE SERVICE STATIONS Organizations: LEEMILTS PETROLEUM INC (LEGALLY RESPONSIBLE PARTY)
Alternative names: GETTY T & B AUTO REP
A GUILD PAPER AND PLASTIC PRODUCTS COMPANY (1154 INTERVALE AVENUE in BRONX, NY)
AIR MINOR (AIRS/AFS) (Integrated Compliance Information System) - ICIS-02-1988-0356, FORMAL ENFORCEMENT ACTION Business SIC classification: PRINTING AND WRITING PAPER; INDUSTRIAL AND PERSONAL SERVICE PAPER; NONCLASSIFIABLE ESTABLISHMENTS
HOE AVENUE GROUP HOME ( in BRONX, NY)
(National Center for Education Statistics) - STATE ID-321200895021 Organizations: NEW YORK CITY PUBLIC SCHOOLS (SCHOOL DISTRICT)
IS 116 RAFAEL HERNANDEZ SCHOOL ( in BRONX, NY)
(National Center for Education Statistics) - STATE ID-321200010116 Organizations: NEW YORK CITY PUBLIC SCHOOLS (SCHOOL DISTRICT)
IS 216 SCH ENTRPNL STUDIES ( in BRONX, NY)
(National Center for Education Statistics) - STATE ID-321200010216 Organizations: NEW YORK CITY PUBLIC SCHOOLS (SCHOOL DISTRICT)
IS 217 SCH-PERFORMING ARTS ( in BRONX, NY)
(National Center for Education Statistics) - STATE ID-321200010217 Organizations: NEW YORK CITY PUBLIC SCHOOLS (SCHOOL DISTRICT)
CON EDISON - MH 11132 (LYDIG AVE & WHITE PLAINS RD. in BRONX, NY)
Large Quantity Generators, more that 1000 kg of hazardous waste/month (Resource Conservation and Recovery Act (tracking hazardous waste)) Organizations: CONSOLIDATED EDISON COMPANY OF NY, INC. (CONTACT/OPERATOR)
CON EDISON - MH 18620 (PROSPECT AVE. & E. 169TH ST. in BRONX, NY)
Large Quantity Generators, more that 1000 kg of hazardous waste/month (Resource Conservation and Recovery Act (tracking hazardous waste)) Organizations: CONSOLIDATED EDISON COMPANY OF NY, INC. (CONTACT/OPERATOR)
CON EDISON - MH MH-37 (WESTCHESTER AVE. & EAGLE AVE in BRONX, NY)
Large Quantity Generators, more that 1000 kg of hazardous waste/month (Resource Conservation and Recovery Act (tracking hazardous waste)) Organizations: CONSOLIDATED EDISON COMPANY OF NY, INC. (CONTACT/OPERATOR)
Housing units lacking complete plumbing facilities: 1.0% Housing units lacking complete kitchen facilities: 1.6%
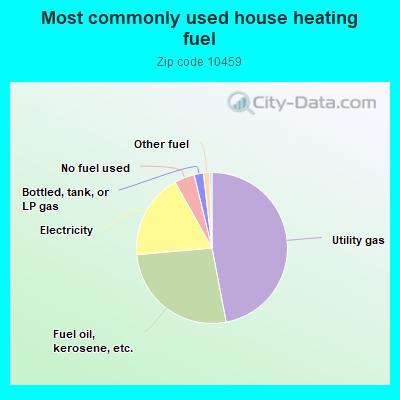
47.0%Utility gas
26.6%Fuel oil, kerosene, etc.
18.3%Electricity
4.3%No fuel used
2.0%Bottled, tank, or LP gas
1.3%Other fuel
Population in 1990: 30,983. Population change in the 1990s: +8,097 (+26.1%).
Place of birth for U.S.-born residents:
This state: 25,946
Northeast: 1,213
Midwest: 267
South: 2,642
West: 218
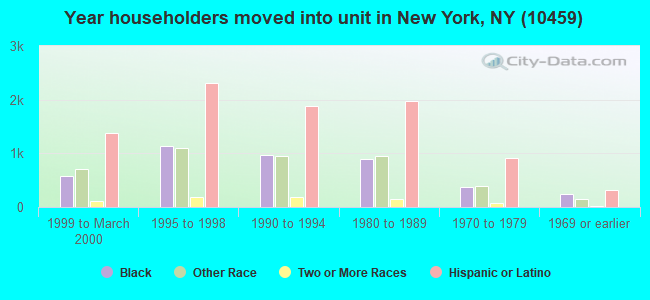
69% of the 10459 zip code residents lived in the same house 5 years ago. Out of people who lived in different houses, 74% lived in this county. Out of people who lived in different counties, 50% lived in New York.
93% of the 10459 zip code residents lived in the same house 1 year ago. Out of people who lived in different houses, 66% moved from this county. Out of people who lived in different houses, 14% moved from different county within same state. Out of people who lived in different houses, 8% moved from different state. Out of people who lived in different houses, 11% moved from abroad.
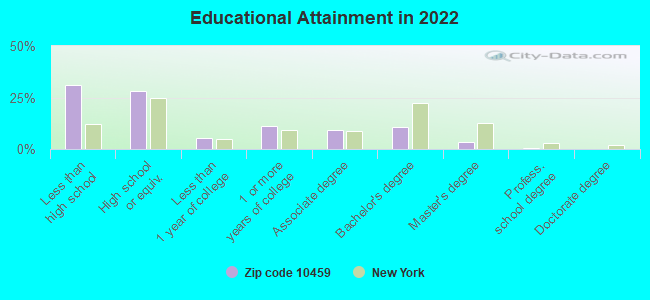
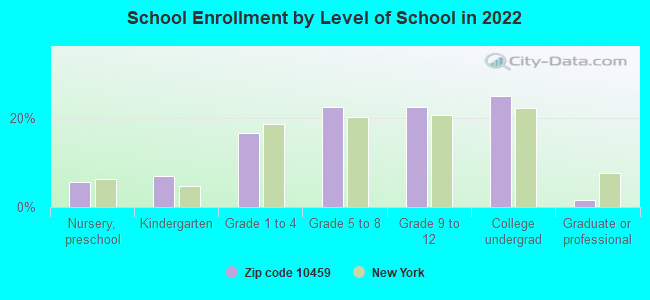
Private vs. public school enrollment:
Students in private schools in grades 1 to 8 (elementary and middle school): 530
Here:
9.4%
New York:
15.6%
Students in private schools in grades 9 to 12 (high school): 292
Here:
8.9%
New York:
15.0%
Students in private undergraduate colleges: 1,019
Here:
28.3%
New York:
39.2%
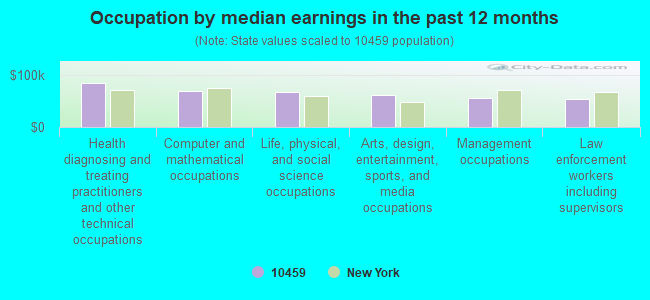
Occupation by median earnings in the past 12 months ($)
83,859Health diagnosing and treating practitioners and other technical occupations
67,833Computer and mathematical occupations
65,917Life, physical, and social science occupations
61,629Arts, design, entertainment, sports, and media occupations
56,126Management occupations
54,305Law enforcement workers including supervisors
Companies with federal contracts located in this zip code:
ABALON PRECISION MFG CORP (1040 HOME ST in BRONX, NY; small business) : $8,398 in 2 contractsfrom 2004 to 2005
$5,285 with Defense Logistics Agency for Fans, Air Circulators, and Blower Equipment. Signed on 2005-01-05. Completion date: 2005-03-07.
$3,113 with Defense Logistics Agency for Hardware, Commercial. Signed on 2004-11-30. Completion date: 2005-01-15.
Top industries in this zip code by the number of employees in 2005:
Health Care and Social Assistance: Nursing Care Facilities (250-499 employees: 1 establishment)
Real Estate and Rental and Leasing: Residential Property Managers (100-249: 1, 50-99: 1, 1-4: 8)
Administrative and Support and Waste Management and Remediation Services: Security Guards and Patrol Services (100-249: 1, 50-99: 1)
Real Estate and Rental and Leasing: Lessors of Residential Buildings and Dwellings (20-49: 1, 10-19: 1, 5-9: 7, 1-4: 43)
Other Services (except Public Administration): Other Social Advocacy Organizations (100-249: 1, 5-9: 2)
Health Care and Social Assistance: Ambulance Services (100-249: 1)
Health Care and Social Assistance: Services for the Elderly and Persons with Disabilities (50-99: 1, 20-49: 2, 10-19: 1)
Health Care and Social Assistance: Child Day Care Services (20-49: 4, 1-4: 1)
People in group quarters in 2010:
639 people in emergency and transitional shelters (with sleeping facilities) for people experiencing homelessness
359 people in other noninstitutional facilities
189 people in nursing facilities/skilled-nursing facilities
70 people in group homes intended for adults
69 people in residential treatment centers for adults
People in group quarters in 2000:
274 people in other noninstitutional group quarters
200 people in nursing homes
46 people in wards in general hospitals for patients who have no usual home elsewhere
43 people in other group homes
40 people in mental (psychiatric) hospitals or wards
36 people in homes for the mentally retarded
18 people in religious group quarters
7 people in homes for the mentally ill
Fatal accident statistics in 2014:
Fatal accident count: 1
Vehicles involved in fatal accidents: 1
Fatal accidents caused by drunken drivers: 0
Fatalities: 1
Persons involved in fatal accidents: 1
Pedestrians involved in fatal accidents: 0
Fatal accident statistics in 2011:
Fatal accident count: 1
Vehicles involved in fatal accidents: 1
Fatal accidents caused by drunken drivers: 0
Fatalities: 1
Persons involved in fatal accidents: 1
Pedestrians involved in fatal accidents: 1
Home Mortgage Disclosure Act Aggregated Statistics For Year 2009 (Based on 14 full and 12 partial tracts)
A) FHA, FSA/RHS & VA Home Purchase Loans
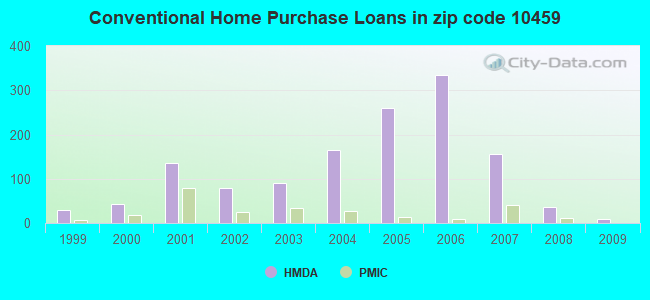
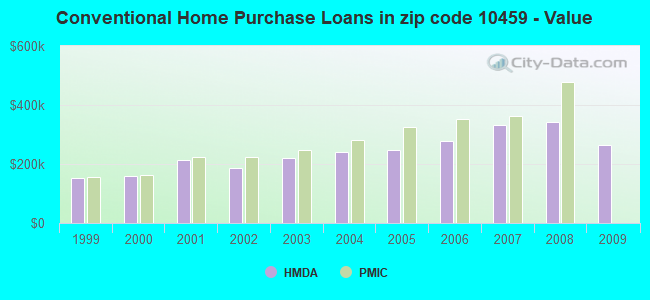
B) Conventional Home Purchase Loans
C) Refinancings
D) Home Improvement Loans
E) Loans on Dwellings For 5+ Families
F) Non-occupant Loans on < 5 Family Dwellings (A B C & D)
G) Loans On Manufactured Home Dwelling (A B C & D)
Number
Average Value
Number
Average Value
Number
Average Value
Number
Average Value
Number
Average Value
Number
Average Value
Number
Average Value
LOANS ORIGINATED
35
$284,284
9
$263,161
49
$298,734
6
$93,155
2
$497,500
4
$704,650
2
$265,500
APPLICATIONS APPROVED, NOT ACCEPTED
7
$299,739
2
$191,215
14
$258,824
6
$227,028
0
$0
3
$231,477
0
$0
APPLICATIONS DENIED
25
$383,484
8
$181,772
83
$313,263
26
$100,022
2
$715,000
12
$311,042
0
$0
APPLICATIONS WITHDRAWN
12
$340,943
5
$270,656
25
$313,105
0
$0
0
$0
5
$233,010
0
$0
FILES CLOSED FOR INCOMPLETENESS
5
$444,278
2
$268,515
7
$348,106
1
$250,000
0
$0
0
$0
0
$0
Aggregated Statistics For Year 2008 (Based on 13 full and 12 partial tracts)
A) FHA, FSA/RHS & VA Home Purchase Loans
B) Conventional Home Purchase Loans
C) Refinancings
D) Home Improvement Loans
E) Loans on Dwellings For 5+ Families
F) Non-occupant Loans on < 5 Family Dwellings (A B C & D)
G) Loans On Manufactured Home Dwelling (A B C & D)
Number
Average Value
Number
Average Value
Number
Average Value
Number
Average Value
Number
Average Value
Number
Average Value
Number
Average Value
LOANS ORIGINATED
7
$394,176
37
$341,251
80
$314,962
15
$131,125
11
$1,844,304
18
$370,630
0
$0
APPLICATIONS APPROVED, NOT ACCEPTED
3
$350,927
16
$406,923
36
$271,916
5
$214,848
3
$3,131,283
10
$449,867
0
$0
APPLICATIONS DENIED
11
$506,955
46
$337,112
166
$376,708
46
$158,113
6
$1,824,003
38
$342,488
0
$0
APPLICATIONS WITHDRAWN
8
$394,989
10
$322,535
38
$463,697
5
$205,716
0
$0
10
$754,886
2
$531,945
FILES CLOSED FOR INCOMPLETENESS
1
$676,940
10
$453,958
21
$292,260
5
$211,204
0
$0
7
$374,923
0
$0
Aggregated Statistics For Year 2007 (Based on 14 full and 14 partial tracts)
A) FHA, FSA/RHS & VA Home Purchase Loans
B) Conventional Home Purchase Loans
C) Refinancings
D) Home Improvement Loans
E) Loans on Dwellings For 5+ Families
F) Non-occupant Loans on < 5 Family Dwellings (A B C & D)
G) Loans On Manufactured Home Dwelling (A B C & D)
Number
Average Value
Number
Average Value
Number
Average Value
Number
Average Value
Number
Average Value
Number
Average Value
Number
Average Value
LOANS ORIGINATED
4
$451,962
157
$332,106
196
$309,299
36
$147,169
15
$2,071,579
34
$303,294
0
$0
APPLICATIONS APPROVED, NOT ACCEPTED
0
$0
56
$310,226
80
$336,065
16
$106,998
2
$1,864,690
18
$311,022
0
$0
APPLICATIONS DENIED
0
$0
171
$347,972
275
$339,754
58
$203,584
4
$2,122,012
64
$388,971
1
$47,450
APPLICATIONS WITHDRAWN
1
$544,000
52
$364,926
87
$298,264
8
$215,078
5
$3,469,420
15
$363,969
0
$0
FILES CLOSED FOR INCOMPLETENESS
0
$0
20
$383,784
49
$316,132
6
$188,223
1
$203,040
9
$376,307
0
$0
Aggregated Statistics For Year 2006 (Based on 14 full and 12 partial tracts)
A) FHA, FSA/RHS & VA Home Purchase Loans
B) Conventional Home Purchase Loans
C) Refinancings
D) Home Improvement Loans
E) Loans on Dwellings For 5+ Families
F) Non-occupant Loans on < 5 Family Dwellings (A B C & D)
G) Loans On Manufactured Home Dwelling (A B C & D)
Number
Average Value
Number
Average Value
Number
Average Value
Number
Average Value
Number
Average Value
Number
Average Value
Number
Average Value
LOANS ORIGINATED
5
$423,540
334
$278,590
269
$273,923
38
$120,821
23
$1,350,045
53
$300,699
0
$0
APPLICATIONS APPROVED, NOT ACCEPTED
0
$0
65
$263,679
106
$271,378
7
$169,339
0
$0
14
$324,214
0
$0
APPLICATIONS DENIED
2
$306,090
198
$295,469
286
$278,248
62
$124,545
5
$2,347,426
55
$269,077
2
$80,855
APPLICATIONS WITHDRAWN
4
$362,345
119
$294,155
171
$278,533
9
$194,464
2
$756,220
17
$294,454
0
$0
FILES CLOSED FOR INCOMPLETENESS
0
$0
26
$279,576
72
$283,523
1
$50,760
0
$0
9
$328,219
1
$105,000
Aggregated Statistics For Year 2005 (Based on 14 full and 12 partial tracts)
A) FHA, FSA/RHS & VA Home Purchase Loans
B) Conventional Home Purchase Loans
C) Refinancings
D) Home Improvement Loans
E) Loans on Dwellings For 5+ Families
F) Non-occupant Loans on < 5 Family Dwellings (A B C & D)
G) Loans On Manufactured Home Dwelling (A B C & D)
Number
Average Value
Number
Average Value
Number
Average Value
Number
Average Value
Number
Average Value
Number
Average Value
Number
Average Value
LOANS ORIGINATED
15
$390,959
261
$245,900
281
$257,729
41
$147,743
18
$862,907
78
$261,140
0
$0
APPLICATIONS APPROVED, NOT ACCEPTED
2
$316,210
85
$278,941
88
$229,866
7
$175,103
1
$120,000
14
$307,810
0
$0
APPLICATIONS DENIED
3
$500,327
131
$269,978
300
$241,618
74
$101,623
3
$281,470
50
$219,697
1
$275,000
APPLICATIONS WITHDRAWN
9
$394,967
109
$258,665
164
$239,053
17
$223,471
4
$1,089,708
35
$287,706
0
$0
FILES CLOSED FOR INCOMPLETENESS
2
$396,230
35
$272,901
129
$247,677
0
$0
0
$0
10
$244,840
0
$0
Aggregated Statistics For Year 2004 (Based on 14 full and 14 partial tracts)
A) FHA, FSA/RHS & VA Home Purchase Loans
B) Conventional Home Purchase Loans
C) Refinancings
D) Home Improvement Loans
E) Loans on Dwellings For 5+ Families
F) Non-occupant Loans on < 5 Family Dwellings (A B C & D)
G) Loans On Manufactured Home Dwelling (A B C & D)
Number
Average Value
Number
Average Value
Number
Average Value
Number
Average Value
Number
Average Value
Number
Average Value
Number
Average Value
LOANS ORIGINATED
14
$347,032
164
$240,017
237
$205,716
33
$60,976
18
$926,545
40
$232,066
0
$0
APPLICATIONS APPROVED, NOT ACCEPTED
4
$299,222
58
$281,927
107
$173,559
18
$85,619
3
$1,409,863
18
$254,945
0
$0
APPLICATIONS DENIED
11
$405,415
89
$259,744
230
$204,759
75
$92,257
1
$708,600
32
$211,912
2
$198,435
APPLICATIONS WITHDRAWN
9
$344,606
58
$256,597
131
$208,606
11
$164,864
2
$1,375,000
26
$278,568
0
$0
FILES CLOSED FOR INCOMPLETENESS
3
$252,640
14
$205,699
67
$222,441
3
$185,103
1
$40,610
4
$303,565
0
$0
Aggregated Statistics For Year 2003 (Based on 14 full and 14 partial tracts)
A) FHA, FSA/RHS & VA Home Purchase Loans
B) Conventional Home Purchase Loans
C) Refinancings
D) Home Improvement Loans
E) Loans on Dwellings For 5+ Families
F) Non-occupant Loans on < 5 Family Dwellings (A B C & D)
Number
Average Value
Number
Average Value
Number
Average Value
Number
Average Value
Number
Average Value
Number
Average Value
LOANS ORIGINATED
52
$306,856
91
$220,632
229
$167,869
12
$44,047
14
$921,291
31
$225,122
APPLICATIONS APPROVED, NOT ACCEPTED
5
$261,930
41
$239,875
124
$173,891
15
$96,009
1
$500,000
15
$205,100
APPLICATIONS DENIED
5
$258,146
51
$217,052
268
$167,045
39
$47,304
1
$399,250
35
$191,415
APPLICATIONS WITHDRAWN
10
$301,302
37
$227,075
125
$180,277
11
$54,050
2
$994,500
8
$265,349
FILES CLOSED FOR INCOMPLETENESS
0
$0
4
$185,438
33
$163,852
4
$92,730
1
$368,000
5
$115,600
Aggregated Statistics For Year 2002 (Based on 14 full and 14 partial tracts)
A) FHA, FSA/RHS & VA Home Purchase Loans
B) Conventional Home Purchase Loans
C) Refinancings
D) Home Improvement Loans
E) Loans on Dwellings For 5+ Families
F) Non-occupant Loans on < 5 Family Dwellings (A B C & D)
Number
Average Value
Number
Average Value
Number
Average Value
Number
Average Value
Number
Average Value
Number
Average Value
LOANS ORIGINATED
28
$257,569
78
$186,428
131
$140,351
22
$39,563
24
$768,337
11
$165,186
APPLICATIONS APPROVED, NOT ACCEPTED
9
$275,434
28
$190,490
66
$146,009
12
$27,285
2
$741,355
7
$185,290
APPLICATIONS DENIED
7
$253,591
54
$187,144
151
$157,904
46
$40,925
4
$1,413,908
15
$203,315
APPLICATIONS WITHDRAWN
7
$259,927
19
$177,852
93
$154,491
11
$33,937
2
$2,343,850
4
$165,645
FILES CLOSED FOR INCOMPLETENESS
3
$110,553
9
$179,699
25
$147,109
1
$25,000
0
$0
2
$44,645
Aggregated Statistics For Year 2001 (Based on 14 full and 14 partial tracts)
A) FHA, FSA/RHS & VA Home Purchase Loans
B) Conventional Home Purchase Loans
C) Refinancings
D) Home Improvement Loans
E) Loans on Dwellings For 5+ Families
F) Non-occupant Loans on < 5 Family Dwellings (A B C & D)
Number
Average Value
Number
Average Value
Number
Average Value
Number
Average Value
Number
Average Value
Number
Average Value
LOANS ORIGINATED
24
$210,477
136
$213,106
99
$137,195
21
$30,463
18
$911,186
9
$120,956
APPLICATIONS APPROVED, NOT ACCEPTED
2
$121,975
20
$152,400
56
$101,647
13
$25,414
1
$112,000
4
$65,402
APPLICATIONS DENIED
9
$222,546
66
$181,225
148
$126,985
45
$30,049
4
$562,500
18
$197,254
APPLICATIONS WITHDRAWN
9
$263,351
12
$201,048
75
$123,337
23
$41,129
0
$0
7
$156,140
FILES CLOSED FOR INCOMPLETENESS
4
$256,478
2
$248,915
19
$120,157
0
$0
0
$0
0
$0
Aggregated Statistics For Year 2000 (Based on 14 full and 14 partial tracts)
A) FHA, FSA/RHS & VA Home Purchase Loans
B) Conventional Home Purchase Loans
C) Refinancings
D) Home Improvement Loans
E) Loans on Dwellings For 5+ Families
F) Non-occupant Loans on < 5 Family Dwellings (A B C & D)
Number
Average Value
Number
Average Value
Number
Average Value
Number
Average Value
Number
Average Value
Number
Average Value
LOANS ORIGINATED
20
$218,819
43
$158,335
46
$105,058
45
$17,186
16
$726,065
11
$155,741
APPLICATIONS APPROVED, NOT ACCEPTED
5
$228,162
14
$172,386
43
$135,930
11
$21,049
0
$0
6
$224,272
APPLICATIONS DENIED
5
$193,428
43
$136,979
147
$93,551
55
$30,139
4
$401,570
14
$176,438
APPLICATIONS WITHDRAWN
12
$220,875
14
$123,025
112
$90,803
5
$19,880
6
$3,288,600
3
$193,073
FILES CLOSED FOR INCOMPLETENESS
1
$174,000
4
$146,088
9
$135,888
0
$0
0
$0
0
$0
Aggregated Statistics For Year 1999 (Based on 10 full and 9 partial tracts)
A) FHA, FSA/RHS & VA Home Purchase Loans
B) Conventional Home Purchase Loans
C) Refinancings
D) Home Improvement Loans
E) Loans on Dwellings For 5+ Families
F) Non-occupant Loans on < 5 Family Dwellings (A B C & D)
2007 - 2018 National Fire Incident Reporting System (NFIRS) incidents
Based on the data from the years 2007 - 2018 the average number of fire incidents per year is 271. The highest number of fires - 310 took place in 2016, and the least - 165 in 2007. The data has a rising trend.
When looking into fire subcategories, the most incidents belonged to: Structure Fires (74.8%), and Outside Fires (15.9%).
Fire incident types reported to NFIRS in Zip Code 10459


 Nearest zip codes: 10456, 10474, 10455, 10460, 10457, 10472.
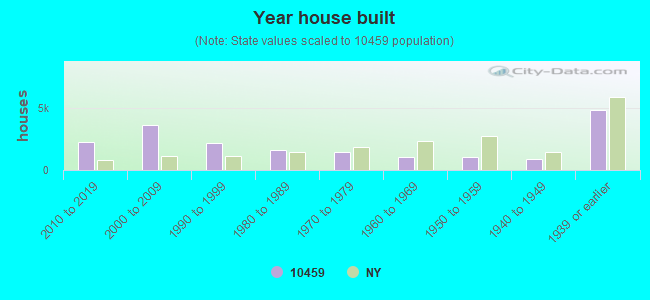


 Based on the data from the years 2007 - 2018 the average number of fire incidents per year is 271. The highest number of fires - 310 took place in 2016, and the least - 165 in 2007. The data has a rising trend.
 When looking into fire subcategories, the most incidents belonged to: Structure Fires (74.8%), and Outside Fires (15.9%).