Averages for the 2020 tax year for zip code 10457, filed in 2021:
Average Adjusted Gross Income (AGI) in 2020: $31,042 (Individual Income Tax Returns)
Here:
$31,042
State:
$90,930
Salary/wage: $31,315 (reported on 76.3% of returns)
Here:
$31,315
State:
$72,104
(% of AGI for various income ranges: 870.2% for AGIs below $25k, 3252.4% for AGIs $25k-50k, 6631.5% for AGIs $50k-75k, 10412.9% for AGIs $75k-100k, 16135.6% for AGIs $100k-200k, 83145.0% for AGIs over 200k)
Taxable interest for individuals: $193 (reported on 8.2% of returns)
This zip code:
$193
New York:
$3,075
(% of AGI for various income ranges: 1.5% for AGIs below $25k, 1.5% for AGIs $25k-50k, 2.6% for AGIs $50k-75k, 4.8% for AGIs $75k-100k, 14.4% for AGIs $100k-200k, 105.0% for AGIs over 200k)
Ordinary dividends: $1,082 (reported on 1.8% of returns)
Here:
$1,082
State:
$11,095
(% of AGI for various income ranges: 0.8% for AGIs below $25k, 1.0% for AGIs $25k-50k, 3.5% for AGIs $50k-75k, 4.6% for AGIs $75k-100k, 57.4% for AGIs $100k-200k, 200.0% for AGIs over 200k)
Net capital gain/loss in AGI: +$1,589 (reported on 2.6% of returns)
Here:
+$1,589
State:
+$44,925
(% of AGI for various income ranges: 0.4% for AGIs $25k-50k, 6.0% for AGIs $50k-75k, 32.8% for AGIs $75k-100k, 74.4% for AGIs $100k-200k, 2845.0% for AGIs over 200k)
Profit/loss from business: +$4,921 (reported on 20.7% of returns)
Here:
+$4,921
State:
+$14,940
(% of AGI for various income ranges: 210.8% for AGIs below $25k, 58.3% for AGIs $25k-50k, 57.9% for AGIs $50k-75k, 29.0% for AGIs $75k-100k, 123.7% for AGIs $100k-200k, 3820.0% for AGIs over 200k)
Taxable individual retirement arrangement distribution: $9,355 (reported on 0.6% of returns)
10457:
$9,355
New York:
$19,609
(% of AGI for various income ranges: 3.1% for AGIs below $25k, 3.3% for AGIs $25k-50k, 12.8% for AGIs $50k-75k, 33.8% for AGIs $75k-100k, 107.8% for AGIs $100k-200k)
Total itemized deductions: $24,655 (reported on 2.0% of returns)
Here:
$24,655
State:
$39,326
(% of AGI for various income ranges: 10.5% for AGIs below $25k, 35.8% for AGIs $25k-50k, 124.1% for AGIs $50k-75k, 324.4% for AGIs $75k-100k, 858.0% for AGIs $100k-200k, 5775.0% for AGIs over 200k)
Charity contributions: $9,560 (reported on 1.3% of returns)
Here:
$9,560
State:
$15,420
(% of AGI for various income ranges: 0.5% for AGIs below $25k, 8.9% for AGIs $25k-50k, 35.3% for AGIs $50k-75k, 79.4% for AGIs $75k-100k, 315.6% for AGIs $100k-200k)
Taxes paid: $7,414 (reported on 2.0% of returns)
10457:
$7,414
State:
$9,183
(% of AGI for various income ranges: 1.6% for AGIs below $25k, 9.6% for AGIs $25k-50k, 39.4% for AGIs $50k-75k, 113.2% for AGIs $75k-100k, 293.5% for AGIs $100k-200k, 1340.0% for AGIs over 200k)
Earned income credit: $2,568 (reported on 36.0% of returns)
Here:
$2,568
State:
$2,138
(% of AGI for various income ranges: 173.8% for AGIs below $25k, 104.1% for AGIs $25k-50k, 1.3% for AGIs $50k-75k)
Percentage of individuals using paid preparers for their 2020 taxes: 95.0%
Here:
95%
State:
95%
(% for various income ranges: 93.3% for AGIs below $25k, 97.1% for AGIs $25k-50k, 96.0% for AGIs $50k-75k, 94.4% for AGIs $75k-100k, 96.2% for AGIs $100k-200k, 100.0% for AGIs over 200k)
Averages for the 2012 tax year for zip code 10457, filed in 2013:
Average Adjusted Gross Income (AGI) in 2012: $23,696 (Individual Income Tax Returns)
Here:
$23,696
State:
$77,088
Salary/wage: $25,606 (reported on 78.6% of returns)
Here:
$25,606
State:
$60,593
(% of AGI for various income ranges: 68.2% for AGIs below $25k, 94.7% for AGIs $25k-50k, 92.8% for AGIs $50k-75k, 94.3% for AGIs $75k-100k, 85.8% for AGIs $100k-200k)
Taxable interest for individuals: $262 (reported on 8.0% of returns)
This zip code:
$262
New York:
$3,125
(% of AGI for various income ranges: 0.3% for AGIs $100k-200k)
Ordinary dividends: $1,343 (reported on 1.4% of returns)
Here:
$1,343
State:
$10,299
(% of AGI for various income ranges: 0.5% for AGIs $100k-200k)
Profit/loss from business: +$8,634 (reported on 24.3% of returns)
Here:
+$8,634
State:
+$16,168
(% of AGI for various income ranges: 25.1% for AGIs below $25k, 0.8% for AGIs $25k-50k, 0.5% for AGIs $50k-75k, 0.3% for AGIs $75k-100k, 0.1% for AGIs $100k-200k)
Taxable individual retirement arrangement distribution: $8,918 (reported on 0.7% of returns)
10457:
$8,918
New York:
$17,621
(% of AGI for various income ranges: 0.2% for AGIs below $25k, 0.2% for AGIs $25k-50k, 0.3% for AGIs $50k-75k, 0.9% for AGIs $75k-100k)
Total itemized deductions: $17,437 (33% of AGI, reported on 14.1% of returns)
Here:
$17,437
State:
$34,985
Here:
32.7% of AGI
State:
21.3% of AGI
(% of AGI for various income ranges: 2.0% for AGIs below $25k, 11.3% for AGIs $25k-50k, 17.0% for AGIs $50k-75k, 22.8% for AGIs $75k-100k, 17.0% for AGIs $100k-200k)
Charity contributions: $3,014 (reported on 10.5% of returns)
Here:
$3,014
State:
$5,572
(% of AGI for various income ranges: 0.2% for AGIs below $25k, 1.5% for AGIs $25k-50k, 2.3% for AGIs $50k-75k, 2.6% for AGIs $75k-100k, 2.6% for AGIs $100k-200k)
Taxes paid: $5,344 (reported on 14.0% of returns)
10457:
$5,344
State:
$18,656
(% of AGI for various income ranges: 0.3% for AGIs below $25k, 2.4% for AGIs $25k-50k, 5.7% for AGIs $50k-75k, 9.4% for AGIs $75k-100k, 8.6% for AGIs $100k-200k)
Earned income credit: $2,805 (reported on 51.5% of returns)
Here:
$2,805
State:
$2,230
(% of AGI for various income ranges: 16.1% for AGIs below $25k, 1.9% for AGIs $25k-50k)
Percentage of individuals using paid preparers for their 2012 taxes: 77.5%
Here:
78%
State:
66%
(% for various income ranges: 78.1% for AGIs below $25k, 76.6% for AGIs $25k-50k, 77.3% for AGIs $50k-75k, 70.3% for AGIs $75k-100k, 75.0% for AGIs $100k-200k)
Averages for the 2004 tax year for zip code 10457, filed in 2005:
Average Adjusted Gross Income (AGI) in 2004: $21,621 (Individual Income Tax Returns)
Here:
$21,621
State:
$59,519
Salary/wage: $23,166 (reported on 82.7% of returns)
Here:
$23,166
State:
$50,673
(% of AGI for various income ranges: 57.2% for AGIs below $10k, 82.3% for AGIs $10k-25k, 96.7% for AGIs $25k-50k, 94.9% for AGIs $50k-75k, 93.0% for AGIs $75k-100k, 84.3% for AGIs over 100k)
Taxable interest for individuals: $403 (reported on 11.9% of returns)
This zip code:
$403
New York:
$2,377
(% of AGI for various income ranges: 0.5% for AGIs below $10k, 0.2% for AGIs $10k-25k, 0.2% for AGIs $25k-50k, 0.2% for AGIs $50k-75k, 0.2% for AGIs $75k-100k, 0.5% for AGIs over 100k)
Taxable dividends: $625 (reported on 1.8% of returns)
Here:
$625
State:
$5,394
(% of AGI for various income ranges: 0.0% for AGIs below $10k, 0.1% for AGIs $10k-25k, 0.0% for AGIs $25k-50k, 0.1% for AGIs $50k-75k, 0.1% for AGIs $75k-100k, 0.1% for AGIs over 100k)
Profit/loss from business: +$7,812 (reported on 21.7% of returns)
Here:
+$7,812
State:
+$13,809
(% of AGI for various income ranges: 43.4% for AGIs below $10k, 14.1% for AGIs $10k-25k, 0.6% for AGIs $25k-50k, 0.1% for AGIs $50k-75k, 0.4% for AGIs $75k-100k, 1.6% for AGIs over 100k)
IRA payment deduction: $1,819 (reported on 0.6% of returns)
10457:
$1,819
New York:
$3,115
Total itemized deductions: $16,818 (38% of AGI, reported on 17.3% of returns)
Here:
$16,818
State:
$25,864
Here:
38.0% of AGI
State:
21.9% of AGI
(% of AGI for various income ranges: 0.6% for AGIs below $10k, 3.8% for AGIs $10k-25k, 18.6% for AGIs $25k-50k, 20.5% for AGIs $50k-75k, 22.8% for AGIs $75k-100k, 20.9% for AGIs over 100k)
Charity contributions deductions: $3,117 (7% of AGI, reported on 15.7% of returns)
Here:
$3,117
State:
$4,439
Here:
6.9% of AGI
State:
3.6% of AGI
(% of AGI for various income ranges: 0.1% for AGIs below $10k, 0.6% for AGIs $10k-25k, 2.8% for AGIs $25k-50k, 3.9% for AGIs $50k-75k, 4.3% for AGIs $75k-100k, 4.1% for AGIs over 100k)
Total tax: $1,995 (reported on 57.5% of returns)
10457:
$1,995
State:
$11,730
(% of AGI for various income ranges: 6.5% for AGIs below $10k, 3.4% for AGIs $10k-25k, 4.3% for AGIs $25k-50k, 8.1% for AGIs $50k-75k, 10.0% for AGIs $75k-100k, 14.0% for AGIs over 100k)
Earned income credit: $2,208 (reported on 54.0% of returns)
Here:
$2,208
State:
$1,757
Percentage of individuals using paid preparers for their 2004 taxes: 78.5%
Here:
79%
State:
67%
(% for various income ranges: 78.2% for AGIs below $10k, 81.3% for AGIs $10k-25k, 75.8% for AGIs $25k-50k, 73.9% for AGIs $50k-75k, 74.5% for AGIs $75k-100k, 78.4% for AGIs over 100k)
Likely homosexual households (counted as self-reported same-sex unmarried-partner households)
Lesbian couples: 0.2% of all households
Gay men: 0.2% of all households
Household received Food Stamps/SNAP in the past 12 months: 14,541 Household did not receive Food Stamps/SNAP in the past 12 months: 13,399
Women who had a birth in the past 12 months: 1,586 (582 now married, 1,032 unmarried) Women who did not have a birth in the past 12 months: 19,958 (5,522 now married, 14,519 unmarried)
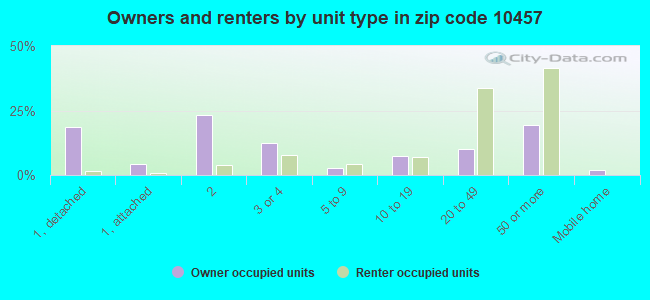
Housing units in zip code 10457 with a mortgage: 827 (91 second mortgage, 79 both second mortgage and home equity loan) Houses without a mortgage: 12
Median monthly owner costs for units with a mortgage: $2,863 Median monthly owner costs for units without a mortgage: $202
Residents with income below the poverty level in 2022:
This zip code:
36.6%
Whole state:
14.3%
Residents with income below 50% of the poverty level in 2022:
This zip code:
15.7%
Whole state:
6.8%
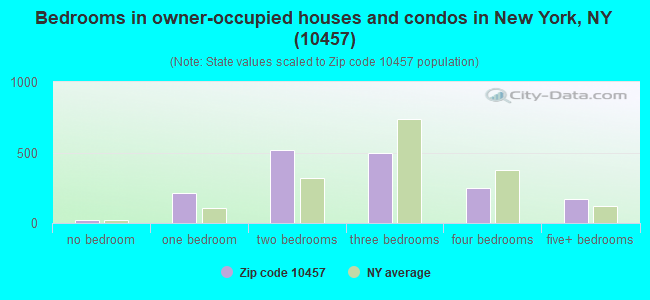
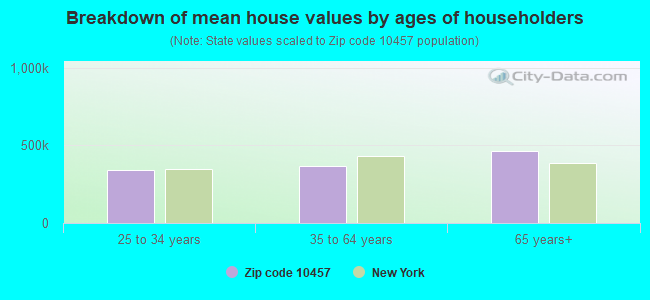
Median number of rooms in houses and condos:
Here:
4.9
State:
6.3
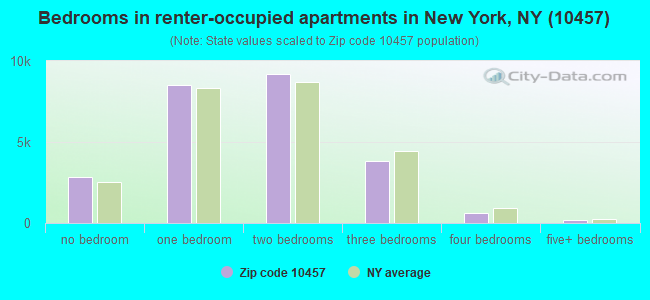
Median number of rooms in apartments:
Here:
3.7
State:
3.8
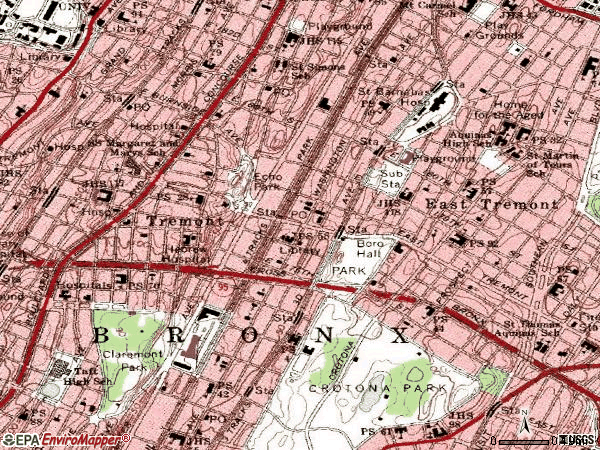
Notable locations in this zip code not listed on our city pages
Notable locations in zip code 10457: Tremont Avenue Station (A), Onehundredeightythird Street Station (B), Bathgate Industrial Park (C), Webbtree Building (D), Grand Concourse Branch New York Public Library (E), Fortysixth Precinct Police Station (F), Fortyeighth Precinct Police Station (G), Fortyeighth Precinct Station House (H), Crotonia Professional Building (I), Fire Department New York Engine 88 Ladder 38 (J), Fulton Community Correctional Facility (K), Casa Promesa (L), New York Ladder Company 27 (M), New York Ladder Company 38 (N), Technical Center Bathgate Industrial Park (O), Fire Department New York Engine 42 (P), Fire Department New York Engine 46 Ladder 27 (Q), Fire Department New York Rescue Company 3 (R). Display/hide their locations on the map
Churches in zip code 10457 include: Iglesia Alabanza Del Senor (A), Saint Martin of Tours Roman Catholic Church (B), Church of Saint Simon (C), Congregation Gates of Mercy (D), Fellowship Chapel (E), Garden of Prayer Cathedral (F), Holy Trinity Church (G), Kingdom Hall of Jehovahs Witnesses (H), Mount Eden Center Synagogue (I). Display/hide their locations on the map
Parks in zip code 10457 include: W C Bergan Park (1), Richman Park (2), Jardin De La Familia (3), Claremont Community Park (4), Garden of Life (5), Garden of Eden (6), Barry Plaza (7), Peace Park (8), Cleopatra Park (9). Display/hide their locations on the map
6,594 married couples with children.
11,993 single-parent households (1,442 men, 10,551 women).
32.6% of residents of 10457 zip code speak English at home.
55.7% of residents speak Spanish at home (48% very well, 20% well, 19% not well, 12% not at all).
2.4% of residents speak other Indo-European language at home (56% very well, 26% well, 14% not well, 4% not at all).
0.2% of residents speak Asian or Pacific Island language at home (42% very well, 22% well, 20% not well, 16% not at all).
9.2% of residents speak other language at home (59% very well, 31% well, 8% not well, 1% not at all).
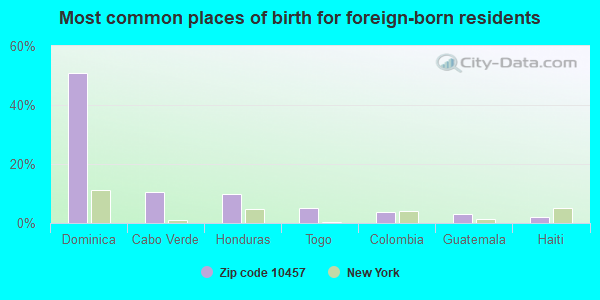
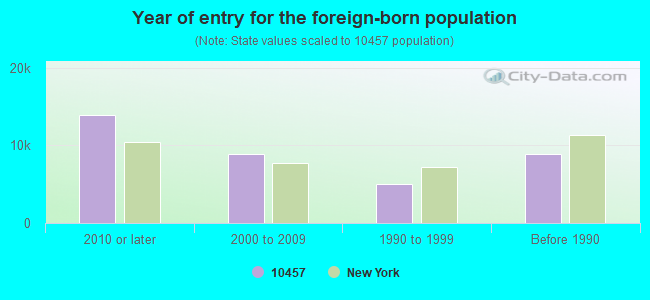
Foreign born population: 30,496 (38.8%) (48.5% of them are naturalized citizens)
This zip code:
38.8%
Whole state:
22.7%
51%Dominica
10%Cabo Verde
10%Honduras
5%Togo
4%Colombia
3%Guatemala
2%Haiti
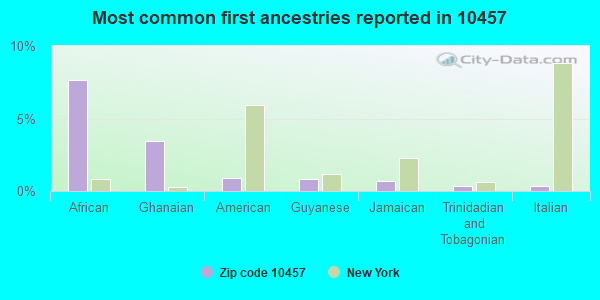
8%African
3%Ghanaian
1%American
1%Guyanese
1%Jamaican
0%Trinidadian and Tobagonian
0%Italian
Year of entry for the foreign-born population
13,9202010 or later
8,9342000 to 2009
5,0341990 to 1999
8,829Before 1990
Major facilities with environmental interests located in this zip code:
CLAY PARK LABS INCORPORATED (1701 BATHGATE AVENUE in BRONX, NY)
AIR SYNTHETIC MINOR (AIRS/AFS) (Integrated Compliance Information System) - ICIS-02-1997-0009, FORMAL ENFORCEMENT ACTION, ICIS-02-1988-0123, ICIS-02-1985-0008, COMPLIANCE ACTIVITY (Tracking inspections of insecticide, fungicide, and rodenticide, and toxic substances) (Resource Conservation and Recovery Act (tracking hazardous waste)) HAZARDOUS WASTE BIENNIAL REPORTER (Resource Conservation and Recovery Act (tracking hazardous waste)) Large Quantity Generators, more that 1000 kg of hazardous waste/month (Resource Conservation and Recovery Act (tracking hazardous waste)) TRI REPORTER (Tracking of toxic chemicals releasing facilities) Business SIC classification: PHARMACEUTICAL PREPARATIONS Business NAICS classification: PHARMACEUTICAL PREPARATION MANUFACTURING. Organizations: PERRIGO NY (CONTACT/OPERATOR)
Alternative names: CLAY-PARK LABS-1700 BATHGATE AVE, CLAY-PARK LABS. INC., PERRIGO NEW YORK INC-1700 BATHGATE AVE
700 EAST 179TH STREET SCHOOL - P-92 (700 EAST 179TH STREET in BRONX, NY)
STATE MASTER (New York facility tracking) - AIR PROGRAM (Integrated Compliance Information System) - ICIS-02-1998-0300, FORMAL ENFORCEMENT ACTION, ICIS-02-1994-0052, Conditionally Exempt Small Quantity Generators, less than 100 kg/month of hazardous waste (Resource Conservation and Recovery Act (tracking hazardous waste)) - notification Business SIC classification: WRECKING AND DEMOLITION WORK; ELEMENTARY AND SECONDARY SCHOOLS Business NAICS classification: ELEMENTARY AND SECONDARY SCHOOLS. Organizations: NYC BOARD OF EDUCATION (CONTACT/OWNER)
, NYC DEPT OF EDUCATION (LEGALLY RESPONSIBLE PARTY)
Alternative names: NYC BD OF ED - PUBLIC SCHOOL 92 BRONX
CHINO AUTO REPAIR (4410 PARK AVE in BRONX, NY)
AIR MINOR (AIRS/AFS) STATE MASTER (New York facility tracking) - AIR PROGRAM Business SIC classification: TOP, BODY, AND UPHOLSTERY REPAIR SHOPS AND PAINT SHOPS Business NAICS classification: AUTOMOTIVE BODY, PAINT, AND INTERIOR REPAIR AND MAINTENANCE. Organizations: CHINO AUTO BODY SHOP, SAN MIGUEL AUTO REPAIRS (LEGALLY RESPONSIBLE PARTY)
, PARK AVENUE REPAIR SHOP OF THE BRONX INC (LEGALLY RESPONSIBLE PARTY)
, JONELL AUTO BODY & REPAIR CORP (LEGALLY RESPONSIBLE PARTY)
Alternative names: JONELL AUTO BODY & REPAIR CORP, SAN MIGUEL AUTO REPAIRS
AMPCO PRINTING-1701 BATHGATE (1701 BATHGATE AVENUE in BRONX, NY)
AIR MINOR (AIRS/AFS) STATE MASTER (New York facility tracking) - AIR PROGRAM, Organizations: AMPCO PRINTING CORP (LEGALLY RESPONSIBLE PARTY)
4175 PARK AVE BUILDING (4175 PARK AVE in BRONX, NY)
AIR SYNTHETIC MINOR (AIRS/AFS) STATE MASTER (New York facility tracking) - AIR PROGRAM Business SIC classification: WOOD PRODUCTS Organizations: CRAFTED CABINET CORP (AIR PERMITTING FACILITY OWNER CONTACT)
, 4175 PARK AVENUE BUILDING CORP (LEGALLY RESPONSIBLE PARTY)
ART FABRICATORS INC-4077 PARK AVE (4077 PARK AVENUE in BRONX, NY)
AIR MINOR (AIRS/AFS) STATE MASTER (New York facility tracking) - AIR PROGRAM Business SIC classification: NONCLASSIFIABLE ESTABLISHMENTS
INTERMEDIATE SCHOOL 193 (1919 PROSPECT AVENUE in BRONX, NY)
STATE MASTER (New York facility tracking) - AIR PROGRAM (Resource Conservation and Recovery Act (tracking hazardous waste)) Business SIC and NAICS classification: ELEMENTARY AND SECONDARY SCHOOLS Organizations: NYC DEPT OF EDUCATION (LEGALLY RESPONSIBLE PARTY)
Alternative names: NYCDGS - PUBLIC SCHOOL IS 193X
AMOCO (1752 WEBSTER AVENUE in BRONX, NY)
AIR MINOR (AIRS/AFS) (Integrated Compliance Information System) - ICIS-02-1997-0297, FORMAL ENFORCEMENT ACTION Business SIC classification: GASOLINE SERVICE STATIONS Alternative names: E GONZALEZ - 1752 WEBSTER AVENUE
ALBERT GOLDMAN RESIDENCE (1770 GRAND CONCOURSE in BRONX, NY)
AIR SYNTHETIC MINOR (AIRS/AFS) STATE MASTER (New York facility tracking) - AIR PROGRAM Business SIC classification: OPERATORS OF APARTMENT BUILDINGS Organizations: BRONX LEBANON HOSPITAL CENTER (LEGALLY RESPONSIBLE PARTY)
HS - MEDICAL SERVICES ( in BRONX, NY)
(National Center for Education Statistics) - STATE ID-327800010413 Organizations: NEW YORK CITY PUBLIC SCHOOLS (SCHOOL DISTRICT)
IS 318 ( in BRONX, NY)
(National Center for Education Statistics) - STATE ID-321200010318 Organizations: NEW YORK CITY PUBLIC SCHOOLS (SCHOOL DISTRICT)
J LEVIN HS-MEDIA & COMMUN ( in BRONX, NY)
(National Center for Education Statistics) - STATE ID-327800010414 Organizations: NEW YORK CITY PUBLIC SCHOOLS (SCHOOL DISTRICT)
Housing units lacking complete plumbing facilities: 0.8% Housing units lacking complete kitchen facilities: 1.2%
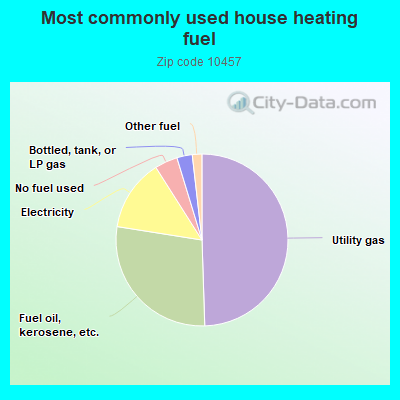
49.5%Utility gas
28.0%Fuel oil, kerosene, etc.
13.5%Electricity
4.3%No fuel used
2.9%Bottled, tank, or LP gas
1.8%Other fuel
Population in 1990: 62,133. Population change in the 1990s: +6,915 (+11.1%).
Place of birth for U.S.-born residents:
This state: 39,606
Northeast: 760
Midwest: 315
South: 1,672
West: 199
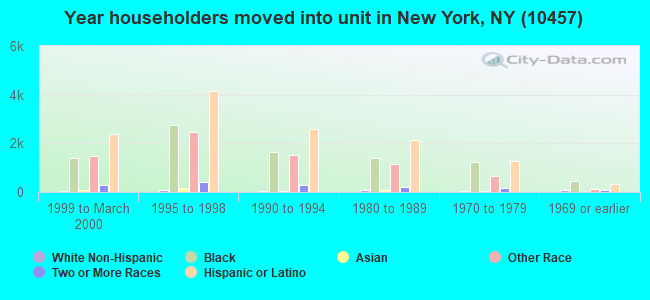
61% of the 10457 zip code residents lived in the same house 5 years ago. Out of people who lived in different houses, 71% lived in this county. Out of people who lived in different counties, 50% lived in New York.
90% of the 10457 zip code residents lived in the same house 1 year ago. Out of people who lived in different houses, 59% moved from this county. Out of people who lived in different houses, 25% moved from different county within same state. Out of people who lived in different houses, 8% moved from different state. Out of people who lived in different houses, 8% moved from abroad.
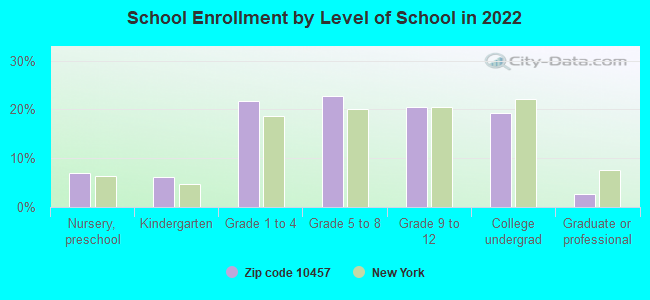
Private vs. public school enrollment:
Students in private schools in grades 1 to 8 (elementary and middle school): 317
Here:
3.1%
New York:
15.6%
Students in private schools in grades 9 to 12 (high school): 269
Here:
5.7%
New York:
15.0%
Students in private undergraduate colleges: 1,011
Here:
23.0%
New York:
39.2%
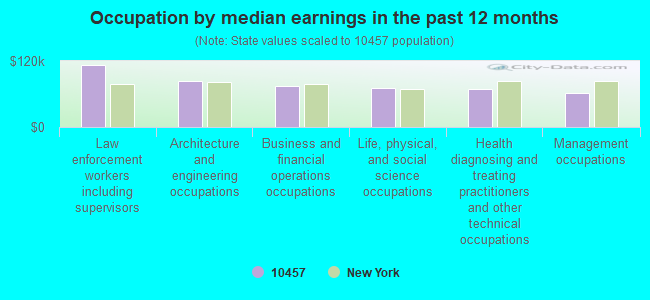
Occupation by median earnings in the past 12 months ($)
112,956Law enforcement workers including supervisors
83,316Architecture and engineering occupations
74,917Business and financial operations occupations
71,520Life, physical, and social science occupations
69,192Health diagnosing and treating practitioners and other technical occupations
62,404Management occupations
Companies with federal contracts located in this zip code:
CLAY-PARK LABORATORIES INC (1700 BATHGATE AVE in BRONX, NY; small business) : $838,608 in 3 contractsin 2000
$378,328 with Defense Logistics Agency for Medicated Cosmetics and Toiletries. Signed on 2000-08-02. Completion date: 2000-11-08.
$302,854, same as above.Signed on 2000-07-12. Completion date: 2000-10-20.
$157,426, same as above.Signed on 2000-03-18. Completion date: 2000-06-15.
TULNOY LUMBER, INC (1620 WEBSTER AVENUE in BRONX, NY; small business) : $93,450 in 13 contractsfrom 2004 to 2005
Contracts for Hardware, Commercial, Lumber and Related Basic Wood Materials, Nuts and Washers by Army, Bureau of Prisoners/Federal Prison System, Navy Signed by year:2000: $0; 2001: $0; 2002: $0; 2003: $0; 2004: $16,095; 2005: $77,355; 2006: $0.
Biggest contracts:
$13,898 with Army for Hardware, Commercial. Taking place in MD. Signed on 2005-01-24. Completion date: 2005-02-15.
$13,291 with Bureau of Prisoners/Federal Prison System for Lumber and Related Basic Wood Materials. Taking place in CT. Signed on 2005-03-31. Completion date: 2005-04-18.
$8,685 with Army for Nuts and Washers. Taking place in CA. Signed on 2005-01-27. Completion date: 2005-02-24.
$8,664 with Navy for Lumber and Related Basic Wood Materials. Signed on 2005-01-25. Completion date: 2005-02-05.
Top industries in this zip code by the number of employees in 2005:
Health Care and Social Assistance: General Medical and Surgical Hospitals (over 1000 employees: 2 establishments)
Health Care and Social Assistance: Services for the Elderly and Persons with Disabilities (250-499: 1, 5-9: 1, 1-4: 1)
Health Care and Social Assistance: Other Individual and Family Services (100-249: 1, 20-49: 4, 10-19: 1, 5-9: 4, 1-4: 5)
Health Care and Social Assistance: Nursing Care Facilities (100-249: 2)
Real Estate and Rental and Leasing: Lessors of Residential Buildings and Dwellings (20-49: 3, 10-19: 1, 5-9: 11, 1-4: 68)
Health Care and Social Assistance: Child Day Care Services (50-99: 1, 20-49: 4, 10-19: 3, 5-9: 2, 1-4: 1)
Health Care and Social Assistance: Offices of Physicians (except Mental Health Specialists) (50-99: 1, 20-49: 2, 10-19: 5, 5-9: 3, 1-4: 12)
2007 - 2018 National Fire Incident Reporting System (NFIRS) incidents
Based on the data from the years 2007 - 2018 the average number of fire incidents per year is 454. The highest number of fires - 555 took place in 2010, and the least - 318 in 2007. The data has a rising trend.
When looking into fire subcategories, the most incidents belonged to: Structure Fires (74.6%), and Outside Fires (15.2%).
Fire incident types reported to NFIRS in Zip Code 10457


 Nearest zip codes: 10453, 10458, 10456, 10460, 10468, 10459.


 Based on the data from the years 2007 - 2018 the average number of fire incidents per year is 454. The highest number of fires - 555 took place in 2010, and the least - 318 in 2007. The data has a rising trend.
 When looking into fire subcategories, the most incidents belonged to: Structure Fires (74.6%), and Outside Fires (15.2%).