Estimated zip code population in 2022: 80,105 Zip code population in 2010: 76,103 Zip code population in 2000: 78,309
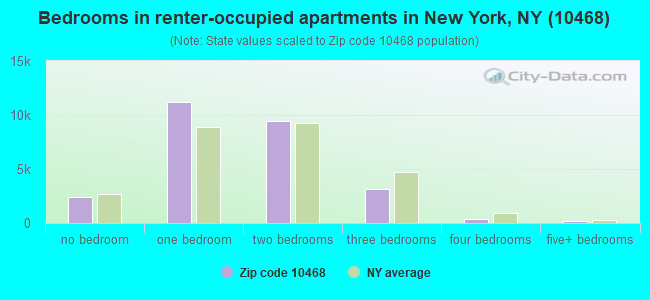
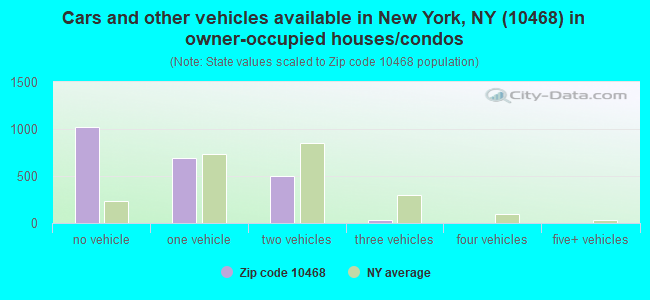
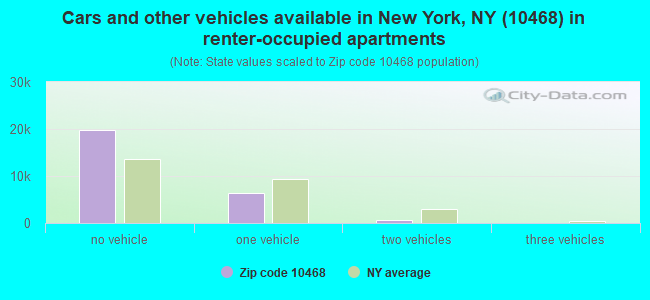
Houses and condos: 29,584 Renter-occupied apartments: 26,782
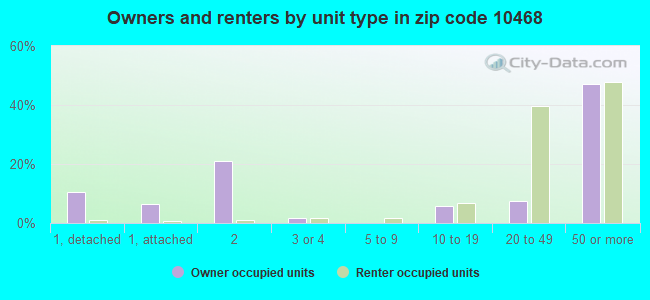
% of renters here:
92%
State:
46%
March 2022 cost of living index in zip code 10468: 146.5 (very high, U.S. average is 100)
Land area: 1.1 sq. mi. Water area: 0.0 sq. mi.
Population density: 74,500 people per square mile
(very high).
OSM Map
General Map
Google Map
MSN Map
OSM Map
General Map
Google Map
MSN Map
OSM Map
General Map
Google Map
MSN Map
OSM Map
General Map
Google Map
MSN Map
Please wait while loading the map...
Real estate property taxes paid for housing units in 2022:
This zip code:
1.7% ($4,834)
New York:
1.5% ($6,180)
Median real estate property taxes paid for housing units with mortgages in 2022: $3,469 (1.2%) Median real estate property taxes paid for housing units with no mortgage in 2022: $5,853 (2.0%)
Averages for the 2020 tax year for zip code 10468, filed in 2021:
Average Adjusted Gross Income (AGI) in 2020: $32,803 (Individual Income Tax Returns)
Here:
$32,803
State:
$90,930
Salary/wage: $33,416 (reported on 74.0% of returns)
Here:
$33,416
State:
$72,104
(% of AGI for various income ranges: 856.0% for AGIs below $25k, 3244.1% for AGIs $25k-50k, 6712.6% for AGIs $50k-75k, 10204.3% for AGIs $75k-100k, 17785.6% for AGIs $100k-200k, 74500.0% for AGIs over 200k)
Taxable interest for individuals: $333 (reported on 11.0% of returns)
This zip code:
$333
New York:
$3,075
(% of AGI for various income ranges: 2.2% for AGIs below $25k, 2.5% for AGIs $25k-50k, 9.3% for AGIs $50k-75k, 13.8% for AGIs $75k-100k, 41.5% for AGIs $100k-200k, 296.7% for AGIs over 200k)
Ordinary dividends: $2,061 (reported on 3.1% of returns)
Here:
$2,061
State:
$11,095
(% of AGI for various income ranges: 1.7% for AGIs below $25k, 2.8% for AGIs $25k-50k, 11.1% for AGIs $50k-75k, 24.1% for AGIs $75k-100k, 100.3% for AGIs $100k-200k, 1803.3% for AGIs over 200k)
Net capital gain/loss in AGI: +$3,414 (reported on 3.7% of returns)
Here:
+$3,414
State:
+$44,925
(% of AGI for various income ranges: 2.6% for AGIs $25k-50k, 4.5% for AGIs $50k-75k, 48.8% for AGIs $75k-100k, 195.1% for AGIs $100k-200k, 8540.0% for AGIs over 200k)
Profit/loss from business: +$5,357 (reported on 21.1% of returns)
Here:
+$5,357
State:
+$14,940
(% of AGI for various income ranges: 241.9% for AGIs below $25k, 80.9% for AGIs $25k-50k, 51.7% for AGIs $50k-75k, 78.0% for AGIs $75k-100k, 278.9% for AGIs $100k-200k)
Taxable individual retirement arrangement distribution: $12,588 (reported on 1.0% of returns)
10468:
$12,588
New York:
$19,609
(% of AGI for various income ranges: 4.1% for AGIs below $25k, 7.3% for AGIs $25k-50k, 24.0% for AGIs $50k-75k, 62.7% for AGIs $75k-100k, 295.2% for AGIs $100k-200k)
Total itemized deductions: $25,124 (reported on 2.2% of returns)
Here:
$25,124
State:
$39,326
(% of AGI for various income ranges: 6.3% for AGIs below $25k, 34.3% for AGIs $25k-50k, 150.5% for AGIs $50k-75k, 338.3% for AGIs $75k-100k, 858.0% for AGIs $100k-200k, 5303.3% for AGIs over 200k)
Charity contributions: $7,527 (reported on 1.6% of returns)
Here:
$7,527
State:
$15,420
(% of AGI for various income ranges: 0.9% for AGIs below $25k, 5.4% for AGIs $25k-50k, 29.8% for AGIs $50k-75k, 74.6% for AGIs $75k-100k, 236.9% for AGIs $100k-200k, 943.3% for AGIs over 200k)
Taxes paid: $9,369 (reported on 2.2% of returns)
10468:
$9,369
State:
$9,183
(% of AGI for various income ranges: 1.4% for AGIs below $25k, 14.9% for AGIs $25k-50k, 55.5% for AGIs $50k-75k, 132.3% for AGIs $75k-100k, 314.4% for AGIs $100k-200k, 1270.0% for AGIs over 200k)
Earned income credit: $2,395 (reported on 30.6% of returns)
Here:
$2,395
State:
$2,138
(% of AGI for various income ranges: 149.6% for AGIs below $25k, 91.0% for AGIs $25k-50k, 0.7% for AGIs $50k-75k)
Percentage of individuals using paid preparers for their 2020 taxes: 94.3%
Here:
94%
State:
95%
(% for various income ranges: 92.3% for AGIs below $25k, 96.5% for AGIs $25k-50k, 96.2% for AGIs $50k-75k, 95.3% for AGIs $75k-100k, 94.4% for AGIs $100k-200k, 90.0% for AGIs over 200k)
Averages for the 2012 tax year for zip code 10468, filed in 2013:
Average Adjusted Gross Income (AGI) in 2012: $26,859 (Individual Income Tax Returns)
Here:
$26,859
State:
$77,088
Salary/wage: $28,485 (reported on 79.4% of returns)
Here:
$28,485
State:
$60,593
(% of AGI for various income ranges: 69.8% for AGIs below $25k, 93.1% for AGIs $25k-50k, 90.8% for AGIs $50k-75k, 87.9% for AGIs $75k-100k, 80.0% for AGIs $100k-200k, 58.6% for AGIs over 200k)
Taxable interest for individuals: $428 (reported on 10.0% of returns)
This zip code:
$428
New York:
$3,125
(% of AGI for various income ranges: 0.2% for AGIs below $25k, 0.1% for AGIs $50k-75k, 0.2% for AGIs $75k-100k, 0.4% for AGIs $100k-200k, 0.7% for AGIs over 200k)
Ordinary dividends: $2,400 (reported on 2.6% of returns)
Here:
$2,400
State:
$10,299
(% of AGI for various income ranges: 0.2% for AGIs below $25k, 0.1% for AGIs $25k-50k, 0.2% for AGIs $50k-75k, 0.5% for AGIs $75k-100k, 0.9% for AGIs $100k-200k)
Net capital gain/loss in AGI: +$522 (reported on 2.2% of returns)
Here:
+$522
State:
+$42,474
(% of AGI for various income ranges: 1.2% for AGIs $100k-200k)
Profit/loss from business: +$8,269 (reported on 22.5% of returns)
Here:
+$8,269
State:
+$16,168
(% of AGI for various income ranges: 22.7% for AGIs below $25k, 1.0% for AGIs $25k-50k, 0.7% for AGIs $50k-75k, 0.4% for AGIs $75k-100k, 0.9% for AGIs $100k-200k)
Taxable individual retirement arrangement distribution: $10,802 (reported on 1.4% of returns)
10468:
$10,802
New York:
$17,621
(% of AGI for various income ranges: 0.3% for AGIs below $25k, 0.3% for AGIs $25k-50k, 0.7% for AGIs $50k-75k, 0.9% for AGIs $75k-100k, 2.0% for AGIs $100k-200k)
Total itemized deductions: $16,676 (29% of AGI, reported on 17.1% of returns)
Here:
$16,676
State:
$34,985
Here:
28.8% of AGI
State:
21.3% of AGI
(% of AGI for various income ranges: 2.2% for AGIs below $25k, 11.1% for AGIs $25k-50k, 15.0% for AGIs $50k-75k, 17.9% for AGIs $75k-100k, 17.1% for AGIs $100k-200k, 17.5% for AGIs over 200k)
Charity contributions: $2,832 (reported on 13.4% of returns)
Here:
$2,832
State:
$5,572
(% of AGI for various income ranges: 0.2% for AGIs below $25k, 1.4% for AGIs $25k-50k, 2.1% for AGIs $50k-75k, 2.4% for AGIs $75k-100k, 2.6% for AGIs $100k-200k, 2.7% for AGIs over 200k)
Taxes paid: $5,193 (reported on 17.0% of returns)
10468:
$5,193
State:
$18,656
(% of AGI for various income ranges: 0.3% for AGIs below $25k, 2.3% for AGIs $25k-50k, 5.0% for AGIs $50k-75k, 7.3% for AGIs $75k-100k, 7.9% for AGIs $100k-200k, 8.1% for AGIs over 200k)
Earned income credit: $2,659 (reported on 44.3% of returns)
Here:
$2,659
State:
$2,230
(% of AGI for various income ranges: 14.0% for AGIs below $25k, 1.4% for AGIs $25k-50k)
Percentage of individuals using paid preparers for their 2012 taxes: 77.7%
Here:
78%
State:
66%
(% for various income ranges: 78.8% for AGIs below $25k, 76.7% for AGIs $25k-50k, 75.3% for AGIs $50k-75k, 74.0% for AGIs $75k-100k, 75.0% for AGIs $100k-200k, 75.0% for AGIs over 200k)
Averages for the 2004 tax year for zip code 10468, filed in 2005:
Average Adjusted Gross Income (AGI) in 2004: $24,915 (Individual Income Tax Returns)
Here:
$24,915
State:
$59,519
Salary/wage: $26,334 (reported on 81.5% of returns)
Here:
$26,334
State:
$50,673
(% of AGI for various income ranges: 55.0% for AGIs below $10k, 79.7% for AGIs $10k-25k, 94.9% for AGIs $25k-50k, 92.4% for AGIs $50k-75k, 87.9% for AGIs $75k-100k, 68.4% for AGIs over 100k)
Taxable interest for individuals: $829 (reported on 17.1% of returns)
This zip code:
$829
New York:
$2,377
(% of AGI for various income ranges: 0.7% for AGIs below $10k, 0.6% for AGIs $10k-25k, 0.3% for AGIs $25k-50k, 0.5% for AGIs $50k-75k, 0.8% for AGIs $75k-100k, 1.7% for AGIs over 100k)
Taxable dividends: $2,031 (reported on 4.1% of returns)
Here:
$2,031
State:
$5,394
(% of AGI for various income ranges: 0.3% for AGIs below $10k, 0.2% for AGIs $10k-25k, 0.2% for AGIs $25k-50k, 0.3% for AGIs $50k-75k, 0.5% for AGIs $75k-100k, 1.6% for AGIs over 100k)
Net capital gain/loss: +$3,687 (reported on 2.7% of returns)
Here:
+$3,687
State:
+$23,581
(% of AGI for various income ranges: -0.1% for AGIs below $10k, 0.0% for AGIs $10k-25k, 0.0% for AGIs $25k-50k, 0.2% for AGIs $50k-75k, 0.4% for AGIs $75k-100k, 5.2% for AGIs over 100k)
Profit/loss from business: +$7,488 (reported on 22.1% of returns)
Here:
+$7,488
State:
+$13,809
(% of AGI for various income ranges: 44.2% for AGIs below $10k, 14.6% for AGIs $10k-25k, 0.7% for AGIs $25k-50k, 0.5% for AGIs $50k-75k, 0.2% for AGIs $75k-100k, 1.3% for AGIs over 100k)
IRA payment deduction: $2,180 (reported on 1.0% of returns)
10468:
$2,180
New York:
$3,115
(% of AGI for various income ranges: 0.0% for AGIs below $10k, 0.1% for AGIs $10k-25k, 0.1% for AGIs $25k-50k, 0.1% for AGIs $50k-75k, 0.1% for AGIs $75k-100k)
Total itemized deductions: $15,239 (30% of AGI, reported on 20.5% of returns)
Here:
$15,239
State:
$25,864
Here:
30.2% of AGI
State:
21.9% of AGI
(% of AGI for various income ranges: 1.6% for AGIs below $10k, 4.3% for AGIs $10k-25k, 14.1% for AGIs $25k-50k, 18.8% for AGIs $50k-75k, 19.4% for AGIs $75k-100k, 17.9% for AGIs over 100k)
Charity contributions deductions: $3,097 (6% of AGI, reported on 18.6% of returns)
Here:
$3,097
State:
$4,439
Here:
6.1% of AGI
State:
3.6% of AGI
(% of AGI for various income ranges: 0.1% for AGIs below $10k, 0.7% for AGIs $10k-25k, 2.7% for AGIs $25k-50k, 3.6% for AGIs $50k-75k, 3.7% for AGIs $75k-100k, 3.2% for AGIs over 100k)
Total tax: $2,650 (reported on 63.6% of returns)
10468:
$2,650
State:
$11,730
(% of AGI for various income ranges: 6.8% for AGIs below $10k, 3.8% for AGIs $10k-25k, 5.0% for AGIs $25k-50k, 8.8% for AGIs $50k-75k, 11.5% for AGIs $75k-100k, 16.6% for AGIs over 100k)
Earned income credit: $2,173 (reported on 46.1% of returns)
Here:
$2,173
State:
$1,757
Percentage of individuals using paid preparers for their 2004 taxes: 76.2%
Here:
76%
State:
67%
(% for various income ranges: 77.1% for AGIs below $10k, 79.0% for AGIs $10k-25k, 73.9% for AGIs $25k-50k, 70.6% for AGIs $50k-75k, 71.6% for AGIs $75k-100k, 69.6% for AGIs over 100k)
Likely homosexual households (counted as self-reported same-sex unmarried-partner households)
Lesbian couples: 0.0% of all households
Gay men: 0.1% of all households
Household received Food Stamps/SNAP in the past 12 months: 13,393 Household did not receive Food Stamps/SNAP in the past 12 months: 16,484
Women who had a birth in the past 12 months: 1,475 (781 now married, 707 unmarried) Women who did not have a birth in the past 12 months: 18,688 (6,353 now married, 12,356 unmarried)
Housing units in zip code 10468 with a mortgage: 981 (95 second mortgage, 96 both second mortgage and home equity loan) Median monthly owner costs for units with a mortgage: $2,142 Median monthly owner costs for units without a mortgage: $1,214
Residents with income below the poverty level in 2022:
This zip code:
27.5%
Whole state:
14.3%
Residents with income below 50% of the poverty level in 2022:
This zip code:
13.7%
Whole state:
6.8%
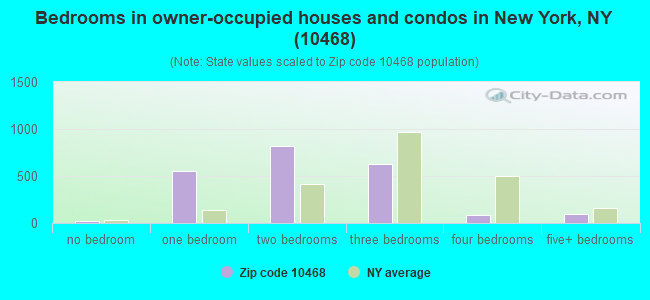
Median number of rooms in houses and condos:
Here:
4.2
State:
6.3
Median number of rooms in apartments:
Here:
3.6
State:
3.8
Notable locations in this zip code not listed on our city pages
Notable locations in zip code 10468: Jerome Avenue Pumping Station (A), Concourse Yard (B), Carman Hall (C), Hebrew Infant Asylum (D), Greenwall Pavilion (E), Jewish Home and Hospital for the Aged (F), Catholic Orphan Asylum (G), Scott Tower (H), Tracey Towers (I), Paradise Theater (J), Society for Relief of the Destitude Blind (K). Display/hide their locations on the map
Churches in zip code 10468 include: Fordham Manor Reformed Church (A), Our Lady of the Angels Roman Catholic Church (B), Iglesia Bautista Hispana (C), Iglesia Estrella De Jacob (D), Beth Shraga Institute Synagogue (E), Church of Saint Nicholas of Tolentine (F), Creston Avenue Baptist Church (G), Eleventh Church of Christ Scientist (H), Fordham Lutheran Church (I). Display/hide their locations on the map
Parks in zip code 10468 include: Barnhill Triangle (1), University Woods Park (2), Saint James Park (3), Old Fort Park (4), Harris Park (5), Devoe Park (6), Muller Triangle (7), John R Brown Triangle (8), Fordham Landing Playground (9). Display/hide their locations on the map
Tourist attraction (not listed on the city page) : A To Z Services (Cultural Attractions- Events- & Facilities; 2811 Appointment 1 Morris Avenue).
6,943 married couples with children.
10,323 single-parent households (1,572 men, 8,751 women).
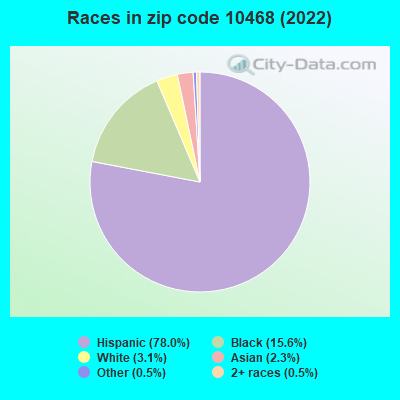
20.6% of residents of 10468 zip code speak English at home.
71.0% of residents speak Spanish at home (46% very well, 18% well, 24% not well, 12% not at all).
2.2% of residents speak other Indo-European language at home (40% very well, 31% well, 25% not well, 4% not at all).
2.1% of residents speak Asian or Pacific Island language at home (47% very well, 18% well, 29% not well, 6% not at all).
4.0% of residents speak other language at home (64% very well, 22% well, 14% not well, 1% not at all).
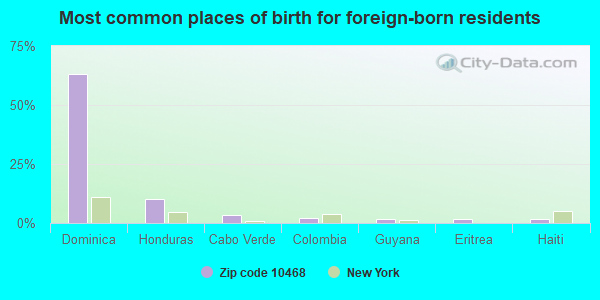
Foreign born population: 36,949 (46.1%) (44.8% of them are naturalized citizens)
This zip code:
46.1%
Whole state:
22.7%
63%Dominica
10%Honduras
3%Cabo Verde
2%Colombia
2%Guyana
1%Eritrea
1%Haiti
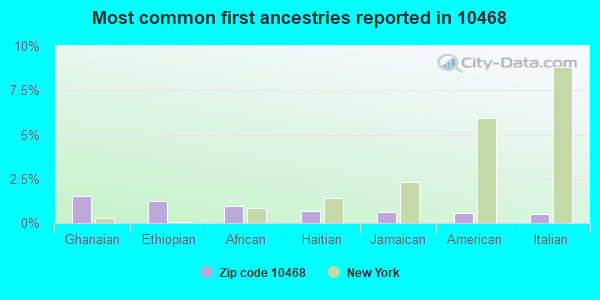
2%Ghanaian
1%Ethiopian
1%African
1%Haitian
1%Jamaican
1%American
0%Italian
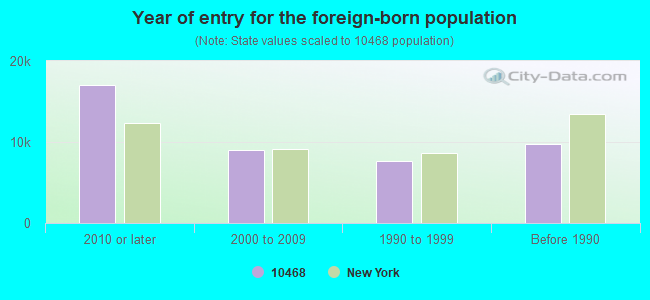
Year of entry for the foreign-born population
17,0942010 or later
9,0572000 to 2009
7,6361990 to 1999
9,696Before 1990
Major facilities with environmental interests located in this zip code:
AMOCO-169209954005 (3276 JEROME AVENUE in BRONX, NY)
AIR MINOR (AIRS/AFS) STATE MASTER (New York facility tracking) - AIR PROGRAM, Small Quantity Generators, between 100 kg and 1000 kg of hazardous waste/month (Resource Conservation and Recovery Act (tracking hazardous waste)) - notification Business SIC classification: GASOLINE SERVICE STATIONS Organizations: AMOCO OIL CO (CONTACT/OWNER)
Alternative names: BILLVERS SERVICE STATION INC
HOSANNA CLEANERS (4311 KATONAH AVENUE in BRONX, NY)
AIR MINOR (AIRS/AFS) STATE MASTER (New York facility tracking) - AIR PROGRAM Conditionally Exempt Small Quantity Generators, less than 100 kg/month of hazardous waste (Resource Conservation and Recovery Act (tracking hazardous waste)) - notification Business SIC classification: DRYCLEANING PLANTS, EXCEPT RUG CLEANING Business NAICS classification: DRYCLEANING AND LAUNDRY SERVICES (EXCEPT COIN-OPERATED). Organizations: TAE SUNG KIM (CONTACT/OWNER)
, S.B.H. CLEANING CORP (LEGALLY RESPONSIBLE PARTY)
2685 CRESTON AVENUE BUILDING (2685 CRESTON AVENUE in BRONX, NY)
AIR MINOR (AIRS/AFS) STATE MASTER (New York facility tracking) - AIR PROGRAM Business SIC classification: OPERATORS OF APARTMENT BUILDINGS Business NAICS classification: LESSORS OF RESIDENTIAL BUILDINGS AND DWELLINGS. Organizations: J R D MANAGEMENT CORP (AIR FEE BILLING CONTACT)
, 2685 CRESTON AVE OWNERS CORP (LEGALLY RESPONSIBLE PARTY)
37 BEDFORD PARK CLEANERS (37 BEDFORD PARK BLVD. in BRONX, NY)
AIR MINOR (AIRS/AFS) STATE MASTER (New York facility tracking) - AIR PROGRAM, HAZARDOUS WASTE PROGRAM Small Quantity Generators, between 100 kg and 1000 kg of hazardous waste/month (Resource Conservation and Recovery Act (tracking hazardous waste)) Business SIC classification: COMMERCIAL LAUNDRY, DRYCLEANING, AND PRESSING MACHINES; DRYCLEANING PLANTS, EXCEPT RUG CLEANING Organizations: BEDFORD PARK CLEANERS INC (LEGALLY RESPONSIBLE PARTY)
Alternative names: MAREL CLEANERS
AMOCO-176209600005 (3010 RIVERDALE AVE in BRONX, NY)
AIR MINOR (AIRS/AFS) STATE MASTER (New York facility tracking) - AIR PROGRAM Business SIC classification: GASOLINE SERVICE STATIONS Organizations: AMOCO OIL CO (LEGALLY RESPONSIBLE PARTY)
AMOCO-65425671005 (2350 JEROME AVE in BRONX, NY)
AIR MINOR (AIRS/AFS) STATE MASTER (New York facility tracking) - AIR PROGRAM Business SIC classification: GASOLINE SERVICE STATIONS Organizations: AMOCO OIL CO (LEGALLY RESPONSIBLE PARTY)
3155 GRAND CONCOURSE BUILDING (3155 GRAND CONCOURSE in BRONX, NY)
AIR SYNTHETIC MINOR (AIRS/AFS) STATE MASTER (New York facility tracking) - AIR PROGRAM Business SIC classification: OPERATORS OF DWELLINGS OTHER THAN APARTMENT BUILDINGS Business NAICS classification: LESSORS OF RESIDENTIAL BUILDINGS AND DWELLINGS. Organizations: CONCOURSE ASSOCIATES LLC, M & H RACOLIN CORP (LEGALLY RESPONSIBLE PARTY)
Alternative names: M&H RACOLIN MGMT CORPORATION 3155 GRAND CONC
HS - TEACHING AND PROFESSIONS ( in BRONX, NY)
(National Center for Education Statistics) - STATE ID-327800010433 Organizations: NEW YORK CITY PUBLIC SCHOOLS (SCHOOL DISTRICT)
HS AMER STUDIES AT LEHMAN COLL ( in BRONX, NY)
(National Center for Education Statistics) - STATE ID-327800010696 Organizations: NEW YORK CITY PUBLIC SCHOOLS (SCHOOL DISTRICT)
ALL STAR CLEANERS (2829 CRESTON AVENUE in BRONX, NY)
AIR MINOR (AIRS/AFS) (Resource Conservation and Recovery Act (tracking hazardous waste)) Business SIC classification: DRYCLEANING PLANTS, EXCEPT RUG CLEANING
CON EDISON - MH 11891 (2265 UNIVERSITY AVE in BRONX, NY)
Large Quantity Generators, more that 1000 kg of hazardous waste/month (Resource Conservation and Recovery Act (tracking hazardous waste)) Organizations: CONSOLIDATED EDISON COMPANY OF NY, INC. (CONTACT/OPERATOR)
CON EDISON - MH 29002 (SEDGEWICK AVE. & FORDHAM in BRONX, NY)
Large Quantity Generators, more that 1000 kg of hazardous waste/month (Resource Conservation and Recovery Act (tracking hazardous waste)) Organizations: CONSOLIDATED EDISON COMPANY OF NY, INC. (CONTACT/OPERATOR)
2400 WALTON AVENUE BUILDING (2400 WALTON AVENUE in BRONX, NY)
AIR MINOR (AIRS/AFS) CRITERIA AND HAZARDOUS AIR POLLUTANT INVENTORY (Inventory of air pollution sources) Business SIC classification: OPERATORS OF DWELLINGS OTHER THAN APARTMENT BUILDINGS Alternative names: SOL BERGER
Housing units lacking complete plumbing facilities: 0.8% Housing units lacking complete kitchen facilities: 1.7%
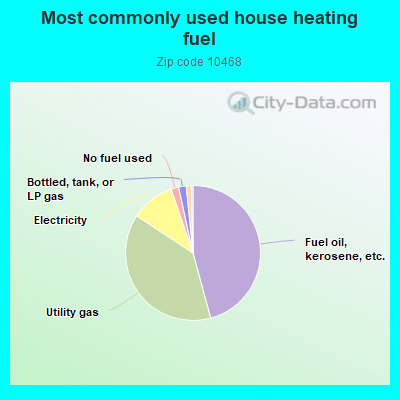
45.7%Fuel oil, kerosene, etc.
38.4%Utility gas
10.5%Electricity
1.8%No fuel used
1.8%Bottled, tank, or LP gas
1.2%Other fuel
Population in 1990: 65,854. Population change in the 1990s: +12,455 (+18.9%).
Place of birth for U.S.-born residents:
This state: 34,675
Northeast: 660
Midwest: 370
South: 1,735
West: 160
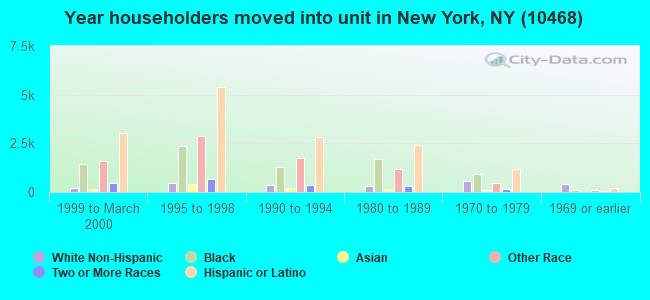
61% of the 10468 zip code residents lived in the same house 5 years ago. Out of people who lived in different houses, 67% lived in this county. Out of people who lived in different counties, 50% lived in New York.
91% of the 10468 zip code residents lived in the same house 1 year ago. Out of people who lived in different houses, 59% moved from this county. Out of people who lived in different houses, 25% moved from different county within same state. Out of people who lived in different houses, 5% moved from different state. Out of people who lived in different houses, 9% moved from abroad.
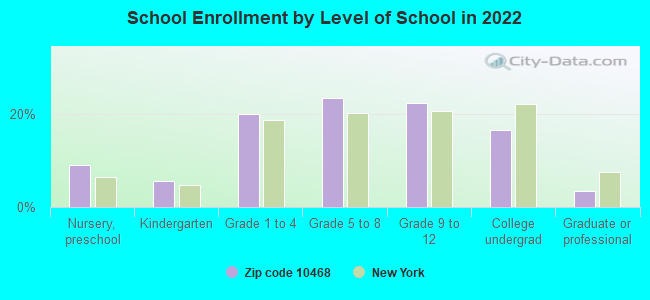
Private vs. public school enrollment:
Students in private schools in grades 1 to 8 (elementary and middle school): 713
Here:
7.9%
New York:
15.6%
Students in private schools in grades 9 to 12 (high school): 586
Here:
12.7%
New York:
15.0%
Students in private undergraduate colleges: 684
Here:
20.3%
New York:
39.2%
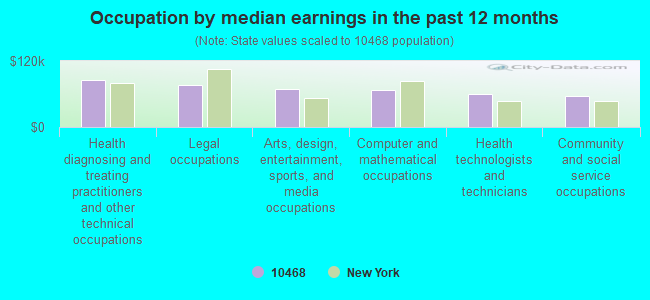
Occupation by median earnings in the past 12 months ($)
85,936Health diagnosing and treating practitioners and other technical occupations
77,103Legal occupations
68,652Arts, design, entertainment, sports, and media occupations
66,815Computer and mathematical occupations
59,897Health technologists and technicians
56,404Community and social service occupations
Top industries in this zip code by the number of employees in 2005:
Health Care and Social Assistance: Nursing Care Facilities (over 1000 employees: 1 establishment, 5-9 employees: 1 establishment)
Educational Services: Colleges, Universities, and Professional Schools (500-999: 1, 20-49: 1)
Real Estate and Rental and Leasing: Lessors of Residential Buildings and Dwellings (50-99: 3, 10-19: 1, 5-9: 5, 1-4: 107)
Professional, Scientific, and Technical Services: Research and Development in the Physical, Engineering, and Life Sciences (250-499: 1, 20-49: 1)
2007 - 2018 National Fire Incident Reporting System (NFIRS) incidents
Based on the data from the years 2007 - 2018 the average number of fire incidents per year is 318. The highest number of reported fires - 389 took place in 2008, and the least - 206 in 2007. The data has an increasing trend.
When looking into fire subcategories, the most incidents belonged to: Structure Fires (75.0%), and Outside Fires (14.3%).
Fire incident types reported to NFIRS in Zip Code 10468

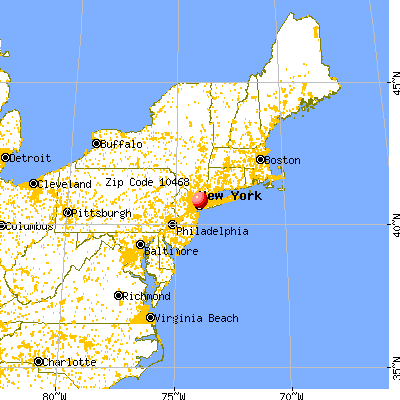


 Nearest zip codes: 10458, 10463, 10453, 10457, 10034, 10471.


 Based on the data from the years 2007 - 2018 the average number of fire incidents per year is 318. The highest number of reported fires - 389 took place in 2008, and the least - 206 in 2007. The data has an increasing trend.
 When looking into fire subcategories, the most incidents belonged to: Structure Fires (75.0%), and Outside Fires (14.3%).