Estimated zip code population in 2022: 69,180 Zip code population in 2010: 67,970 Zip code population in 2000: 65,576
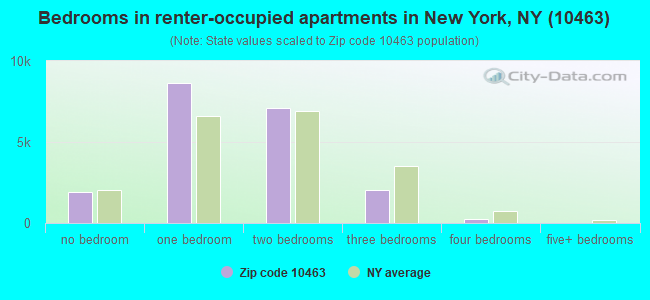
Houses and condos: 30,708 Renter-occupied apartments: 19,911
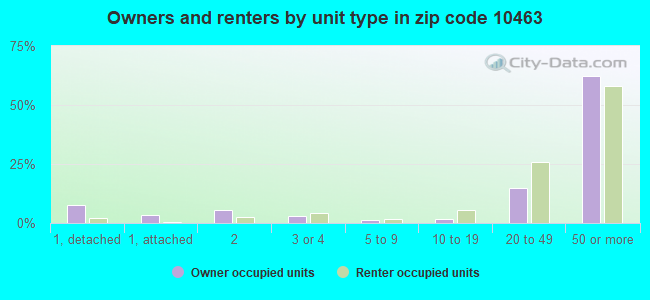
% of renters here:
66%
State:
46%
March 2022 cost of living index in zip code 10463: 145.0 (very high, U.S. average is 100)
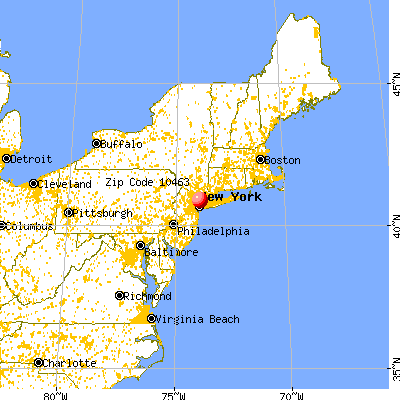
Land area: 1.4 sq. mi. Water area: 0.1 sq. mi.
Population density: 47,839 people per square mile
(very high).
OSM Map
General Map
Google Map
MSN Map
OSM Map
General Map
Google Map
MSN Map
OSM Map
General Map
Google Map
MSN Map
OSM Map
General Map
Google Map
MSN Map
Please wait while loading the map...
Real estate property taxes paid for housing units in 2022:
This zip code:
1.0% ($3,807)
New York:
1.5% ($6,180)
Median real estate property taxes paid for housing units with mortgages in 2022: $4,888 (1.1%) Median real estate property taxes paid for housing units with no mortgage in 2022: $3,024 (0.9%)
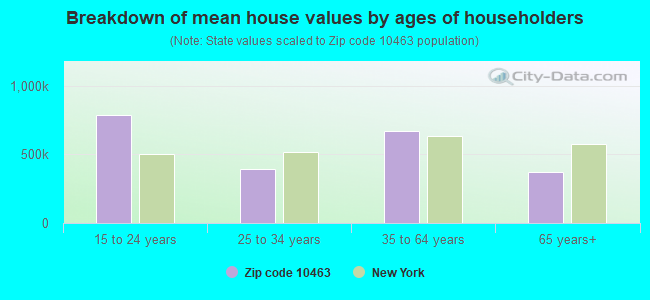
Estimated median house/condo value in 2022: $364,123
10463:
$364,123
New York:
$400,400
According to our research of New York and other state lists, there were 32 registered sex offenders living in 10463 zip code as of April 27, 2024. The ratio of all residents to sex offenders in zip code 10463 is 2,271 to 1. The ratio of registered sex offenders to all residents in this zip code is lower than the state average.
Median resident age:
This zip code:
42.1 years
New York median age:
40.0 years
Average household size:
This zip code:
2.2 people
New York:
2.5 people
Averages for the 2020 tax year for zip code 10463, filed in 2021:
Average Adjusted Gross Income (AGI) in 2020: $66,865 (Individual Income Tax Returns)
Here:
$66,865
State:
$90,930
Salary/wage: $60,846 (reported on 74.6% of returns)
Here:
$60,846
State:
$72,104
(% of AGI for various income ranges: 835.2% for AGIs below $25k, 3305.8% for AGIs $25k-50k, 6584.1% for AGIs $50k-75k, 9981.9% for AGIs $75k-100k, 18528.7% for AGIs $100k-200k, 76636.8% for AGIs over 200k)
Taxable interest for individuals: $1,763 (reported on 27.9% of returns)
This zip code:
$1,763
New York:
$3,075
(% of AGI for various income ranges: 13.2% for AGIs below $25k, 17.2% for AGIs $25k-50k, 35.9% for AGIs $50k-75k, 76.8% for AGIs $75k-100k, 160.7% for AGIs $100k-200k, 1605.1% for AGIs over 200k)
Ordinary dividends: $9,582 (reported on 16.9% of returns)
Here:
$9,582
State:
$11,095
(% of AGI for various income ranges: 20.9% for AGIs below $25k, 32.0% for AGIs $25k-50k, 71.4% for AGIs $50k-75k, 137.4% for AGIs $75k-100k, 477.3% for AGIs $100k-200k, 7034.5% for AGIs over 200k)
Net capital gain/loss in AGI: +$21,361 (reported on 16.2% of returns)
Here:
+$21,361
State:
+$44,925
(% of AGI for various income ranges: 8.0% for AGIs below $25k, 16.0% for AGIs $25k-50k, 48.2% for AGIs $50k-75k, 136.9% for AGIs $75k-100k, 551.7% for AGIs $100k-200k, 19896.8% for AGIs over 200k)
Profit/loss from business: +$11,506 (reported on 18.2% of returns)
Here:
+$11,506
State:
+$14,940
(% of AGI for various income ranges: 192.7% for AGIs below $25k, 116.0% for AGIs $25k-50k, 138.9% for AGIs $50k-75k, 172.3% for AGIs $75k-100k, 554.8% for AGIs $100k-200k, 5648.5% for AGIs over 200k)
Taxable individual retirement arrangement distribution: $18,717 (reported on 6.1% of returns)
10463:
$18,717
New York:
$19,609
(% of AGI for various income ranges: 34.3% for AGIs below $25k, 49.6% for AGIs $25k-50k, 101.8% for AGIs $50k-75k, 236.9% for AGIs $75k-100k, 544.4% for AGIs $100k-200k, 2393.6% for AGIs over 200k)
Self-employed (Keogh) retirement plans: $21,389 (reported on 0.7% of returns)
10463:
$21,389
New York:
$32,497
(% of AGI for various income ranges: 10.3% for AGIs $50k-75k, 56.1% for AGIs $100k-200k, 737.0% for AGIs over 200k)
Total itemized deductions: $32,952 (reported on 8.8% of returns)
Here:
$32,952
State:
$39,326
(% of AGI for various income ranges: 37.2% for AGIs below $25k, 75.0% for AGIs $25k-50k, 259.7% for AGIs $50k-75k, 598.3% for AGIs $75k-100k, 1186.2% for AGIs $100k-200k, 8300.6% for AGIs over 200k)
Charity contributions: $11,535 (reported on 7.5% of returns)
Here:
$11,535
State:
$15,420
(% of AGI for various income ranges: 2.7% for AGIs below $25k, 11.0% for AGIs $25k-50k, 39.7% for AGIs $50k-75k, 94.4% for AGIs $75k-100k, 243.2% for AGIs $100k-200k, 3917.7% for AGIs over 200k)
Taxes paid: $8,644 (reported on 8.7% of returns)
10463:
$8,644
State:
$9,183
(% of AGI for various income ranges: 7.2% for AGIs below $25k, 18.0% for AGIs $25k-50k, 79.9% for AGIs $50k-75k, 212.3% for AGIs $75k-100k, 431.3% for AGIs $100k-200k, 1311.5% for AGIs over 200k)
Earned income credit: $2,181 (reported on 17.5% of returns)
Here:
$2,181
State:
$2,138
(% of AGI for various income ranges: 118.3% for AGIs below $25k, 69.2% for AGIs $25k-50k, 0.3% for AGIs $50k-75k)
Percentage of individuals using paid preparers for their 2020 taxes: 94.4%
Here:
94%
State:
95%
(% for various income ranges: 93.2% for AGIs below $25k, 95.7% for AGIs $25k-50k, 94.9% for AGIs $50k-75k, 94.3% for AGIs $75k-100k, 94.2% for AGIs $100k-200k, 95.3% for AGIs over 200k)
Averages for the 2012 tax year for zip code 10463, filed in 2013:
Average Adjusted Gross Income (AGI) in 2012: $58,769 (Individual Income Tax Returns)
Here:
$58,769
State:
$77,088
Salary/wage: $51,906 (reported on 78.9% of returns)
Here:
$51,906
State:
$60,593
(% of AGI for various income ranges: 65.1% for AGIs below $25k, 83.8% for AGIs $25k-50k, 80.6% for AGIs $50k-75k, 77.5% for AGIs $75k-100k, 72.4% for AGIs $100k-200k, 49.8% for AGIs over 200k)
Taxable interest for individuals: $1,717 (reported on 33.3% of returns)
This zip code:
$1,717
New York:
$3,125
(% of AGI for various income ranges: 1.2% for AGIs below $25k, 0.6% for AGIs $25k-50k, 0.8% for AGIs $50k-75k, 0.9% for AGIs $75k-100k, 1.0% for AGIs $100k-200k, 1.2% for AGIs over 200k)
Ordinary dividends: $7,257 (reported on 18.1% of returns)
Here:
$7,257
State:
$10,299
(% of AGI for various income ranges: 1.5% for AGIs below $25k, 1.0% for AGIs $25k-50k, 1.2% for AGIs $50k-75k, 1.5% for AGIs $75k-100k, 2.3% for AGIs $100k-200k, 4.1% for AGIs over 200k)
Net capital gain/loss in AGI: +$18,023 (reported on 15.4% of returns)
Here:
+$18,023
State:
+$42,474
(% of AGI for various income ranges: 0.2% for AGIs $75k-100k, 0.9% for AGIs $100k-200k, 18.0% for AGIs over 200k)
Profit/loss from business: +$12,244 (reported on 19.0% of returns)
Here:
+$12,244
State:
+$16,168
(% of AGI for various income ranges: 17.6% for AGIs below $25k, 2.2% for AGIs $25k-50k, 1.8% for AGIs $50k-75k, 1.8% for AGIs $75k-100k, 2.5% for AGIs $100k-200k, 4.4% for AGIs over 200k)
Taxable individual retirement arrangement distribution: $16,345 (reported on 9.0% of returns)
10463:
$16,345
New York:
$17,621
(% of AGI for various income ranges: 2.2% for AGIs below $25k, 1.9% for AGIs $25k-50k, 2.1% for AGIs $50k-75k, 2.1% for AGIs $75k-100k, 3.0% for AGIs $100k-200k, 2.8% for AGIs over 200k)
Self-employment retirement plans: $19,770 (reported on 0.9% of returns)
10463:
$19,770
New York:
$27,330
(% of AGI for various income ranges: 0.1% for AGIs $75k-100k, 0.2% for AGIs $100k-200k, 0.8% for AGIs over 200k)
Total itemized deductions: $24,754 (22% of AGI, reported on 34.6% of returns)
Here:
$24,754
State:
$34,985
Here:
21.5% of AGI
State:
21.3% of AGI
(% of AGI for various income ranges: 6.1% for AGIs below $25k, 11.1% for AGIs $25k-50k, 13.8% for AGIs $50k-75k, 15.7% for AGIs $75k-100k, 16.4% for AGIs $100k-200k, 17.4% for AGIs over 200k)
Charity contributions: $4,384 (reported on 29.3% of returns)
Here:
$4,384
State:
$5,572
(% of AGI for various income ranges: 0.4% for AGIs below $25k, 1.3% for AGIs $25k-50k, 1.8% for AGIs $50k-75k, 1.9% for AGIs $75k-100k, 1.9% for AGIs $100k-200k, 3.9% for AGIs over 200k)
Taxes paid: $11,525 (reported on 34.4% of returns)
10463:
$11,525
State:
$18,656
(% of AGI for various income ranges: 1.2% for AGIs below $25k, 2.7% for AGIs $25k-50k, 5.4% for AGIs $50k-75k, 7.0% for AGIs $75k-100k, 8.4% for AGIs $100k-200k, 10.0% for AGIs over 200k)
Earned income credit: $2,351 (reported on 22.9% of returns)
Here:
$2,351
State:
$2,230
(% of AGI for various income ranges: 9.7% for AGIs below $25k, 0.9% for AGIs $25k-50k)
Percentage of individuals using paid preparers for their 2012 taxes: 72.6%
Here:
73%
State:
66%
(% for various income ranges: 73.2% for AGIs below $25k, 72.6% for AGIs $25k-50k, 70.4% for AGIs $50k-75k, 70.9% for AGIs $75k-100k, 73.6% for AGIs $100k-200k, 78.3% for AGIs over 200k)
Averages for the 2004 tax year for zip code 10463, filed in 2005:
Average Adjusted Gross Income (AGI) in 2004: $49,315 (Individual Income Tax Returns)
Here:
$49,315
State:
$59,519
Salary/wage: $44,852 (reported on 78.7% of returns)
Here:
$44,852
State:
$50,673
(% of AGI for various income ranges: 63.4% for AGIs below $10k, 69.7% for AGIs $10k-25k, 84.8% for AGIs $25k-50k, 80.0% for AGIs $50k-75k, 75.5% for AGIs $75k-100k, 60.8% for AGIs over 100k)
Taxable interest for individuals: $2,530 (reported on 46.7% of returns)
This zip code:
$2,530
New York:
$2,377
(% of AGI for various income ranges: 6.0% for AGIs below $10k, 3.1% for AGIs $10k-25k, 1.8% for AGIs $25k-50k, 1.9% for AGIs $50k-75k, 2.0% for AGIs $75k-100k, 2.8% for AGIs over 100k)
Taxable dividends: $4,552 (reported on 24.2% of returns)
Here:
$4,552
State:
$5,394
(% of AGI for various income ranges: 4.6% for AGIs below $10k, 2.0% for AGIs $10k-25k, 1.2% for AGIs $25k-50k, 1.5% for AGIs $50k-75k, 1.9% for AGIs $75k-100k, 3.1% for AGIs over 100k)
Net capital gain/loss: +$11,597 (reported on 19.7% of returns)
Here:
+$11,597
State:
+$23,581
(% of AGI for various income ranges: -0.9% for AGIs below $10k, -0.2% for AGIs $10k-25k, 0.0% for AGIs $25k-50k, 0.3% for AGIs $50k-75k, 0.8% for AGIs $75k-100k, 11.3% for AGIs over 100k)
Profit/loss from business: +$11,730 (reported on 17.6% of returns)
Here:
+$11,730
State:
+$13,809
(% of AGI for various income ranges: 30.5% for AGIs below $10k, 10.4% for AGIs $10k-25k, 1.8% for AGIs $25k-50k, 1.9% for AGIs $50k-75k, 2.4% for AGIs $75k-100k, 4.5% for AGIs over 100k)
IRA payment deduction: $2,965 (reported on 2.8% of returns)
10463:
$2,965
New York:
$3,115
(% of AGI for various income ranges: 0.3% for AGIs below $10k, 0.3% for AGIs $10k-25k, 0.3% for AGIs $25k-50k, 0.2% for AGIs $50k-75k, 0.2% for AGIs $75k-100k, 0.1% for AGIs over 100k)
Self-employed pension: $13,800 (reported on 1.2% of returns)
Here:
$13,800
New York:
$19,016
(% of AGI for various income ranges: 0.1% for AGIs $10k-25k, 0.1% for AGIs $25k-50k, 0.1% for AGIs $50k-75k, 0.2% for AGIs $75k-100k, 0.6% for AGIs over 100k)
Total itemized deductions: $20,414 (23% of AGI, reported on 38.1% of returns)
Here:
$20,414
State:
$25,864
Here:
23.0% of AGI
State:
21.9% of AGI
(% of AGI for various income ranges: 10.2% for AGIs below $10k, 9.2% for AGIs $10k-25k, 13.9% for AGIs $25k-50k, 16.5% for AGIs $50k-75k, 17.2% for AGIs $75k-100k, 17.5% for AGIs over 100k)
Charity contributions deductions: $3,840 (4% of AGI, reported on 35.3% of returns)
Here:
$3,840
State:
$4,439
Here:
4.2% of AGI
State:
3.6% of AGI
(% of AGI for various income ranges: 0.6% for AGIs below $10k, 1.1% for AGIs $10k-25k, 2.2% for AGIs $25k-50k, 2.7% for AGIs $50k-75k, 2.6% for AGIs $75k-100k, 3.5% for AGIs over 100k)
Total tax: $8,179 (reported on 76.4% of returns)
10463:
$8,179
State:
$11,730
(% of AGI for various income ranges: 5.2% for AGIs below $10k, 4.0% for AGIs $10k-25k, 6.8% for AGIs $25k-50k, 10.8% for AGIs $50k-75k, 12.5% for AGIs $75k-100k, 18.5% for AGIs over 100k)
Earned income credit: $1,874 (reported on 20.6% of returns)
Here:
$1,874
State:
$1,757
Percentage of individuals using paid preparers for their 2004 taxes: 71.8%
Here:
72%
State:
67%
(% for various income ranges: 70.3% for AGIs below $10k, 75.4% for AGIs $10k-25k, 69.1% for AGIs $25k-50k, 69.7% for AGIs $50k-75k, 72.3% for AGIs $75k-100k, 76.6% for AGIs over 100k)
Likely homosexual households (counted as self-reported same-sex unmarried-partner households)
Lesbian couples: 0.1% of all households
Gay men: 0.1% of all households
Household received Food Stamps/SNAP in the past 12 months: 7,274 Household did not receive Food Stamps/SNAP in the past 12 months: 23,268
Women who had a birth in the past 12 months: 613 (486 now married, 123 unmarried) Women who did not have a birth in the past 12 months: 15,408 (5,077 now married, 10,356 unmarried)
Housing units in zip code 10463 with a mortgage: 4,461 (301 second mortgage, 270 both second mortgage and home equity loan) Houses without a mortgage: 45
Median monthly owner costs for units with a mortgage: $2,011 Median monthly owner costs for units without a mortgage: $533
Residents with income below the poverty level in 2022:
This zip code:
20.1%
Whole state:
14.3%
Residents with income below 50% of the poverty level in 2022:
This zip code:
9.4%
Whole state:
6.8%
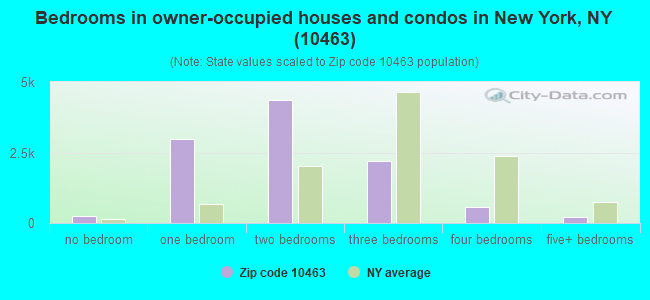
Median number of rooms in houses and condos:
Here:
4.1
State:
6.3
Median number of rooms in apartments:
Here:
3.6
State:
3.8
Notable locations in this zip code not listed on our city pages
Notable locations in zip code 10463: Jerome Park Racetrack (A), Fire Department New York Engine 81 Ladder 46 (B), Farrell Hall (C), Leo Hall (D), Neumann House (E), Overlook Manor (F), Research and Learning Center (G), New York Ladder Company 46 (H), Baptist Home for the Aged (I), Fiftieth Precinct Station House (J), Holland Nursing Home (K), Kings Terrace Nursing Home (L), Kingsbridge Plaza (M), Riverdale Towers (N), Saint Francis Home (O), Saint Patrick's Home for the Aged (P), Workmens Circle Community Center (Q), Hudson Towers (R). Display/hide their locations on the map
Churches in zip code 10463 include: Church of the Mediator (A), Kingsbridge Evangelical Lutheran Church (B), Iglesia De Dios (C), Riverdale Jewish Center (D), Edgehill Church of Spuyten Duyvil (E), Riverdale Presbyterian Chapel (F), Roman Catholic Church of Saint John (G), Saint Johns Convent (H), Saint Patrick's Convent (I). Display/hide their locations on the map
Parks in zip code 10463 include: Henry Hudson Memorial Park (1), Fort Independence Park (2), Ewen Park (3), Bailey Playground (4), Conrad Grauer Field (5), Marble Hill Playground (6), MacLaughlin Playground (7), Phyliss Post Goodman Park (8), Riverdale Playground (9). Display/hide their locations on the map
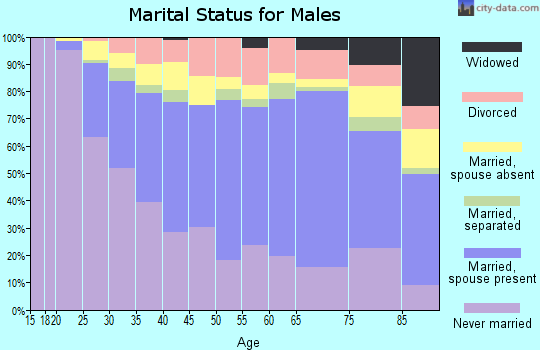
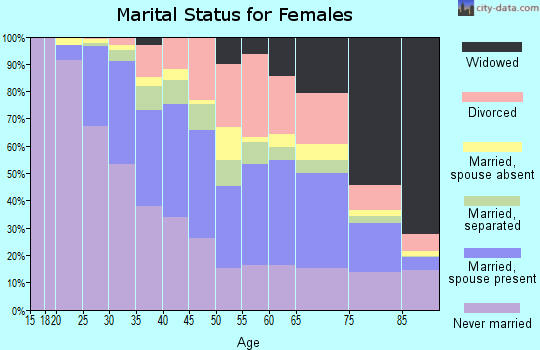
7,056 married couples with children.
6,056 single-parent households (824 men, 5,232 women).
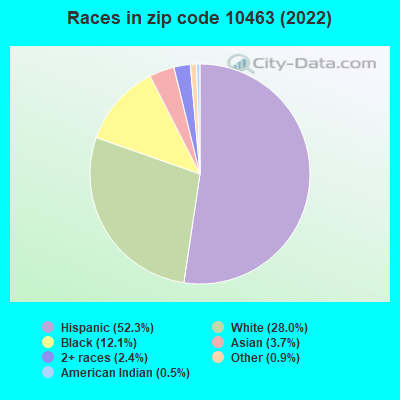
47.3% of residents of 10463 zip code speak English at home.
42.9% of residents speak Spanish at home (59% very well, 17% well, 16% not well, 8% not at all).
5.6% of residents speak other Indo-European language at home (68% very well, 25% well, 7% not well).
2.5% of residents speak Asian or Pacific Island language at home (57% very well, 25% well, 15% not well, 3% not at all).
1.7% of residents speak other language at home (87% very well, 13% well).
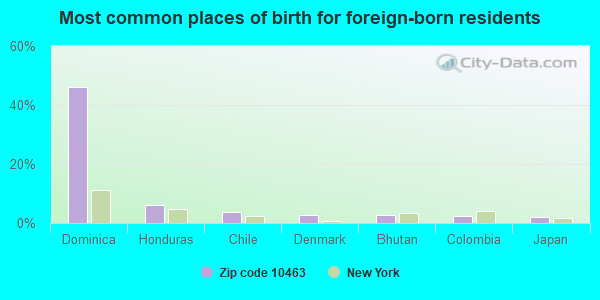
Foreign born population: 21,033 (30.4%) (66.3% of them are naturalized citizens)
This zip code:
30.4%
Whole state:
22.7%
46%Dominica
6%Honduras
4%Chile
3%Denmark
3%Bhutan
2%Colombia
2%Japan
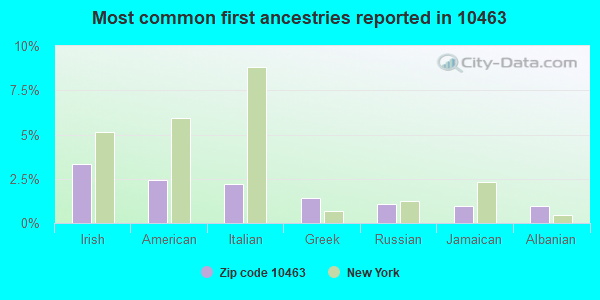
3%Irish
2%American
2%Italian
1%Greek
1%Russian
1%Jamaican
1%Albanian
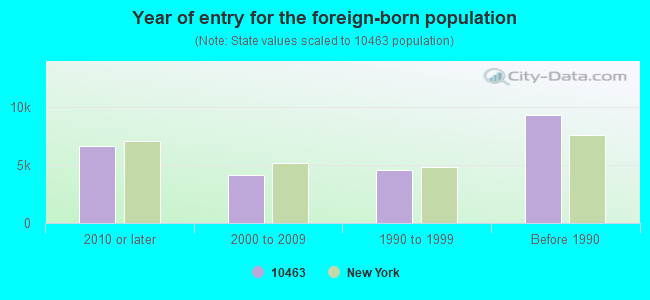
Year of entry for the foreign-born population
6,6042010 or later
4,1152000 to 2009
4,5701990 to 1999
9,279Before 1990
Major facilities with environmental interests located in this zip code:
ALADIN CLEANERS (3258 JOHNSON AVE in BRONX, NY)
AIR MINOR (AIRS/AFS) STATE MASTER (New York facility tracking) - AIR PROGRAM Conditionally Exempt Small Quantity Generators, less than 100 kg/month of hazardous waste (Resource Conservation and Recovery Act (tracking hazardous waste)) - notification Conditionally Exempt Small Quantity Generators, less than 100 kg/month of hazardous waste (Resource Conservation and Recovery Act (tracking hazardous waste)) - notification Business SIC classification: DRYCLEANING PLANTS, EXCEPT RUG CLEANING Business NAICS classification: DRYCLEANING AND LAUNDRY SERVICES (EXCEPT COIN-OPERATED). Organizations: RIVERDALE CENTER (CONTACT/OWNER)
, KWANG SUK LEE (CONTACT/OWNER)
, JOHNSON AVENUE CLEANERS INC (LEGALLY RESPONSIBLE PARTY)
Alternative names: ALADDIN CLEANERS, BEST PARKDALE CLEANERS
236 CANNON REALTY LLC (3605 SEDGWICK AVENUE in BRONX, NY)
(Integrated Compliance Information System) - ICIS-02-2001-9271, FORMAL ENFORCEMENT ACTION (Integrated Compliance Information System) - ICIS-02-2003-0006, FORMAL ENFORCEMENT ACTION COMPLIANCE ACTIVITY (Tracking inspections of insecticide, fungicide, and rodenticide, and toxic substances) Business SIC classification: REAL ESTATE AGENTS AND MANAGERS
ARMORY AUTO BODY SERVICE INC (72 WEST 225 STREET in BRONX, NY)
AIR SYNTHETIC MINOR (AIRS/AFS) STATE MASTER (New York facility tracking) - AIR PROGRAM (Resource Conservation and Recovery Act (tracking hazardous waste)) Business SIC classification: TOP, BODY, AND UPHOLSTERY REPAIR SHOPS AND PAINT SHOPS Business NAICS classification: AUTOMOTIVE BODY, PAINT, AND INTERIOR REPAIR AND MAINTENANCE. Organizations: OWNERNAME (CONTACT/OWNER)
Alternative names: BRONX ARMORY AUTO INC
ALBERT CLEANERS (56 VAN CORTLANDT AVENUE WEST in BRONX, NY)
AIR MINOR (AIRS/AFS) STATE MASTER (New York facility tracking) - AIR PROGRAM Business SIC classification: DRYCLEANING PLANTS, EXCEPT RUG CLEANING Business NAICS classification: DRYCLEANING AND LAUNDRY SERVICES (EXCEPT COIN-OPERATED). Organizations: MITCHELL S CLEANERS INC (LEGALLY RESPONSIBLE PARTY)
, J ROY CLEANERS INC (LEGALLY RESPONSIBLE PARTY)
, ALBERT CLEANERS INC (LEGALLY RESPONSIBLE PARTY)
Alternative names: J ROY CLEANERS INC, VAN CORTLANDT CLEANER
GREEN CASTLE CLEANERS (5695 BROADWAY in BRONX, NY)
AIR MINOR (AIRS/AFS) STATE MASTER (New York facility tracking) - AIR PROGRAM, HAZARDOUS WASTE PROGRAM Small Quantity Generators, between 100 kg and 1000 kg of hazardous waste/month (Resource Conservation and Recovery Act (tracking hazardous waste)) - notification Business SIC classification: DRYCLEANING PLANTS, EXCEPT RUG CLEANING Business NAICS classification: DRYCLEANING AND LAUNDRY SERVICES (EXCEPT COIN-OPERATED). Organizations: JOHN MCGILLION (CONTACT/OWNER)
, LAUNDROMAR/S/R BROADWAY 234 CORP (LEGALLY RESPONSIBLE PARTY)
231 STREET CLEANERS (212 WEST 231ST STREET in BRONX, NY)
AIR MINOR (AIRS/AFS) STATE MASTER (New York facility tracking) - AIR PROGRAM Business SIC classification: DRYCLEANING PLANTS, EXCEPT RUG CLEANING Organizations: 231 STREET CLEANERS INC (LEGALLY RESPONSIBLE PARTY)
Alternative names: J & I CLEANERS
236 CANNON HOLDING LLC (3470 CANNON PL in BRONX, NY)
AIR MINOR (AIRS/AFS) STATE MASTER (New York facility tracking) - AIR PROGRAM Business SIC classification: OPERATORS OF APARTMENT BUILDINGS Organizations: LEKAJ REALTY CORP, 236 CANNON HOLDING LLC Alternative names: 236 CROWN HOLDING LLC
AMALGAMATED HOUSING-130 GALE PL (130 GALE PL in BRONX, NY)
AIR MAJOR (AIRS/AFS) STATE MASTER (New York facility tracking) - AIR MAJOR, CRITERIA AND HAZARDOUS AIR POLLUTANT INVENTORY (Inventory of air pollution sources) Business SIC classification: OPERATORS OF DWELLINGS OTHER THAN APARTMENT BUILDINGS Business NAICS classification: LESSORS OF RESIDENTIAL BUILDINGS AND DWELLINGS. Organizations: FREDERICK H INYARD (FACILITY APPLICATION CONTACT)
, AMALGAMATED HOUSING CORPORATION (LEGALLY RESPONSIBLE PARTY)
Alternative names: AMALGAMATED HOUSING-130 GALE PLACE, AMALGAMATED HOUSING CORP.
GRACE S CLEANERS (3734 RIVERDALE AVE in BRONX, NY)
AIR MINOR (AIRS/AFS) STATE MASTER (New York facility tracking) - AIR PROGRAM, HAZARDOUS WASTE PROGRAM Business SIC classification: DRYCLEANING PLANTS, EXCEPT RUG CLEANING Business NAICS classification: DRYCLEANING AND LAUNDRY SERVICES (EXCEPT COIN-OPERATED). Organizations: A&S CLEANERS INC (LEGALLY RESPONSIBLE PARTY)
Alternative names: GRACE'S CLEANERS
3333 HENRY HUDSON PKWY BUILDING (3333 HENRY HUDSON PARKWAY in BRONX, NY)
AIR SYNTHETIC MINOR (AIRS/AFS) STATE MASTER (New York facility tracking) - AIR PROGRAM Business SIC classification: OPERATORS OF APARTMENT BUILDINGS Business NAICS classification: LESSORS OF RESIDENTIAL BUILDINGS AND DWELLINGS. Organizations: WHITEHALL TENANTS CORP (LEGALLY RESPONSIBLE PARTY)
Alternative names: 3333 HENRY HUDSON PARKWAY BUILDING
3601 JOHNSON AVENUE BUILDING (3601 JOHNSON AVENUE in BRONX, NY)
AIR SYNTHETIC MINOR (AIRS/AFS) STATE MASTER (New York facility tracking) - AIR PROGRAM Business SIC classification: OPERATORS OF APARTMENT BUILDINGS Business NAICS classification: LESSORS OF RESIDENTIAL BUILDINGS AND DWELLINGS. Organizations: ROBERT E HILL INC (LEGALLY RESPONSIBLE PARTY)
3850 SEDGWICK AVENUE BUILDING (3850 SEDGWICK AVENUE in BRONX, NY)
AIR SYNTHETIC MINOR (AIRS/AFS) STATE MASTER (New York facility tracking) - AIR PROGRAM Business SIC classification: OPERATORS OF APARTMENT BUILDINGS Business NAICS classification: LESSORS OF RESIDENTIAL BUILDINGS AND DWELLINGS. Organizations: MUTUAL HOUSING ASSOCIATES INC (LEGALLY RESPONSIBLE PARTY)
645 WEST 239TH STREET BUILDING (645 WEST 239 STREET in BRONX, NY)
AIR SYNTHETIC MINOR (AIRS/AFS) STATE MASTER (New York facility tracking) - AIR PROGRAM Business SIC classification: OPERATORS OF APARTMENT BUILDINGS Business NAICS classification: LESSORS OF RESIDENTIAL BUILDINGS AND DWELLINGS. Organizations: WEST 239 OWNERS INC (LEGALLY RESPONSIBLE PARTY)
Alternative names: WEST 239 OWNERS INCORPORATED 645 W 239 STREET
Housing units lacking complete plumbing facilities: 0.6% Housing units lacking complete kitchen facilities: 1.9%
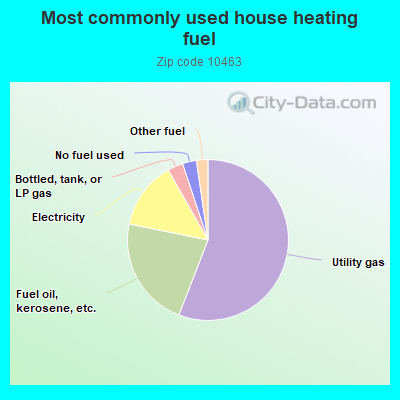
55.9%Utility gas
22.3%Fuel oil, kerosene, etc.
13.6%Electricity
3.1%Bottled, tank, or LP gas
2.8%No fuel used
2.3%Other fuel
Population in 1990: 67,435.
Place of birth for U.S.-born residents:
This state: 36,865
Northeast: 2,699
Midwest: 1,638
South: 2,307
West: 1,095
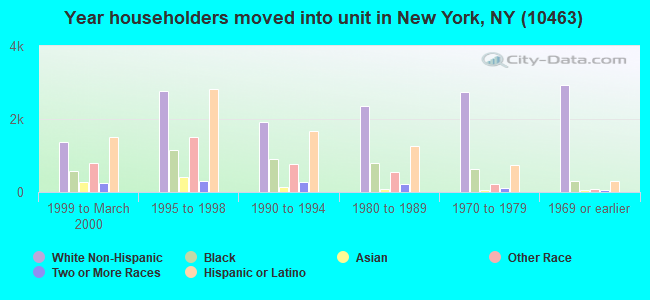
65% of the 10463 zip code residents lived in the same house 5 years ago. Out of people who lived in different houses, 50% lived in this county. Out of people who lived in different counties, 50% lived in New York.
92% of the 10463 zip code residents lived in the same house 1 year ago. Out of people who lived in different houses, 53% moved from this county. Out of people who lived in different houses, 36% moved from different county within same state. Out of people who lived in different houses, 6% moved from different state. Out of people who lived in different houses, 4% moved from abroad.
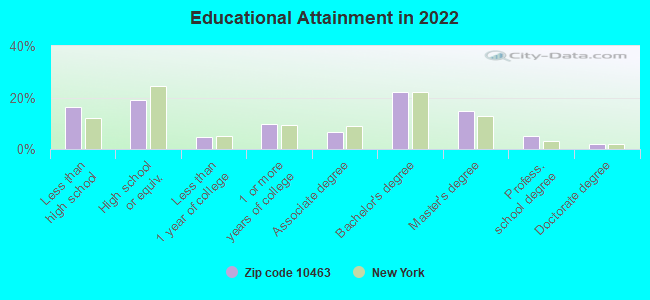
Private vs. public school enrollment:
Students in private schools in grades 1 to 8 (elementary and middle school): 1,245
Here:
18.4%
New York:
15.6%
Students in private schools in grades 9 to 12 (high school): 407
Here:
11.6%
New York:
15.0%
Students in private undergraduate colleges: 1,376
Here:
38.6%
New York:
39.2%
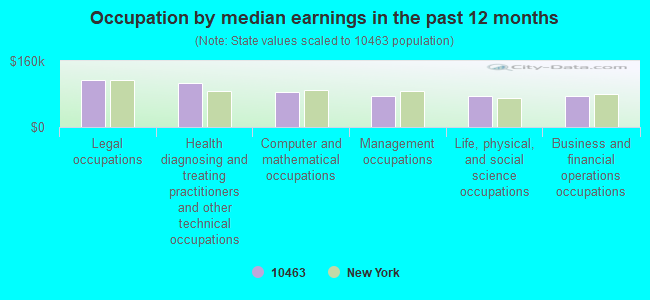
Occupation by median earnings in the past 12 months ($)
112,909Legal occupations
106,683Health diagnosing and treating practitioners and other technical occupations
84,988Computer and mathematical occupations
76,235Management occupations
74,843Life, physical, and social science occupations
74,039Business and financial operations occupations
Companies with federal contracts located in this zip code:
ZAIDER CONSULTING LTD (3453 CORLEAR AVE in BRONX, NY; small business)
$35,000 with Navy for Other Professional Services. Taking place in MD. Signed on 2005-06-20. Completion date: 2005-07-12.
Top industries in this zip code by the number of employees in 2005:
Health Care and Social Assistance: Nursing Care Facilities (500-999 employees: 1 establishment, 250-499 employees: 3 establishments, 100-249 employees: 4 establishments, 10-19 employees: 1 establishment, 1-4 employees: 1 establishment)
Health Care and Social Assistance: Home Health Care Services (250-499: 2, 5-9: 1, 1-4: 1)
Real Estate and Rental and Leasing: Residential Property Managers (250-499: 1, 100-249: 1, 20-49: 1, 10-19: 2, 5-9: 2, 1-4: 12)
Real Estate and Rental and Leasing: Lessors of Residential Buildings and Dwellings (50-99: 2, 20-49: 2, 10-19: 4, 5-9: 5, 1-4: 97)
Health Care and Social Assistance: Offices of Physicians (except Mental Health Specialists) (20-49: 2, 10-19: 3, 5-9: 17, 1-4: 31)
Other Services (except Public Administration): Other Similar Organizations (except Business, Professional, Labor, and Political Organizations) (10-19: 5, 5-9: 15, 1-4: 49)
2007 - 2018 National Fire Incident Reporting System (NFIRS) incidents
Based on the data from the years 2007 - 2018 the average number of fire incidents per year is 272. The highest number of fires - 315 took place in 2008, and the least - 159 in 2007. The data has a rising trend.
When looking into fire subcategories, the most incidents belonged to: Structure Fires (76.8%), and Outside Fires (14.9%).
Fire incident types reported to NFIRS in Zip Code 10463


 Nearest zip codes: 10468, 10471, 10034, 10458, 10453, 10040.


 Based on the data from the years 2007 - 2018 the average number of fire incidents per year is 272. The highest number of fires - 315 took place in 2008, and the least - 159 in 2007. The data has a rising trend.
 When looking into fire subcategories, the most incidents belonged to: Structure Fires (76.8%), and Outside Fires (14.9%).