Estimated zip code population in 2022: 42,960 Zip code population in 2010: 41,905 Zip code population in 2000: 46,599
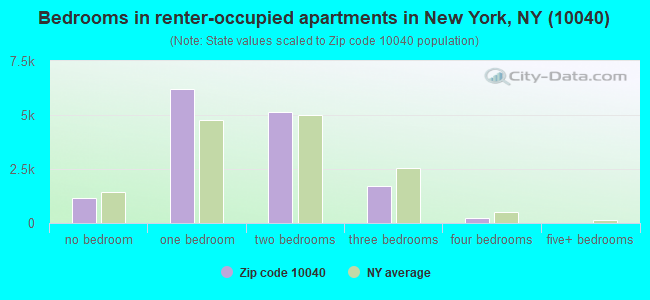
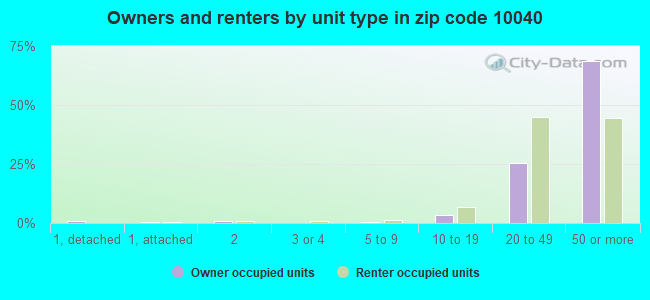
Houses and condos: 17,617 Renter-occupied apartments: 14,478
% of renters here:
85%
State:
46%
March 2022 cost of living index in zip code 10040: 149.2 (very high, U.S. average is 100)
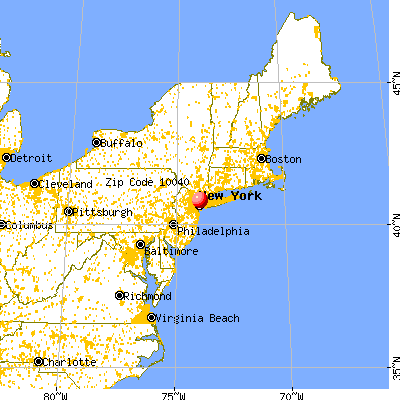
Land area: 0.4 sq. mi. Water area: 0.0 sq. mi.
Population density: 113,983 people per square mile
(very high).
OSM Map
General Map
Google Map
MSN Map
OSM Map
General Map
Google Map
MSN Map
OSM Map
General Map
Google Map
MSN Map
OSM Map
General Map
Google Map
MSN Map
Please wait while loading the map...
Real estate property taxes paid for housing units in 2022:
This zip code:
0.8% ($3,748)
New York:
1.5% ($6,180)
Median real estate property taxes paid for housing units with mortgages in 2022: $4,256 (0.7%) Median real estate property taxes paid for housing units with no mortgage in 2022: $1,939 (0.5%)
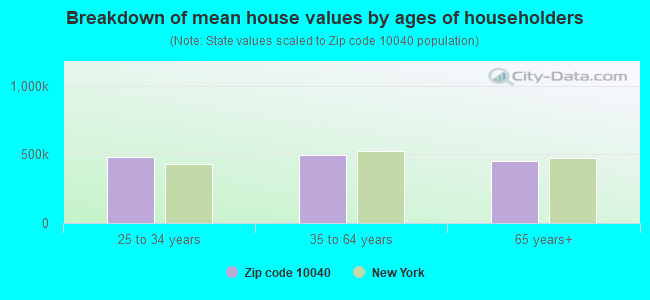
Estimated median house/condo value in 2022: $473,266
10040:
$473,266
New York:
$400,400
According to our research of New York and other state lists, there were 24 registered sex offenders living in 10040 zip code as of April 27, 2024. The ratio of all residents to sex offenders in zip code 10040 is 1,903 to 1. The ratio of registered sex offenders to all residents in this zip code is lower than the state average.
Median resident age:
This zip code:
41.0 years
New York median age:
40.0 years
Average household size:
This zip code:
2.5 people
New York:
2.5 people
Averages for the 2020 tax year for zip code 10040, filed in 2021:
Average Adjusted Gross Income (AGI) in 2020: $47,877 (Individual Income Tax Returns)
Here:
$47,877
State:
$90,930
Salary/wage: $46,739 (reported on 75.7% of returns)
Here:
$46,739
State:
$72,104
(% of AGI for various income ranges: 825.3% for AGIs below $25k, 3224.4% for AGIs $25k-50k, 6819.3% for AGIs $50k-75k, 10364.7% for AGIs $75k-100k, 19182.8% for AGIs $100k-200k, 69680.6% for AGIs over 200k)
Taxable interest for individuals: $1,006 (reported on 17.4% of returns)
This zip code:
$1,006
New York:
$3,075
(% of AGI for various income ranges: 5.4% for AGIs below $25k, 9.4% for AGIs $25k-50k, 27.3% for AGIs $50k-75k, 36.0% for AGIs $75k-100k, 110.6% for AGIs $100k-200k, 591.2% for AGIs over 200k)
Ordinary dividends: $4,857 (reported on 10.8% of returns)
Here:
$4,857
State:
$11,095
(% of AGI for various income ranges: 9.9% for AGIs below $25k, 18.5% for AGIs $25k-50k, 54.3% for AGIs $50k-75k, 126.8% for AGIs $75k-100k, 302.7% for AGIs $100k-200k, 2687.6% for AGIs over 200k)
Net capital gain/loss in AGI: +$7,995 (reported on 10.4% of returns)
Here:
+$7,995
State:
+$44,925
(% of AGI for various income ranges: 4.8% for AGIs below $25k, 12.5% for AGIs $25k-50k, 40.8% for AGIs $50k-75k, 127.3% for AGIs $75k-100k, 543.1% for AGIs $100k-200k, 5885.3% for AGIs over 200k)
Profit/loss from business: +$7,369 (reported on 22.5% of returns)
Here:
+$7,369
State:
+$14,940
(% of AGI for various income ranges: 228.8% for AGIs below $25k, 138.8% for AGIs $25k-50k, 131.3% for AGIs $50k-75k, 330.1% for AGIs $75k-100k, 553.0% for AGIs $100k-200k, 2545.9% for AGIs over 200k)
Taxable individual retirement arrangement distribution: $13,228 (reported on 2.7% of returns)
10040:
$13,228
New York:
$19,609
(% of AGI for various income ranges: 14.8% for AGIs below $25k, 23.3% for AGIs $25k-50k, 56.8% for AGIs $50k-75k, 102.8% for AGIs $75k-100k, 224.2% for AGIs $100k-200k, 844.1% for AGIs over 200k)
Self-employed (Keogh) retirement plans: $18,144 (reported on 0.4% of returns)
10040:
$18,144
New York:
$32,497
(% of AGI for various income ranges: 15.5% for AGIs $50k-75k, 38.1% for AGIs $100k-200k, 542.4% for AGIs over 200k)
Total itemized deductions: $26,138 (reported on 4.6% of returns)
Here:
$26,138
State:
$39,326
(% of AGI for various income ranges: 14.6% for AGIs below $25k, 41.1% for AGIs $25k-50k, 138.5% for AGIs $50k-75k, 367.9% for AGIs $75k-100k, 968.6% for AGIs $100k-200k, 4384.7% for AGIs over 200k)
Charity contributions: $6,015 (reported on 3.6% of returns)
Here:
$6,015
State:
$15,420
(% of AGI for various income ranges: 0.3% for AGIs below $25k, 5.9% for AGIs $25k-50k, 18.8% for AGIs $50k-75k, 51.8% for AGIs $75k-100k, 158.9% for AGIs $100k-200k, 1167.1% for AGIs over 200k)
Taxes paid: $8,697 (reported on 4.6% of returns)
10040:
$8,697
State:
$9,183
(% of AGI for various income ranges: 3.8% for AGIs below $25k, 13.4% for AGIs $25k-50k, 42.0% for AGIs $50k-75k, 148.1% for AGIs $75k-100k, 357.3% for AGIs $100k-200k, 1211.2% for AGIs over 200k)
Earned income credit: $2,126 (reported on 22.3% of returns)
Here:
$2,126
State:
$2,138
(% of AGI for various income ranges: 117.5% for AGIs below $25k, 69.9% for AGIs $25k-50k, 0.5% for AGIs $50k-75k)
Percentage of individuals using paid preparers for their 2020 taxes: 94.2%
Here:
94%
State:
95%
(% for various income ranges: 92.3% for AGIs below $25k, 96.2% for AGIs $25k-50k, 94.8% for AGIs $50k-75k, 94.0% for AGIs $75k-100k, 95.1% for AGIs $100k-200k, 95.9% for AGIs over 200k)
Averages for the 2012 tax year for zip code 10040, filed in 2013:
Average Adjusted Gross Income (AGI) in 2012: $36,260 (Individual Income Tax Returns)
Here:
$36,260
State:
$77,088
Salary/wage: $37,954 (reported on 80.3% of returns)
Here:
$37,954
State:
$60,593
(% of AGI for various income ranges: 69.4% for AGIs below $25k, 90.8% for AGIs $25k-50k, 89.6% for AGIs $50k-75k, 87.3% for AGIs $75k-100k, 84.7% for AGIs $100k-200k, 76.5% for AGIs over 200k)
Taxable interest for individuals: $875 (reported on 19.3% of returns)
This zip code:
$875
New York:
$3,125
(% of AGI for various income ranges: 0.5% for AGIs below $25k, 0.3% for AGIs $25k-50k, 0.4% for AGIs $50k-75k, 0.5% for AGIs $75k-100k, 0.7% for AGIs $100k-200k, 0.6% for AGIs over 200k)
Ordinary dividends: $3,888 (reported on 8.6% of returns)
Here:
$3,888
State:
$10,299
(% of AGI for various income ranges: 0.6% for AGIs below $25k, 0.5% for AGIs $25k-50k, 0.7% for AGIs $50k-75k, 0.7% for AGIs $75k-100k, 1.6% for AGIs $100k-200k, 2.2% for AGIs over 200k)
Net capital gain/loss in AGI: +$3,535 (reported on 7.6% of returns)
Here:
+$3,535
State:
+$42,474
(% of AGI for various income ranges: 0.2% for AGIs $75k-100k, 0.8% for AGIs $100k-200k, 7.0% for AGIs over 200k)
Profit/loss from business: +$8,743 (reported on 23.9% of returns)
Here:
+$8,743
State:
+$16,168
(% of AGI for various income ranges: 20.9% for AGIs below $25k, 2.7% for AGIs $25k-50k, 1.8% for AGIs $50k-75k, 2.6% for AGIs $75k-100k, 3.0% for AGIs $100k-200k, 3.0% for AGIs over 200k)
Taxable individual retirement arrangement distribution: $11,941 (reported on 2.9% of returns)
10040:
$11,941
New York:
$17,621
(% of AGI for various income ranges: 0.6% for AGIs below $25k, 0.5% for AGIs $25k-50k, 1.0% for AGIs $50k-75k, 1.0% for AGIs $75k-100k, 1.3% for AGIs $100k-200k, 2.2% for AGIs over 200k)
Self-employment retirement plans: $11,862 (reported on 0.4% of returns)
10040:
$11,862
New York:
$27,330
Total itemized deductions: $18,895 (23% of AGI, reported on 21.3% of returns)
Here:
$18,895
State:
$34,985
Here:
23.3% of AGI
State:
21.3% of AGI
(% of AGI for various income ranges: 3.5% for AGIs below $25k, 9.3% for AGIs $25k-50k, 11.7% for AGIs $50k-75k, 13.5% for AGIs $75k-100k, 16.3% for AGIs $100k-200k, 16.7% for AGIs over 200k)
Charity contributions: $2,425 (reported on 16.5% of returns)
Here:
$2,425
State:
$5,572
(% of AGI for various income ranges: 0.2% for AGIs below $25k, 0.8% for AGIs $25k-50k, 1.3% for AGIs $50k-75k, 1.4% for AGIs $75k-100k, 1.7% for AGIs $100k-200k, 1.7% for AGIs over 200k)
Taxes paid: $8,007 (reported on 21.1% of returns)
10040:
$8,007
State:
$18,656
(% of AGI for various income ranges: 0.5% for AGIs below $25k, 2.1% for AGIs $25k-50k, 4.4% for AGIs $50k-75k, 6.3% for AGIs $75k-100k, 8.7% for AGIs $100k-200k, 10.7% for AGIs over 200k)
Earned income credit: $2,370 (reported on 33.6% of returns)
Here:
$2,370
State:
$2,230
(% of AGI for various income ranges: 11.0% for AGIs below $25k, 1.1% for AGIs $25k-50k)
Percentage of individuals using paid preparers for their 2012 taxes: 72.7%
Here:
73%
State:
66%
(% for various income ranges: 75.6% for AGIs below $25k, 72.4% for AGIs $25k-50k, 66.8% for AGIs $50k-75k, 63.8% for AGIs $75k-100k, 65.3% for AGIs $100k-200k, 73.9% for AGIs over 200k)
Averages for the 2004 tax year for zip code 10040, filed in 2005:
Average Adjusted Gross Income (AGI) in 2004: $27,909 (Individual Income Tax Returns)
Here:
$27,909
State:
$59,519
Salary/wage: $29,427 (reported on 79.9% of returns)
Here:
$29,427
State:
$50,673
(% of AGI for various income ranges: 54.5% for AGIs below $10k, 79.2% for AGIs $10k-25k, 93.2% for AGIs $25k-50k, 88.2% for AGIs $50k-75k, 84.7% for AGIs $75k-100k, 77.4% for AGIs over 100k)
Taxable interest for individuals: $1,269 (reported on 25.2% of returns)
This zip code:
$1,269
New York:
$2,377
(% of AGI for various income ranges: 1.7% for AGIs below $10k, 0.9% for AGIs $10k-25k, 0.7% for AGIs $25k-50k, 1.2% for AGIs $50k-75k, 2.1% for AGIs $75k-100k, 1.5% for AGIs over 100k)
Taxable dividends: $3,005 (reported on 9.7% of returns)
Here:
$3,005
State:
$5,394
(% of AGI for various income ranges: 1.1% for AGIs below $10k, 0.7% for AGIs $10k-25k, 0.6% for AGIs $25k-50k, 1.1% for AGIs $50k-75k, 1.6% for AGIs $75k-100k, 2.1% for AGIs over 100k)
Net capital gain/loss: +$3,127 (reported on 7.6% of returns)
Here:
+$3,127
State:
+$23,581
(% of AGI for various income ranges: -0.6% for AGIs below $10k, -0.1% for AGIs $10k-25k, 0.0% for AGIs $25k-50k, 0.5% for AGIs $50k-75k, 0.8% for AGIs $75k-100k, 4.7% for AGIs over 100k)
Profit/loss from business: +$7,234 (reported on 25.9% of returns)
Here:
+$7,234
State:
+$13,809
(% of AGI for various income ranges: 46.8% for AGIs below $10k, 14.0% for AGIs $10k-25k, 1.6% for AGIs $25k-50k, 1.1% for AGIs $50k-75k, 2.0% for AGIs $75k-100k, 3.2% for AGIs over 100k)
IRA payment deduction: $2,805 (reported on 1.8% of returns)
10040:
$2,805
New York:
$3,115
(% of AGI for various income ranges: 0.1% for AGIs below $10k, 0.2% for AGIs $10k-25k, 0.2% for AGIs $25k-50k, 0.2% for AGIs $50k-75k, 0.1% for AGIs $75k-100k, 0.1% for AGIs over 100k)
Self-employed pension: $7,523 (reported on 0.3% of returns)
Here:
$7,523
New York:
$19,016
Total itemized deductions: $15,915 (27% of AGI, reported on 21.0% of returns)
Here:
$15,915
State:
$25,864
Here:
26.7% of AGI
State:
21.9% of AGI
(% of AGI for various income ranges: 2.8% for AGIs below $10k, 5.3% for AGIs $10k-25k, 11.8% for AGIs $25k-50k, 15.5% for AGIs $50k-75k, 16.2% for AGIs $75k-100k, 17.8% for AGIs over 100k)
Charity contributions deductions: $2,540 (4% of AGI, reported on 18.4% of returns)
Here:
$2,540
State:
$4,439
Here:
4.1% of AGI
State:
3.6% of AGI
(% of AGI for various income ranges: 0.2% for AGIs below $10k, 0.6% for AGIs $10k-25k, 1.6% for AGIs $25k-50k, 2.4% for AGIs $50k-75k, 2.6% for AGIs $75k-100k, 2.4% for AGIs over 100k)
Total tax: $3,575 (reported on 68.7% of returns)
10040:
$3,575
State:
$11,730
(% of AGI for various income ranges: 7.3% for AGIs below $10k, 4.0% for AGIs $10k-25k, 6.3% for AGIs $25k-50k, 10.3% for AGIs $50k-75k, 12.4% for AGIs $75k-100k, 17.1% for AGIs over 100k)
Earned income credit: $2,056 (reported on 40.1% of returns)
Here:
$2,056
State:
$1,757
Percentage of individuals using paid preparers for their 2004 taxes: 73.9%
Here:
74%
State:
67%
(% for various income ranges: 75.1% for AGIs below $10k, 78.6% for AGIs $10k-25k, 70.3% for AGIs $25k-50k, 64.7% for AGIs $50k-75k, 71.5% for AGIs $75k-100k, 69.6% for AGIs over 100k)
Likely homosexual households (counted as self-reported same-sex unmarried-partner households)
Lesbian couples: 0.2% of all households
Gay men: 0.4% of all households
Household received Food Stamps/SNAP in the past 12 months: 5,393 Household did not receive Food Stamps/SNAP in the past 12 months: 11,826
Women who had a birth in the past 12 months: 351 (99 now married, 260 unmarried) Women who did not have a birth in the past 12 months: 10,472 (2,962 now married, 7,550 unmarried)
Housing units in zip code 10040 with a mortgage: 1,236 (95 second mortgage, 23 home equity loan, 49 both second mortgage and home equity loan) Median monthly owner costs for units with a mortgage: $1,972 Median monthly owner costs for units without a mortgage: $596
Residents with income below the poverty level in 2022:
This zip code:
18.9%
Whole state:
14.3%
Residents with income below 50% of the poverty level in 2022:
This zip code:
10.8%
Whole state:
6.8%
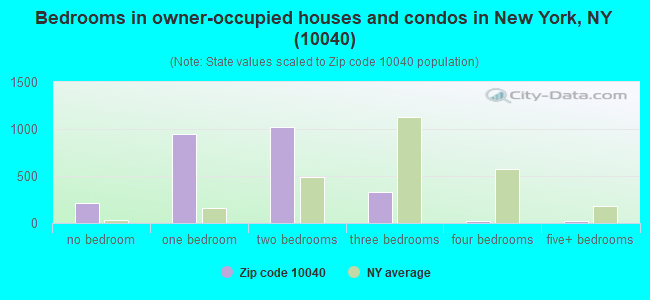
Median number of rooms in houses and condos:
Here:
3.6
State:
6.3
Median number of rooms in apartments:
Here:
3.4
State:
3.8
Notable locations in this zip code not listed on our city pages
Notable locations in zip code 10040: Margaret Corbin Plaza (A), Cabrini Terrace (B), Fort Tryon Nursing Home (C), Thayer Street Telephone Exchange (D), Inwood Regional Branch New York Public Library (E). Display/hide their locations on the map
Churches in zip code 10040 include: Our Lady Queen of Martyrs Roman Catholic Church (A), Mount Sinai Synagogue (B), Kingdom Hall of Jehovah's Witnesses (C), Inwood Jewish Center (D), Evangelical Lutheran Church of Our Saviours Atonement (E). Display/hide their locations on the map
Parks in zip code 10040 include: Gorman Memorial Park (1), Jacob K Javits Athletic Field (2), Jacob Javits Playground (3). Display/hide their locations on the map
In group quarters: 961 (-1 institutionalized population)
Size of family households: 3,201 2-persons, 3,037 3-persons, 1,614 4-persons, 469 5-persons, 488 6-persons, 286 7-or-more-persons
Size of nonfamily households: 6,374 1-person, 1,306 2-persons, 166 3-persons
2,793 married couples with children.
2,817 single-parent households (517 men, 2,300 women).
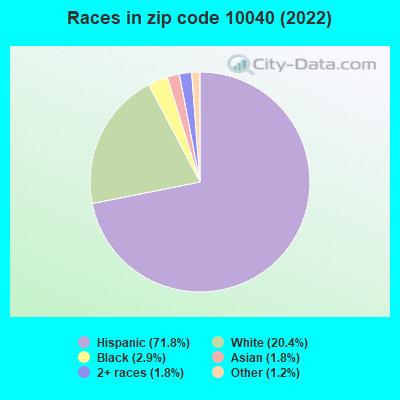
26.9% of residents of 10040 zip code speak English at home.
66.9% of residents speak Spanish at home (45% very well, 18% well, 22% not well, 14% not at all).
4.4% of residents speak other Indo-European language at home (76% very well, 16% well, 7% not well).
0.9% of residents speak Asian or Pacific Island language at home (71% very well, 27% well, 2% not well).
1.0% of residents speak other language at home (92% very well, 7% well, 1% not well).
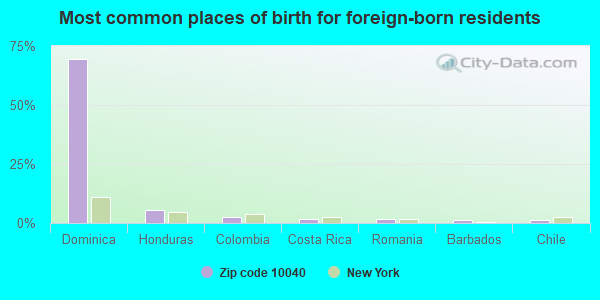
Foreign born population: 20,960 (48.8%) (58.9% of them are naturalized citizens)
Facilities with environmental interests located in this zip code:
GEORGE WASHINGTON HIGH SCHOOL (549 AUDUBON AVE in NEW YORK, NY)
STATE MASTER (New York facility tracking) - AIR PROGRAM (Resource Conservation and Recovery Act (tracking hazardous waste)) Business SIC and NAICS classification: ELEMENTARY AND SECONDARY SCHOOLS Organizations: NYC DEPT OF EDUCATION (LEGALLY RESPONSIBLE PARTY)
ISABELLA GERIATRIC CENTER (525 AUDUBON AVE in NEW YORK CITY, NY)
AIR SYNTHETIC MINOR (AIRS/AFS) STATE MASTER (New York facility tracking) - AIR PROGRAM Business SIC classification: OPERATORS OF DWELLINGS OTHER THAN APARTMENT BUILDINGS; SKILLED NURSING CARE FACILITIES Business NAICS classification: LESSORS OF RESIDENTIAL BUILDINGS AND DWELLINGS.
GEORGE WASHINGTON HS ( in NEW YORK, NY)
(National Center for Education Statistics) - STATE ID-317800010465 Organizations: NEW YORK CITY PUBLIC SCHOOLS (SCHOOL DISTRICT)
GEORGE WASHINGTON YABC ( in NEW YORK, NY)
(National Center for Education Statistics) - STATE ID-317800010457 Organizations: NEW YORK CITY PUBLIC SCHOOLS (SCHOOL DISTRICT)
HEALTH CAREERS & SCIENCES HS ( in NEW YORK, NY)
(National Center for Education Statistics) - STATE ID-317800010468 Organizations: NEW YORK CITY PUBLIC SCHOOLS (SCHOOL DISTRICT)
INTNTL HS FOR BUSINESS & FINANCE ( in NEW YORK, NY)
(National Center for Education Statistics) - STATE ID-317800010462 Organizations: NEW YORK CITY PUBLIC SCHOOLS (SCHOOL DISTRICT)
IS 218 SALOME URENA MIDDLE ACADEMIES ( in NEW YORK, NY)
(National Center for Education Statistics) - STATE ID-310600010218 Organizations: NEW YORK CITY PUBLIC SCHOOLS (SCHOOL DISTRICT)
CON ED M/H 63639 (HIGHBRIDGE PARK in MANHATTAN, NY)
HAZARDOUS WASTE BIENNIAL REPORTER (Resource Conservation and Recovery Act (tracking hazardous waste)) (Resource Conservation and Recovery Act (tracking hazardous waste))
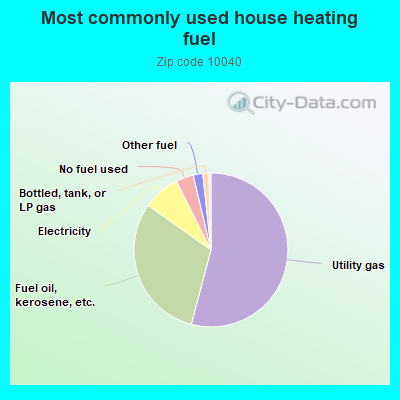
Housing units lacking complete plumbing facilities: 0.7% Housing units lacking complete kitchen facilities: 1.0%
54.2%Utility gas
30.7%Fuel oil, kerosene, etc.
7.8%Electricity
3.7%No fuel used
2.0%Other fuel
1.3%Bottled, tank, or LP gas
Population in 1990: 39,780. Population change in the 1990s: +6,819 (+17.1%).
Place of birth for U.S.-born residents:
This state: 15,133
Northeast: 1,742
Midwest: 1,224
South: 1,210
West: 1,336
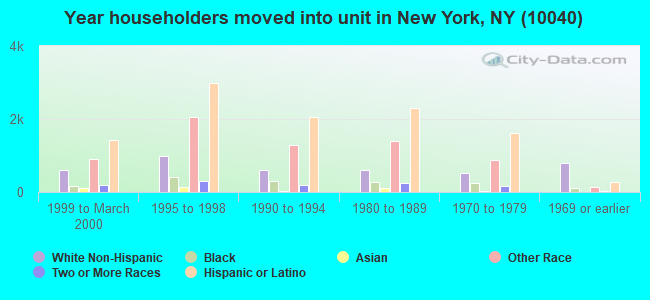
66% of the 10040 zip code residents lived in the same house 5 years ago. Out of people who lived in different houses, 65% lived in this county. Out of people who lived in different counties, 50% lived in New York.
89% of the 10040 zip code residents lived in the same house 1 year ago. Out of people who lived in different houses, 55% moved from this county. Out of people who lived in different houses, 21% moved from different county within same state. Out of people who lived in different houses, 9% moved from different state. Out of people who lived in different houses, 17% moved from abroad.
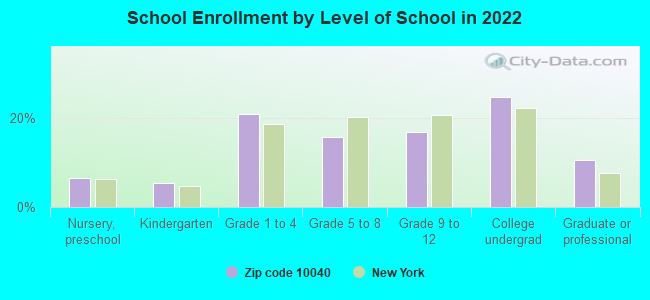
Private vs. public school enrollment:
Students in private schools in grades 1 to 8 (elementary and middle school): 568
Here:
16.3%
New York:
15.6%
Students in private schools in grades 9 to 12 (high school): 129
Here:
8.1%
New York:
15.0%
Students in private undergraduate colleges: 683
Here:
29.5%
New York:
39.2%
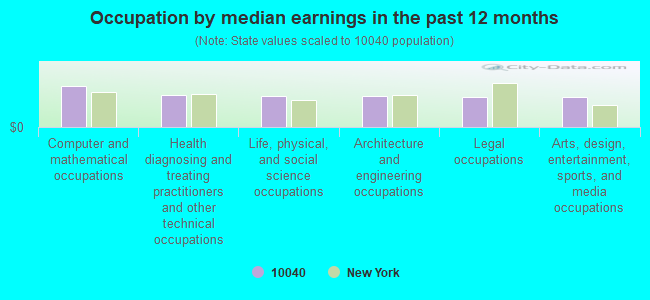
Occupation by median earnings in the past 12 months ($)
113,069Computer and mathematical occupations
88,192Health diagnosing and treating practitioners and other technical occupations
87,790Life, physical, and social science occupations
85,825Architecture and engineering occupations
83,019Legal occupations
82,726Arts, design, entertainment, sports, and media occupations
Companies with federal contracts located in this zip code:
ANDERSEN, THOMAS M (34 HILLSIDE #4-H in NEW YORK, NY; small business) : $20,000 in 2 contractsin 2005
$10,000 with Army for Other Education and Training Services. Signed on 2005-11-29. Completion date: 2005-12-10.
$10,000 with Army for Other Professional Services. Signed on 2005-07-29. Completion date: 2005-08-18.
PROVISTAS, INCORPORATED (12 DONGAN PLACE SUITE 203 in NEW YORK, NY; small business)
$2,644 with Navy for Medical and Surgical Instruments, Equipment, and Supplies. Signed on 2004-12-15. Completion date: 2005-01-10.
Top industries in this zip code by the number of employees in 2005:
Health Care and Social Assistance: Nursing Care Facilities (over 1000 employees: 1 establishment, 1-4 employees: 1 establishment)
Health Care and Social Assistance: Home Health Care Services (500-999: 1, 50-99: 1)
Real Estate and Rental and Leasing: Lessors of Residential Buildings and Dwellings (5-9: 5, 1-4: 77)
Educational Services: Elementary and Secondary Schools (50-99: 2, 20-49: 1)
2007 - 2018 National Fire Incident Reporting System (NFIRS) incidents
According to the data from the years 2007 - 2018 the average number of fires per year is 189. The highest number of fire incidents - 262 took place in 2008, and the least - 148 in 2012. The data has a growing trend.
When looking into fire subcategories, the most reports belonged to: Structure Fires (71.8%), and Outside Fires (19.1%).
Fire incident types reported to NFIRS in Zip Code 10040


 Nearest zip codes: 10033, 10034, 10453, 10452, 10032, 10039.


 According to the data from the years 2007 - 2018 the average number of fires per year is 189. The highest number of fire incidents - 262 took place in 2008, and the least - 148 in 2012. The data has a growing trend.
 When looking into fire subcategories, the most reports belonged to: Structure Fires (71.8%), and Outside Fires (19.1%).