Estimated zip code population in 2022: 57,779 Zip code population in 2010: 53,926 Zip code population in 2000: 58,259
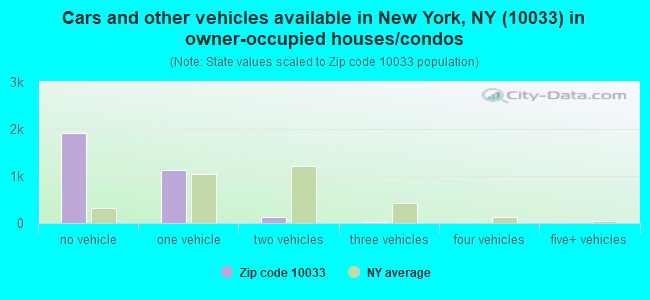
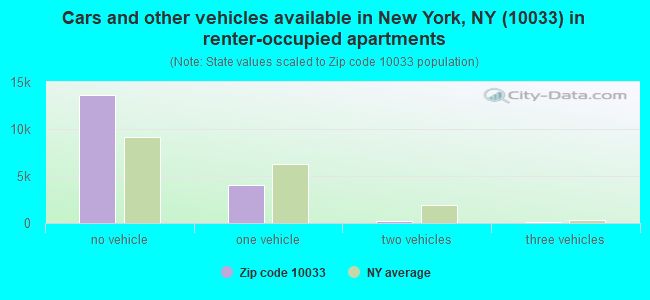
Houses and condos: 22,216 Renter-occupied apartments: 17,968
% of renters here:
85%
State:
46%
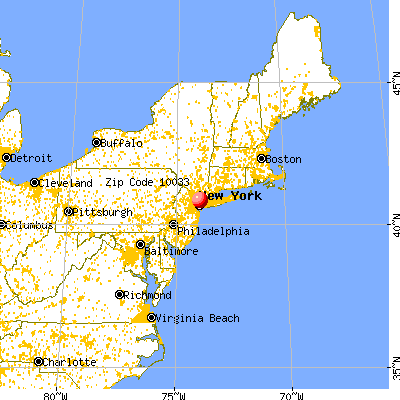
March 2022 cost of living index in zip code 10033: 151.7 (very high, U.S. average is 100)
Land area: 0.6 sq. mi. Water area: 0.0 sq. mi.
Population density: 95,575 people per square mile
(very high).
OSM Map
General Map
Google Map
MSN Map
OSM Map
General Map
Google Map
MSN Map
OSM Map
General Map
Google Map
MSN Map
OSM Map
General Map
Google Map
MSN Map
Please wait while loading the map...
Real estate property taxes paid for housing units in 2022:
This zip code:
0.6% ($4,724)
New York:
1.5% ($6,180)
Median real estate property taxes paid for housing units with mortgages in 2022: $4,281 (0.5%) Median real estate property taxes paid for housing units with no mortgage in 2022: $5,243 (0.8%)
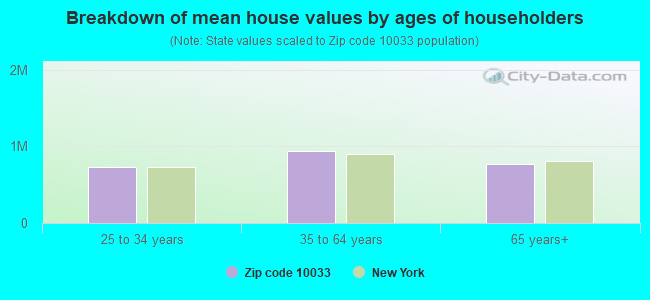
Estimated median house/condo value in 2022: $732,312
10033:
$732,312
New York:
$400,400
According to our research of New York and other state lists, there were 27 registered sex offenders living in 10033 zip code as of April 27, 2024. The ratio of all residents to sex offenders in zip code 10033 is 2,230 to 1. The ratio of registered sex offenders to all residents in this zip code is lower than the state average.
Median resident age:
This zip code:
37.7 years
New York median age:
40.0 years
Average household size:
This zip code:
2.7 people
New York:
2.5 people
Averages for the 2020 tax year for zip code 10033, filed in 2021:
Average Adjusted Gross Income (AGI) in 2020: $49,234 (Individual Income Tax Returns)
Here:
$49,234
State:
$90,930
Salary/wage: $48,156 (reported on 75.6% of returns)
Here:
$48,156
State:
$72,104
(% of AGI for various income ranges: 865.3% for AGIs below $25k, 3280.1% for AGIs $25k-50k, 6800.6% for AGIs $50k-75k, 10748.0% for AGIs $75k-100k, 19405.5% for AGIs $100k-200k, 83538.8% for AGIs over 200k)
Taxable interest for individuals: $1,062 (reported on 19.2% of returns)
This zip code:
$1,062
New York:
$3,075
(% of AGI for various income ranges: 5.6% for AGIs below $25k, 8.0% for AGIs $25k-50k, 17.8% for AGIs $50k-75k, 44.1% for AGIs $75k-100k, 138.1% for AGIs $100k-200k, 883.8% for AGIs over 200k)
Ordinary dividends: $4,969 (reported on 11.6% of returns)
Here:
$4,969
State:
$11,095
(% of AGI for various income ranges: 8.9% for AGIs below $25k, 14.5% for AGIs $25k-50k, 48.2% for AGIs $50k-75k, 140.4% for AGIs $75k-100k, 469.2% for AGIs $100k-200k, 2513.8% for AGIs over 200k)
Net capital gain/loss in AGI: +$11,813 (reported on 11.4% of returns)
Here:
+$11,813
State:
+$44,925
(% of AGI for various income ranges: 3.8% for AGIs below $25k, 17.7% for AGIs $25k-50k, 60.6% for AGIs $50k-75k, 138.9% for AGIs $75k-100k, 644.5% for AGIs $100k-200k, 10343.8% for AGIs over 200k)
Profit/loss from business: +$8,665 (reported on 23.0% of returns)
Here:
+$8,665
State:
+$14,940
(% of AGI for various income ranges: 215.6% for AGIs below $25k, 128.2% for AGIs $25k-50k, 192.5% for AGIs $50k-75k, 301.1% for AGIs $75k-100k, 832.1% for AGIs $100k-200k, 5324.6% for AGIs over 200k)
Taxable individual retirement arrangement distribution: $18,946 (reported on 2.7% of returns)
10033:
$18,946
New York:
$19,609
(% of AGI for various income ranges: 11.7% for AGIs below $25k, 21.6% for AGIs $25k-50k, 51.6% for AGIs $50k-75k, 161.5% for AGIs $75k-100k, 415.2% for AGIs $100k-200k, 1659.2% for AGIs over 200k)
Self-employed (Keogh) retirement plans: $20,531 (reported on 0.6% of returns)
10033:
$20,531
New York:
$32,497
(% of AGI for various income ranges: 1.8% for AGIs below $25k, 14.3% for AGIs $50k-75k, 61.5% for AGIs $100k-200k, 864.2% for AGIs over 200k)
Total itemized deductions: $29,399 (reported on 5.0% of returns)
Here:
$29,399
State:
$39,326
(% of AGI for various income ranges: 20.5% for AGIs below $25k, 42.7% for AGIs $25k-50k, 151.6% for AGIs $50k-75k, 386.8% for AGIs $75k-100k, 1116.2% for AGIs $100k-200k, 6209.6% for AGIs over 200k)
Charity contributions: $7,485 (reported on 4.0% of returns)
Here:
$7,485
State:
$15,420
(% of AGI for various income ranges: 0.8% for AGIs below $25k, 4.1% for AGIs $25k-50k, 25.2% for AGIs $50k-75k, 57.5% for AGIs $75k-100k, 210.5% for AGIs $100k-200k, 1763.3% for AGIs over 200k)
Taxes paid: $9,046 (reported on 4.9% of returns)
10033:
$9,046
State:
$9,183
(% of AGI for various income ranges: 4.3% for AGIs below $25k, 12.7% for AGIs $25k-50k, 52.1% for AGIs $50k-75k, 153.8% for AGIs $75k-100k, 372.7% for AGIs $100k-200k, 1548.3% for AGIs over 200k)
Earned income credit: $2,061 (reported on 21.4% of returns)
Here:
$2,061
State:
$2,138
(% of AGI for various income ranges: 111.3% for AGIs below $25k, 64.1% for AGIs $25k-50k, 0.4% for AGIs $50k-75k)
Percentage of individuals using paid preparers for their 2020 taxes: 93.9%
Here:
94%
State:
95%
(% for various income ranges: 91.9% for AGIs below $25k, 95.9% for AGIs $25k-50k, 95.6% for AGIs $50k-75k, 94.0% for AGIs $75k-100k, 93.8% for AGIs $100k-200k, 96.2% for AGIs over 200k)
Averages for the 2012 tax year for zip code 10033, filed in 2013:
Average Adjusted Gross Income (AGI) in 2012: $38,106 (Individual Income Tax Returns)
Here:
$38,106
State:
$77,088
Salary/wage: $38,764 (reported on 79.6% of returns)
Here:
$38,764
State:
$60,593
(% of AGI for various income ranges: 70.4% for AGIs below $25k, 91.1% for AGIs $25k-50k, 88.7% for AGIs $50k-75k, 86.5% for AGIs $75k-100k, 82.2% for AGIs $100k-200k, 62.9% for AGIs over 200k)
Taxable interest for individuals: $841 (reported on 20.4% of returns)
This zip code:
$841
New York:
$3,125
(% of AGI for various income ranges: 0.3% for AGIs below $25k, 0.2% for AGIs $25k-50k, 0.3% for AGIs $50k-75k, 0.5% for AGIs $75k-100k, 0.6% for AGIs $100k-200k, 0.9% for AGIs over 200k)
Ordinary dividends: $4,583 (reported on 9.8% of returns)
Here:
$4,583
State:
$10,299
(% of AGI for various income ranges: 0.6% for AGIs below $25k, 0.5% for AGIs $25k-50k, 0.8% for AGIs $50k-75k, 1.1% for AGIs $75k-100k, 2.1% for AGIs $100k-200k, 2.2% for AGIs over 200k)
Net capital gain/loss in AGI: +$6,528 (reported on 8.7% of returns)
Here:
+$6,528
State:
+$42,474
(% of AGI for various income ranges: 0.1% for AGIs $50k-75k, 0.2% for AGIs $75k-100k, 0.7% for AGIs $100k-200k, 9.5% for AGIs over 200k)
Profit/loss from business: +$9,789 (reported on 24.7% of returns)
Here:
+$9,789
State:
+$16,168
(% of AGI for various income ranges: 20.7% for AGIs below $25k, 2.4% for AGIs $25k-50k, 2.2% for AGIs $50k-75k, 3.2% for AGIs $75k-100k, 4.5% for AGIs $100k-200k, 5.2% for AGIs over 200k)
Taxable individual retirement arrangement distribution: $13,146 (reported on 3.0% of returns)
10033:
$13,146
New York:
$17,621
(% of AGI for various income ranges: 0.5% for AGIs below $25k, 0.6% for AGIs $25k-50k, 0.9% for AGIs $50k-75k, 1.2% for AGIs $75k-100k, 1.8% for AGIs $100k-200k, 1.3% for AGIs over 200k)
Self-employment retirement plans: $20,700 (reported on 0.5% of returns)
10033:
$20,700
New York:
$27,330
(% of AGI for various income ranges: 0.2% for AGIs $50k-75k, 0.5% for AGIs $100k-200k, 1.0% for AGIs over 200k)
Total itemized deductions: $20,779 (22% of AGI, reported on 21.1% of returns)
Here:
$20,779
State:
$34,985
Here:
22.3% of AGI
State:
21.3% of AGI
(% of AGI for various income ranges: 3.2% for AGIs below $25k, 9.0% for AGIs $25k-50k, 11.7% for AGIs $50k-75k, 13.9% for AGIs $75k-100k, 16.8% for AGIs $100k-200k, 16.0% for AGIs over 200k)
Charity contributions: $2,926 (reported on 16.7% of returns)
Here:
$2,926
State:
$5,572
(% of AGI for various income ranges: 0.2% for AGIs below $25k, 0.9% for AGIs $25k-50k, 1.3% for AGIs $50k-75k, 1.5% for AGIs $75k-100k, 1.9% for AGIs $100k-200k, 2.2% for AGIs over 200k)
Taxes paid: $9,218 (reported on 20.9% of returns)
10033:
$9,218
State:
$18,656
(% of AGI for various income ranges: 0.5% for AGIs below $25k, 2.0% for AGIs $25k-50k, 4.3% for AGIs $50k-75k, 6.6% for AGIs $75k-100k, 8.9% for AGIs $100k-200k, 9.9% for AGIs over 200k)
Earned income credit: $2,280 (reported on 33.1% of returns)
Here:
$2,280
State:
$2,230
(% of AGI for various income ranges: 10.4% for AGIs below $25k, 1.0% for AGIs $25k-50k)
Percentage of individuals using paid preparers for their 2012 taxes: 70.3%
Here:
70%
State:
66%
(% for various income ranges: 71.7% for AGIs below $25k, 69.5% for AGIs $25k-50k, 67.5% for AGIs $50k-75k, 65.7% for AGIs $75k-100k, 67.8% for AGIs $100k-200k, 77.5% for AGIs over 200k)
Averages for the 2004 tax year for zip code 10033, filed in 2005:
Average Adjusted Gross Income (AGI) in 2004: $29,821 (Individual Income Tax Returns)
Here:
$29,821
State:
$59,519
Salary/wage: $30,274 (reported on 81.3% of returns)
Here:
$30,274
State:
$50,673
(% of AGI for various income ranges: 56.8% for AGIs below $10k, 80.9% for AGIs $10k-25k, 93.1% for AGIs $25k-50k, 88.3% for AGIs $50k-75k, 84.5% for AGIs $75k-100k, 70.8% for AGIs over 100k)
Taxable interest for individuals: $1,378 (reported on 25.2% of returns)
This zip code:
$1,378
New York:
$2,377
(% of AGI for various income ranges: 1.5% for AGIs below $10k, 0.9% for AGIs $10k-25k, 0.7% for AGIs $25k-50k, 1.1% for AGIs $50k-75k, 1.5% for AGIs $75k-100k, 1.8% for AGIs over 100k)
Taxable dividends: $3,060 (reported on 10.7% of returns)
Here:
$3,060
State:
$5,394
(% of AGI for various income ranges: 1.0% for AGIs below $10k, 0.6% for AGIs $10k-25k, 0.6% for AGIs $25k-50k, 1.3% for AGIs $50k-75k, 1.9% for AGIs $75k-100k, 1.7% for AGIs over 100k)
Net capital gain/loss: +$5,943 (reported on 8.4% of returns)
Here:
+$5,943
State:
+$23,581
(% of AGI for various income ranges: -0.2% for AGIs below $10k, -0.0% for AGIs $10k-25k, -0.0% for AGIs $25k-50k, 0.3% for AGIs $50k-75k, 0.9% for AGIs $75k-100k, 7.0% for AGIs over 100k)
Profit/loss from business: +$7,672 (reported on 25.6% of returns)
Here:
+$7,672
State:
+$13,809
(% of AGI for various income ranges: 43.9% for AGIs below $10k, 12.9% for AGIs $10k-25k, 1.7% for AGIs $25k-50k, 1.9% for AGIs $50k-75k, 2.4% for AGIs $75k-100k, 4.3% for AGIs over 100k)
IRA payment deduction: $2,826 (reported on 1.7% of returns)
10033:
$2,826
New York:
$3,115
(% of AGI for various income ranges: 0.1% for AGIs below $10k, 0.2% for AGIs $10k-25k, 0.2% for AGIs $25k-50k, 0.2% for AGIs $50k-75k, 0.2% for AGIs $75k-100k, 0.1% for AGIs over 100k)
Self-employed pension: $9,432 (reported on 0.5% of returns)
Here:
$9,432
New York:
$19,016
(% of AGI for various income ranges: 0.0% for AGIs $10k-25k, 0.1% for AGIs $25k-50k, 0.2% for AGIs $50k-75k, 0.5% for AGIs over 100k)
Total itemized deductions: $17,266 (25% of AGI, reported on 21.6% of returns)
Here:
$17,266
State:
$25,864
Here:
25.2% of AGI
State:
21.9% of AGI
(% of AGI for various income ranges: 2.3% for AGIs below $10k, 5.1% for AGIs $10k-25k, 12.3% for AGIs $25k-50k, 15.2% for AGIs $50k-75k, 16.9% for AGIs $75k-100k, 17.8% for AGIs over 100k)
Charity contributions deductions: $2,998 (4% of AGI, reported on 19.2% of returns)
Here:
$2,998
State:
$4,439
Here:
4.3% of AGI
State:
3.6% of AGI
(% of AGI for various income ranges: 0.1% for AGIs below $10k, 0.6% for AGIs $10k-25k, 1.8% for AGIs $25k-50k, 2.3% for AGIs $50k-75k, 2.4% for AGIs $75k-100k, 3.2% for AGIs over 100k)
Total tax: $4,299 (reported on 68.3% of returns)
10033:
$4,299
State:
$11,730
(% of AGI for various income ranges: 6.9% for AGIs below $10k, 4.0% for AGIs $10k-25k, 6.4% for AGIs $25k-50k, 10.6% for AGIs $50k-75k, 12.4% for AGIs $75k-100k, 18.3% for AGIs over 100k)
Earned income credit: $2,002 (reported on 39.1% of returns)
Here:
$2,002
State:
$1,757
Percentage of individuals using paid preparers for their 2004 taxes: 73.4%
Here:
73%
State:
67%
(% for various income ranges: 72.5% for AGIs below $10k, 77.7% for AGIs $10k-25k, 70.7% for AGIs $25k-50k, 68.4% for AGIs $50k-75k, 67.8% for AGIs $75k-100k, 74.5% for AGIs over 100k)
Likely homosexual households (counted as self-reported same-sex unmarried-partner households)
Lesbian couples: 0.2% of all households
Gay men: 0.4% of all households
Household received Food Stamps/SNAP in the past 12 months: 6,764 Household did not receive Food Stamps/SNAP in the past 12 months: 14,607
Women who had a birth in the past 12 months: 622 (541 now married, 75 unmarried) Women who did not have a birth in the past 12 months: 12,856 (3,784 now married, 9,115 unmarried)
Housing units in zip code 10033 with a mortgage: 1,839 (31 second mortgage, 22 both second mortgage and home equity loan) Houses without a mortgage: 115
Median monthly owner costs for units with a mortgage: $2,276 Median monthly owner costs for units without a mortgage: $668
Residents with income below the poverty level in 2022:
This zip code:
17.1%
Whole state:
14.3%
Residents with income below 50% of the poverty level in 2022:
This zip code:
8.1%
Whole state:
6.8%
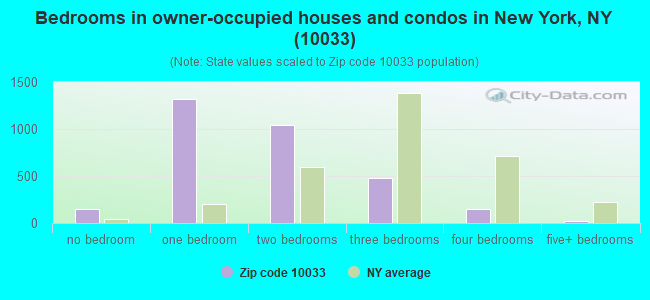
Median number of rooms in houses and condos:
Here:
3.8
State:
6.3
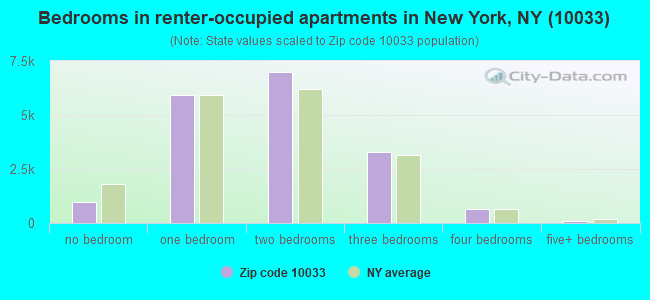
Median number of rooms in apartments:
Here:
3.8
State:
3.8
Notable locations in this zip code not listed on our city pages
Notable locations in zip code 10033: Dyckman Street Subway Station (A), George Washington Bridge Bus Station (B), J Hood Wright Recreational Center (C), New York Ladder Company 45 (D), Coliseum Cinemas (E), Thirty fourth Precinct Police Station (F), Onehundredseventyninth Street Branch New York Public Library (G), Fire Department New York Engine 93 Ladder 45 Battalion 13 (H), Mendel Gottesman Library (I). Display/hide their locations on the map
Churches in zip code 10033 include: Wadsworth Avenue Baptist Church (A), Temple of the Covenant (B), Temple Beth Sholom (C), Saint Spyidon Hellenic Orthodox Greek Church (D), Roman Catholic Church of the Incarnation (E), Roman Catholic Church of Saint Elizabeth (F), Rehillath Yaakov Synagogue (G), Holy Rood Episcopal Church (H), Holy Cross Armenian Apostolic Church (I). Display/hide their locations on the map
Parks in zip code 10033 include: J Hood Wright Park (1), McNally Plaza (2), High Bridge Park (3), Wallenberg Playground (4), Quisqueya Playground (5), West 186th Street Basketball Court (6), Bennett Park (7). Display/hide their locations on the map
4,374 married couples with children.
2,823 single-parent households (627 men, 2,196 women).
31.9% of residents of 10033 zip code speak English at home.
60.4% of residents speak Spanish at home (48% very well, 15% well, 19% not well, 18% not at all).
3.9% of residents speak other Indo-European language at home (80% very well, 11% well, 7% not well, 1% not at all).
1.7% of residents speak Asian or Pacific Island language at home (63% very well, 20% well, 6% not well, 10% not at all).
1.5% of residents speak other language at home (72% very well, 12% well, 8% not well, 9% not at all).
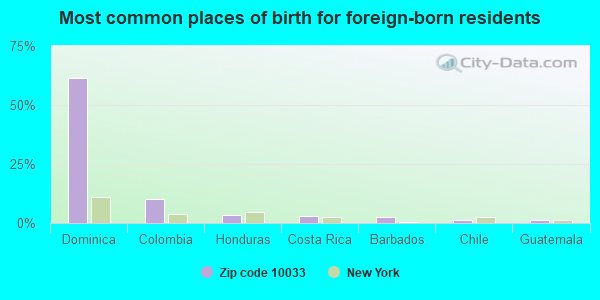
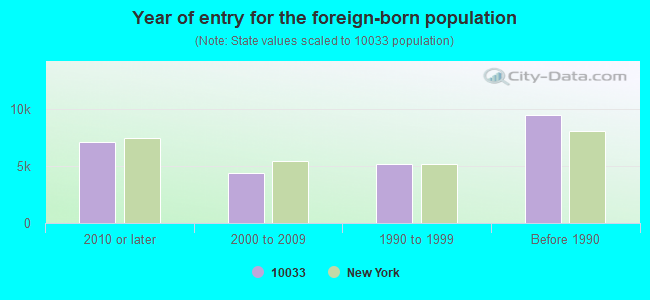
Foreign born population: 24,880 (43.1%) (62.1% of them are naturalized citizens)
Major facilities with environmental interests located in this zip code:
HEIGHTS CLEANERS (812 W 181ST ST in MANHATTAN, NY)
AIR MINOR (AIRS/AFS) STATE MASTER (New York facility tracking) - AIR PROGRAM (Resource Conservation and Recovery Act (tracking hazardous waste)) Business SIC classification: DRYCLEANING PLANTS, EXCEPT RUG CLEANING Business NAICS classification: DRYCLEANING AND LAUNDRY SERVICES (EXCEPT COIN-OPERATED). Organizations: HEIGHTS CLEANERS BY CHO INC (LEGALLY RESPONSIBLE PARTY)
, THE HEIGHTS FRENCH CLEANERS (LEGALLY RESPONSIBLE PARTY)
, HEIGHTS THAYER CLEANERS INC (LEGALLY RESPONSIBLE PARTY)
Alternative names: HEIGHTS FRENCH CLEANERS, HEIGHTS THAYER CLEANERS INCORPORATED, HEIGHTS THAYER CLEANERS, INC.
700 DRY CLEANERS (4131 BROADWAY in NEW YORK, NY)
AIR MINOR (AIRS/AFS) STATE MASTER (New York facility tracking) - AIR PROGRAM Business SIC classification: DRYCLEANING PLANTS, EXCEPT RUG CLEANING Business NAICS classification: DRYCLEANING AND LAUNDRY SERVICES (EXCEPT COIN-OPERATED).
GREGORIO LUPERON HS-MATH & SCI ( in NEW YORK, NY)
(National Center for Education Statistics) - STATE ID-317700010552 Organizations: NEW YORK CITY PUBLIC SCHOOLS (SCHOOL DISTRICT)
ICF/DD ( in NEW YORK, NY)
(National Center for Education Statistics) - STATE ID-310600890129 Organizations: NEW YORK CITY PUBLIC SCHOOLS (SCHOOL DISTRICT)
IS 143 E. ROOSEVELT JHS ( in NEW YORK, NY)
(National Center for Education Statistics) - STATE ID-310600010143 Organizations: NEW YORK CITY PUBLIC SCHOOLS (SCHOOL DISTRICT)
IS 528 BEA FULLER ROGERS SCHOOL ( in NEW YORK, NY)
(National Center for Education Statistics) - STATE ID-310600010528 Organizations: NEW YORK CITY PUBLIC SCHOOLS (SCHOOL DISTRICT)
CHURCH OF INCARNATION (1290 SAINT NICHOLAS AVE in NEW YORK, NY)
(Integrated Compliance Information System) - ICIS-02-1988-0553, FORMAL ENFORCEMENT ACTION
GEORGE WASHINGTON BRIDGE AND BUS STATION (4211 BROADWAY in NEW YORK, NY)
HAZARDOUS WASTE BIENNIAL REPORTER (Resource Conservation and Recovery Act (tracking hazardous waste)) Large Quantity Generators, more that 1000 kg of hazardous waste/month (Resource Conservation and Recovery Act (tracking hazardous waste)) - notification Alternative names: PORT AUTHORITY OF NY & NJ, PORT AUTH OF NY & NJ - G WASHINGTON BRG
CON ED - V 6240 (W 181 ST S 28 E HAVEN AVE in NEW YORK, NY)
HAZARDOUS WASTE BIENNIAL REPORTER (Resource Conservation and Recovery Act (tracking hazardous waste)) (Resource Conservation and Recovery Act (tracking hazardous waste))
140 E 83RD ST BUILDING (140 E 83RD ST in NEW YORK, NY)
AIR MINOR (AIRS/AFS) Business SIC classification: OPERATORS OF APARTMENT BUILDINGS
875 W 181ST ST BUILDING (875 W 181ST STREET in NEW YORK, NY)
AIR MINOR (AIRS/AFS) Business SIC classification: OPERATORS OF APARTMENT BUILDINGS
GLOBE FRENCH CLEANERS (720 W 181ST ST in NEW YORK, NY)
(Resource Conservation and Recovery Act (tracking hazardous waste))
INTERMEDIATE SCHOOL 143 (511 W 182ND ST in NEW YORK, NY)
(Resource Conservation and Recovery Act (tracking hazardous waste)) Alternative names: SITE ID 360610115
Housing units lacking complete plumbing facilities: 1.1% Housing units lacking complete kitchen facilities: 2.6%
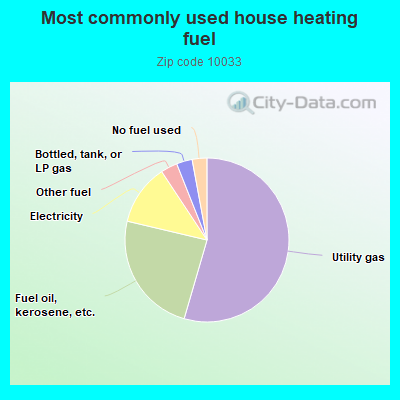
54.5%Utility gas
24.2%Fuel oil, kerosene, etc.
12.0%Electricity
3.3%Other fuel
3.1%Bottled, tank, or LP gas
2.9%No fuel used
Population in 1990: 58,648.
Place of birth for U.S.-born residents:
This state: 23,934
Northeast: 2,504
Midwest: 1,746
South: 1,891
West: 1,622
72% of the 10033 zip code residents lived in the same house 5 years ago. Out of people who lived in different houses, 62% lived in this county. Out of people who lived in different counties, 50% lived in New York.
89% of the 10033 zip code residents lived in the same house 1 year ago. Out of people who lived in different houses, 57% moved from this county. Out of people who lived in different houses, 16% moved from different county within same state. Out of people who lived in different houses, 20% moved from different state. Out of people who lived in different houses, 8% moved from abroad.
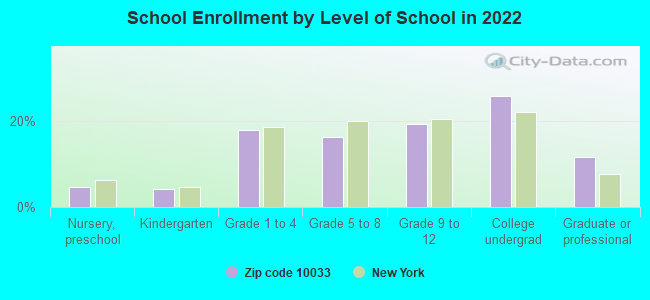
Private vs. public school enrollment:
Students in private schools in grades 1 to 8 (elementary and middle school): 994
Here:
24.0%
New York:
15.6%
Students in private schools in grades 9 to 12 (high school): 436
Here:
18.6%
New York:
15.0%
Students in private undergraduate colleges: 1,260
Here:
40.6%
New York:
39.2%
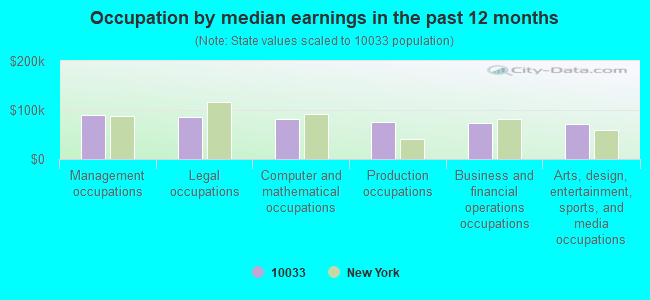
Occupation by median earnings in the past 12 months ($)
89,303Management occupations
85,476Legal occupations
82,507Computer and mathematical occupations
75,343Production occupations
74,301Business and financial operations occupations
70,847Arts, design, entertainment, sports, and media occupations
Top industries in this zip code by the number of employees in 2005:
Educational Services: Colleges, Universities, and Professional Schools (over 1000 employees: 1 establishment, 50-99 employees: 1 establishment)
Health Care and Social Assistance: Other Individual and Family Services (100-249: 1, 50-99: 2, 20-49: 5, 10-19: 1, 5-9: 1, 1-4: 1)
2007 - 2018 National Fire Incident Reporting System (NFIRS) incidents
According to the data from the years 2007 - 2018 the average number of fire incidents per year is 184. The highest number of reported fires - 226 took place in 2010, and the least - 136 in 2007. The data has a growing trend.
When looking into fire subcategories, the most reports belonged to: Structure Fires (70.9%), and Outside Fires (17.4%).
Fire incident types reported to NFIRS in Zip Code 10033


 Nearest zip codes: 10040, 10032, 10452, 10034, 10039, 10453.
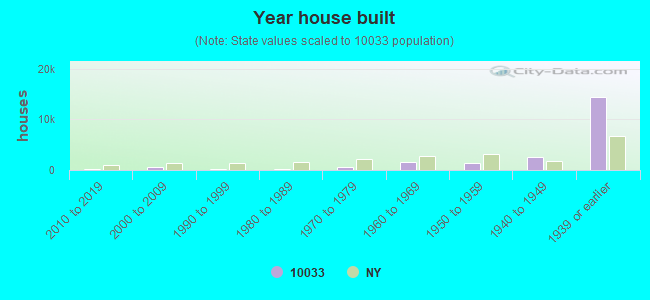


 According to the data from the years 2007 - 2018 the average number of fire incidents per year is 184. The highest number of reported fires - 226 took place in 2010, and the least - 136 in 2007. The data has a growing trend.
 When looking into fire subcategories, the most reports belonged to: Structure Fires (70.9%), and Outside Fires (17.4%).