Estimated zip code population in 2022: 40,910 Zip code population in 2010: 38,908 Zip code population in 2000: 41,756
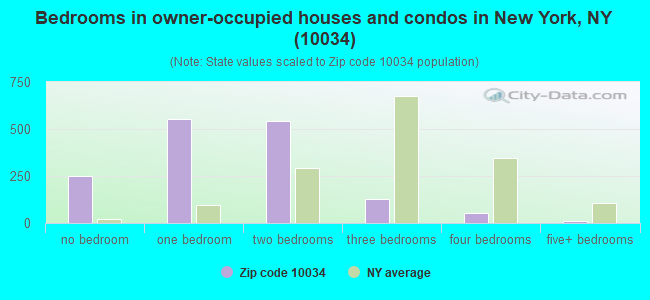
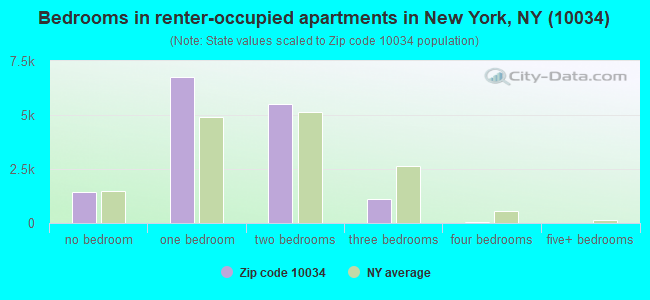
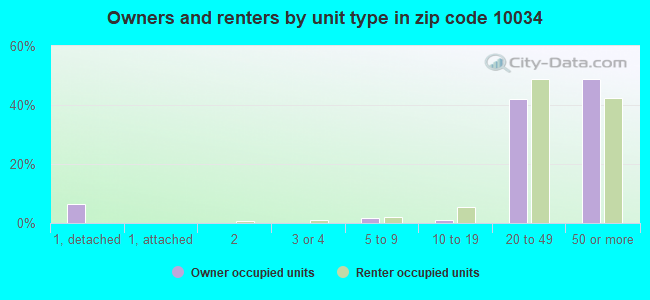
Houses and condos: 17,094 Renter-occupied apartments: 14,818
% of renters here:
91%
State:
46%
March 2022 cost of living index in zip code 10034: 148.8 (very high, U.S. average is 100)
Land area: 1.1 sq. mi. Water area: 0.0 sq. mi.
Population density: 36,321 people per square mile
(very high).
OSM Map
General Map
Google Map
MSN Map
OSM Map
General Map
Google Map
MSN Map
OSM Map
General Map
Google Map
MSN Map
OSM Map
General Map
Google Map
MSN Map
Please wait while loading the map...
Real estate property taxes paid for housing units in 2022:
This zip code:
0.7% ($3,832)
New York:
1.5% ($6,180)
Median real estate property taxes paid for housing units with mortgages in 2022: $4,091 (0.7%) Median real estate property taxes paid for housing units with no mortgage in 2022: $3,610 (0.8%)
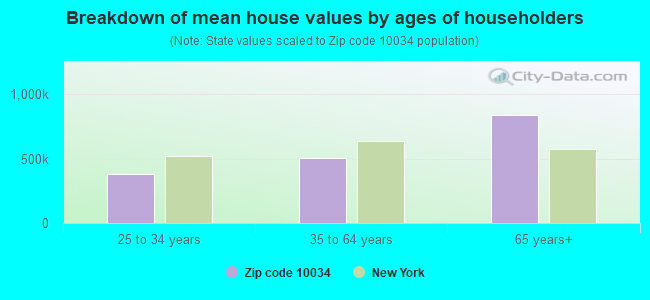
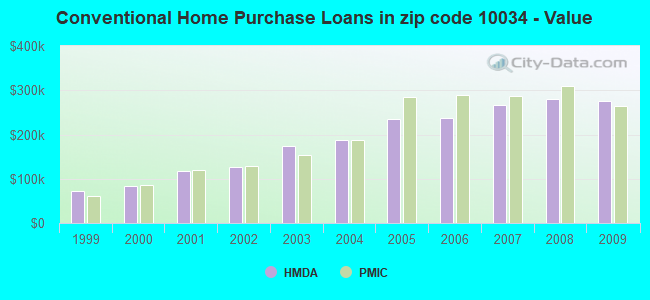
Estimated median house/condo value in 2022: $512,045
10034:
$512,045
New York:
$400,400
According to our research of New York and other state lists, there were 11 registered sex offenders living in 10034 zip code as of April 26, 2024. The ratio of all residents to sex offenders in zip code 10034 is 4,053 to 1. The ratio of registered sex offenders to all residents in this zip code is much lower than the state average.
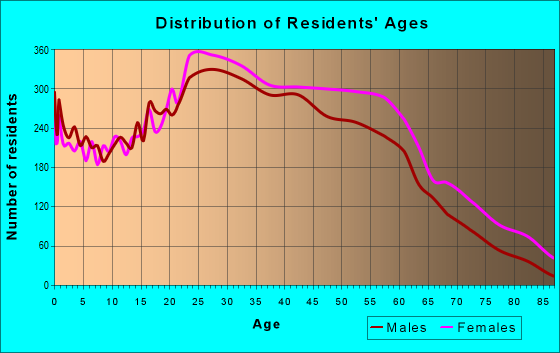
Median resident age:
This zip code:
38.3 years
New York median age:
40.0 years
Average household size:
This zip code:
2.5 people
New York:
2.5 people
Averages for the 2020 tax year for zip code 10034, filed in 2021:
Average Adjusted Gross Income (AGI) in 2020: $47,946 (Individual Income Tax Returns)
Here:
$47,946
State:
$90,930
Salary/wage: $47,231 (reported on 76.0% of returns)
Here:
$47,231
State:
$72,104
(% of AGI for various income ranges: 801.1% for AGIs below $25k, 3162.3% for AGIs $25k-50k, 6553.7% for AGIs $50k-75k, 10138.6% for AGIs $75k-100k, 18899.2% for AGIs $100k-200k, 86800.7% for AGIs over 200k)
Taxable interest for individuals: $679 (reported on 18.1% of returns)
This zip code:
$679
New York:
$3,075
(% of AGI for various income ranges: 5.0% for AGIs below $25k, 6.2% for AGIs $25k-50k, 12.6% for AGIs $50k-75k, 37.6% for AGIs $75k-100k, 91.0% for AGIs $100k-200k, 327.1% for AGIs over 200k)
Ordinary dividends: $4,083 (reported on 9.4% of returns)
Here:
$4,083
State:
$11,095
(% of AGI for various income ranges: 7.4% for AGIs below $25k, 14.1% for AGIs $25k-50k, 40.1% for AGIs $50k-75k, 87.1% for AGIs $75k-100k, 257.2% for AGIs $100k-200k, 1963.6% for AGIs over 200k)
Net capital gain/loss in AGI: +$6,668 (reported on 9.2% of returns)
Here:
+$6,668
State:
+$44,925
(% of AGI for various income ranges: 3.1% for AGIs below $25k, 10.5% for AGIs $25k-50k, 28.8% for AGIs $50k-75k, 78.7% for AGIs $75k-100k, 341.9% for AGIs $100k-200k, 5365.7% for AGIs over 200k)
Profit/loss from business: +$7,997 (reported on 20.9% of returns)
Here:
+$7,997
State:
+$14,940
(% of AGI for various income ranges: 206.3% for AGIs below $25k, 114.4% for AGIs $25k-50k, 204.6% for AGIs $50k-75k, 257.9% for AGIs $75k-100k, 605.9% for AGIs $100k-200k, 3207.1% for AGIs over 200k)
Taxable individual retirement arrangement distribution: $13,713 (reported on 2.5% of returns)
10034:
$13,713
New York:
$19,609
(% of AGI for various income ranges: 10.8% for AGIs below $25k, 21.5% for AGIs $25k-50k, 50.4% for AGIs $50k-75k, 96.1% for AGIs $75k-100k, 211.4% for AGIs $100k-200k, 1035.7% for AGIs over 200k)
Self-employed (Keogh) retirement plans: $13,850 (reported on 0.5% of returns)
10034:
$13,850
New York:
$32,497
(% of AGI for various income ranges: 20.2% for AGIs $50k-75k, 39.0% for AGIs $100k-200k, 417.1% for AGIs over 200k)
Total itemized deductions: $28,464 (reported on 4.3% of returns)
Here:
$28,464
State:
$39,326
(% of AGI for various income ranges: 11.4% for AGIs below $25k, 31.1% for AGIs $25k-50k, 155.0% for AGIs $50k-75k, 339.9% for AGIs $75k-100k, 831.8% for AGIs $100k-200k, 6015.0% for AGIs over 200k)
Charity contributions: $7,138 (reported on 3.5% of returns)
Here:
$7,138
State:
$15,420
(% of AGI for various income ranges: 0.9% for AGIs below $25k, 4.0% for AGIs $25k-50k, 22.6% for AGIs $50k-75k, 53.5% for AGIs $75k-100k, 139.3% for AGIs $100k-200k, 1842.1% for AGIs over 200k)
Taxes paid: $8,491 (reported on 4.3% of returns)
10034:
$8,491
State:
$9,183
(% of AGI for various income ranges: 1.8% for AGIs below $25k, 7.5% for AGIs $25k-50k, 48.3% for AGIs $50k-75k, 125.9% for AGIs $75k-100k, 341.6% for AGIs $100k-200k, 1108.6% for AGIs over 200k)
Earned income credit: $2,105 (reported on 23.1% of returns)
Here:
$2,105
State:
$2,138
(% of AGI for various income ranges: 114.3% for AGIs below $25k, 73.5% for AGIs $25k-50k)
Percentage of individuals using paid preparers for their 2020 taxes: 94.7%
Here:
95%
State:
95%
(% for various income ranges: 93.3% for AGIs below $25k, 96.2% for AGIs $25k-50k, 95.8% for AGIs $50k-75k, 95.2% for AGIs $75k-100k, 94.2% for AGIs $100k-200k, 95.1% for AGIs over 200k)
Averages for the 2012 tax year for zip code 10034, filed in 2013:
Average Adjusted Gross Income (AGI) in 2012: $36,610 (Individual Income Tax Returns)
Here:
$36,610
State:
$77,088
Salary/wage: $38,518 (reported on 80.6% of returns)
Here:
$38,518
State:
$60,593
(% of AGI for various income ranges: 69.4% for AGIs below $25k, 90.8% for AGIs $25k-50k, 90.1% for AGIs $50k-75k, 88.9% for AGIs $75k-100k, 87.5% for AGIs $100k-200k, 73.0% for AGIs over 200k)
Taxable interest for individuals: $621 (reported on 18.5% of returns)
This zip code:
$621
New York:
$3,125
(% of AGI for various income ranges: 0.3% for AGIs below $25k, 0.2% for AGIs $25k-50k, 0.4% for AGIs $50k-75k, 0.3% for AGIs $75k-100k, 0.4% for AGIs $100k-200k, 0.3% for AGIs over 200k)
Ordinary dividends: $3,014 (reported on 8.0% of returns)
Here:
$3,014
State:
$10,299
(% of AGI for various income ranges: 0.4% for AGIs below $25k, 0.4% for AGIs $25k-50k, 0.5% for AGIs $50k-75k, 0.7% for AGIs $75k-100k, 1.1% for AGIs $100k-200k, 1.5% for AGIs over 200k)
Net capital gain/loss in AGI: +$5,134 (reported on 6.6% of returns)
Here:
+$5,134
State:
+$42,474
(% of AGI for various income ranges: 0.5% for AGIs $75k-100k, 0.2% for AGIs $100k-200k, 11.4% for AGIs over 200k)
Profit/loss from business: +$8,541 (reported on 23.2% of returns)
Here:
+$8,541
State:
+$16,168
(% of AGI for various income ranges: 20.5% for AGIs below $25k, 2.6% for AGIs $25k-50k, 1.9% for AGIs $50k-75k, 1.7% for AGIs $75k-100k, 2.5% for AGIs $100k-200k, 3.1% for AGIs over 200k)
Taxable individual retirement arrangement distribution: $11,258 (reported on 2.9% of returns)
10034:
$11,258
New York:
$17,621
(% of AGI for various income ranges: 0.6% for AGIs below $25k, 0.7% for AGIs $25k-50k, 0.8% for AGIs $50k-75k, 1.1% for AGIs $75k-100k, 1.7% for AGIs $100k-200k)
Self-employment retirement plans: $13,483 (reported on 0.3% of returns)
10034:
$13,483
New York:
$27,330
Total itemized deductions: $18,183 (22% of AGI, reported on 21.6% of returns)
Here:
$18,183
State:
$34,985
Here:
22.2% of AGI
State:
21.3% of AGI
(% of AGI for various income ranges: 3.3% for AGIs below $25k, 8.5% for AGIs $25k-50k, 11.6% for AGIs $50k-75k, 13.9% for AGIs $75k-100k, 15.7% for AGIs $100k-200k, 14.8% for AGIs over 200k)
Charity contributions: $2,252 (reported on 16.4% of returns)
Here:
$2,252
State:
$5,572
(% of AGI for various income ranges: 0.2% for AGIs below $25k, 0.8% for AGIs $25k-50k, 1.3% for AGIs $50k-75k, 1.4% for AGIs $75k-100k, 1.3% for AGIs $100k-200k, 1.0% for AGIs over 200k)
Taxes paid: $8,142 (reported on 21.5% of returns)
10034:
$8,142
State:
$18,656
(% of AGI for various income ranges: 0.6% for AGIs below $25k, 2.0% for AGIs $25k-50k, 4.5% for AGIs $50k-75k, 6.9% for AGIs $75k-100k, 8.9% for AGIs $100k-200k, 10.1% for AGIs over 200k)
Earned income credit: $2,322 (reported on 33.8% of returns)
Here:
$2,322
State:
$2,230
(% of AGI for various income ranges: 11.1% for AGIs below $25k, 1.0% for AGIs $25k-50k)
Percentage of individuals using paid preparers for their 2012 taxes: 73.0%
Here:
73%
State:
66%
(% for various income ranges: 77.2% for AGIs below $25k, 71.5% for AGIs $25k-50k, 65.4% for AGIs $50k-75k, 64.6% for AGIs $75k-100k, 65.7% for AGIs $100k-200k, 70.6% for AGIs over 200k)
Averages for the 2004 tax year for zip code 10034, filed in 2005:
Average Adjusted Gross Income (AGI) in 2004: $28,357 (Individual Income Tax Returns)
Here:
$28,357
State:
$59,519
Salary/wage: $29,823 (reported on 82.0% of returns)
Here:
$29,823
State:
$50,673
(% of AGI for various income ranges: 56.1% for AGIs below $10k, 79.6% for AGIs $10k-25k, 93.2% for AGIs $25k-50k, 90.9% for AGIs $50k-75k, 88.2% for AGIs $75k-100k, 82.3% for AGIs over 100k)
Taxable interest for individuals: $836 (reported on 23.7% of returns)
This zip code:
$836
New York:
$2,377
(% of AGI for various income ranges: 1.2% for AGIs below $10k, 0.6% for AGIs $10k-25k, 0.5% for AGIs $25k-50k, 0.7% for AGIs $50k-75k, 0.9% for AGIs $75k-100k, 1.0% for AGIs over 100k)
Taxable dividends: $1,918 (reported on 9.1% of returns)
Here:
$1,918
State:
$5,394
(% of AGI for various income ranges: 0.8% for AGIs below $10k, 0.4% for AGIs $10k-25k, 0.4% for AGIs $25k-50k, 0.5% for AGIs $50k-75k, 0.9% for AGIs $75k-100k, 1.4% for AGIs over 100k)
Net capital gain/loss: +$2,105 (reported on 6.7% of returns)
Here:
+$2,105
State:
+$23,581
(% of AGI for various income ranges: -0.6% for AGIs below $10k, -0.1% for AGIs $10k-25k, 0.0% for AGIs $25k-50k, 0.3% for AGIs $50k-75k, 0.6% for AGIs $75k-100k, 3.1% for AGIs over 100k)
Profit/loss from business: +$7,341 (reported on 24.7% of returns)
Here:
+$7,341
State:
+$13,809
(% of AGI for various income ranges: 44.9% for AGIs below $10k, 13.8% for AGIs $10k-25k, 1.4% for AGIs $25k-50k, 1.5% for AGIs $50k-75k, 2.1% for AGIs $75k-100k, 3.4% for AGIs over 100k)
IRA payment deduction: $2,503 (reported on 1.7% of returns)
10034:
$2,503
New York:
$3,115
(% of AGI for various income ranges: 0.0% for AGIs below $10k, 0.1% for AGIs $10k-25k, 0.2% for AGIs $25k-50k, 0.1% for AGIs $50k-75k, 0.1% for AGIs $75k-100k, 0.2% for AGIs over 100k)
Self-employed pension: $8,156 (reported on 0.3% of returns)
Here:
$8,156
New York:
$19,016
Total itemized deductions: $15,286 (26% of AGI, reported on 21.8% of returns)
Here:
$15,286
State:
$25,864
Here:
25.9% of AGI
State:
21.9% of AGI
(% of AGI for various income ranges: 1.3% for AGIs below $10k, 4.6% for AGIs $10k-25k, 11.9% for AGIs $25k-50k, 15.4% for AGIs $50k-75k, 15.9% for AGIs $75k-100k, 17.3% for AGIs over 100k)
Charity contributions deductions: $2,320 (4% of AGI, reported on 19.4% of returns)
Here:
$2,320
State:
$4,439
Here:
3.9% of AGI
State:
3.6% of AGI
(% of AGI for various income ranges: 0.1% for AGIs below $10k, 0.6% for AGIs $10k-25k, 1.7% for AGIs $25k-50k, 2.3% for AGIs $50k-75k, 2.1% for AGIs $75k-100k, 1.9% for AGIs over 100k)
Total tax: $3,687 (reported on 68.9% of returns)
10034:
$3,687
State:
$11,730
(% of AGI for various income ranges: 6.9% for AGIs below $10k, 4.1% for AGIs $10k-25k, 6.5% for AGIs $25k-50k, 10.9% for AGIs $50k-75k, 13.0% for AGIs $75k-100k, 16.8% for AGIs over 100k)
Earned income credit: $2,064 (reported on 39.2% of returns)
Here:
$2,064
State:
$1,757
Percentage of individuals using paid preparers for their 2004 taxes: 74.6%
Here:
75%
State:
67%
(% for various income ranges: 76.6% for AGIs below $10k, 79.0% for AGIs $10k-25k, 71.5% for AGIs $25k-50k, 65.0% for AGIs $50k-75k, 65.9% for AGIs $75k-100k, 72.9% for AGIs over 100k)
Likely homosexual households (counted as self-reported same-sex unmarried-partner households)
Lesbian couples: 0.1% of all households
Gay men: 0.3% of all households
Household received Food Stamps/SNAP in the past 12 months: 5,856 Household did not receive Food Stamps/SNAP in the past 12 months: 10,754
Women who had a birth in the past 12 months: 412 (370 now married, 37 unmarried) Women who did not have a birth in the past 12 months: 10,053 (2,902 now married, 7,187 unmarried)
Housing units in zip code 10034 with a mortgage: 858 (70 second mortgage, 70 both second mortgage and home equity loan) Houses without a mortgage: 15
Median monthly owner costs for units with a mortgage: $2,135 Median monthly owner costs for units without a mortgage: $737
Residents with income below the poverty level in 2022:
This zip code:
15.6%
Whole state:
14.3%
Residents with income below 50% of the poverty level in 2022:
This zip code:
9.2%
Whole state:
6.8%
Median number of rooms in houses and condos:
Here:
3.7
State:
6.3
Median number of rooms in apartments:
Here:
3.5
State:
3.8
Notable locations in this zip code not listed on our city pages
Notable locations in zip code 10034: Scott Square (A), Weowna Yacht Club (B), Lawrence A Wein Stadium (C), P C Rapid Transit Yard (D), Kingsbridge Bus Depot (E), Jeffreys Hook Light (F), New York Ladder Company 36 (G), New York Foam Company 88 (H), Fire Department New York Engine 95 Ladder 36 Foam Unit 88 (I), Little Red Lighthouse (J), Dyckman House (K), Columbia Boat House (L), Chrystie Field House (M). Display/hide their locations on the map
Churches in zip code 10034 include: The Cloisters (A), Saint Matthew's Evangelical Lutheran Church (B), Mount Washington Presbyterian Church (C), Holy Trinity Church Chapel of the Redeemer (D), Church of the Good Shepherd (E), Iglesia Adventista Del Septimo Dia (F). Display/hide their locations on the map
Parks in zip code 10034 include: Inwood Plaza (1), Isham Park (2), Inwood Hill Park (3), Fort Washington Park (4), Fort Tryon Park (5), Lieutenant William Tighe Triangle (6), Anne Loftus Playground (7), Monsignor Kett Playground (8), Sherman Creek Park (9). Display/hide their locations on the map
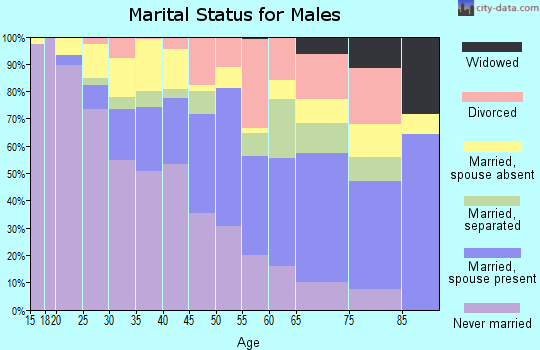
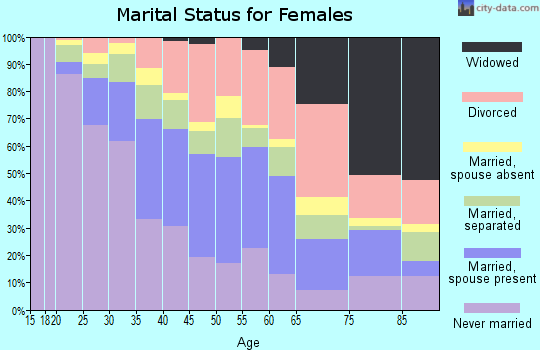
3,641 married couples with children.
2,744 single-parent households (254 men, 2,490 women).
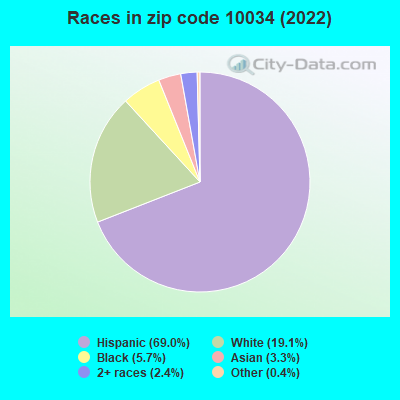
31.4% of residents of 10034 zip code speak English at home.
61.1% of residents speak Spanish at home (49% very well, 18% well, 17% not well, 16% not at all).
4.6% of residents speak other Indo-European language at home (71% very well, 20% well, 6% not well, 3% not at all).
1.5% of residents speak Asian or Pacific Island language at home (71% very well, 16% well, 13% not well).
0.8% of residents speak other language at home (85% very well, 15% well).
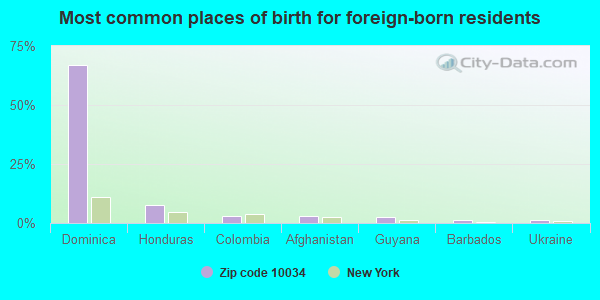
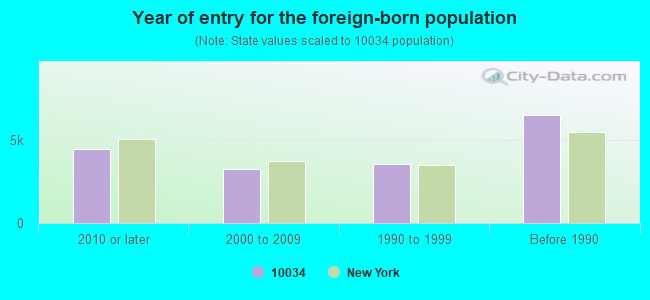
Foreign born population: 16,153 (39.5%) (59.4% of them are naturalized citizens)
Major facilities with environmental interests located in this zip code:
CON EDISON - SHERMAN CREEK PROPERTY (320 WEST 201ST STREET in NEW YORK, NY)
AIR SYNTHETIC MINOR (AIRS/AFS) STATE MASTER (New York facility tracking) - AIR PROGRAM HAZARDOUS WASTE BIENNIAL REPORTER (Resource Conservation and Recovery Act (tracking hazardous waste)) Large Quantity Generators, more that 1000 kg of hazardous waste/month (Resource Conservation and Recovery Act (tracking hazardous waste)) Conditionally Exempt Small Quantity Generators, less than 100 kg/month of hazardous waste (Resource Conservation and Recovery Act (tracking hazardous waste)) - notification Large Quantity Generators, more that 1000 kg of hazardous waste/month (Resource Conservation and Recovery Act (tracking hazardous waste)) Business SIC classification: ELECTRIC SERVICES Business NAICS classification: ELECTRIC POWER DISTRIBUTION. Organizations: CONSOLIDATED EDISON COMPANY OF NY, INC. (CONTACT/OPERATOR)
, CONSOLITED EDISON CO ON NY (CONTACT/OWNER)
, JANET R FOX (FACILITY APPLICATION CONTACT)
, CONSOLIDATED EDISON COMPANY OF NEW YORK INC (LEGALLY RESPONSIBLE PARTY)
Alternative names: CON ED - EAST 40TH STREET SUBSTATION, CON ED SHERMAN CREEK, CON ED - SHERMAN CREEK SUBSTATION, CON EDISON - SHERMAN CREEK STATION
CON ED MH F (WEST 201 STREET AND ACADEMY STREET in NEW YORK, NY)
HAZARDOUS WASTE BIENNIAL REPORTER (Resource Conservation and Recovery Act (tracking hazardous waste)) (Resource Conservation and Recovery Act (tracking hazardous waste)) Alternative names: CON ED-MH C, CON ED - MH D1, CON ED - MH E
ALVIN S CRYSTAL CLEANER (4929 BROADWAY in NEW YORK, NY)
AIR MINOR (AIRS/AFS) STATE MASTER (New York facility tracking) - AIR PROGRAM Business SIC classification: DRYCLEANING PLANTS, EXCEPT RUG CLEANING Business NAICS classification: DRYCLEANING AND LAUNDRY SERVICES (EXCEPT COIN-OPERATED). Organizations: ALVIN S CRYSTAL CLEANER INC, ALVIN S FRENCH CLEANERS INC (AIR PERMITTING FACILITY OWNER CONTACT)
, CLEANERS 2000 INC (LEGALLY RESPONSIBLE PARTY)
Alternative names: CLEANERS 2000
AMOCO-505320999005 (3936 TENTH AVENUE in NEW YORK, NY)
AIR MINOR (AIRS/AFS) STATE MASTER (New York facility tracking) - AIR PROGRAM, Business SIC classification: GASOLINE SERVICE STATIONS Organizations: AMOCO OIL CO (LEGALLY RESPONSIBLE PARTY)
IS 52 INWOOD JHS ( in NEW YORK, NY)
(National Center for Education Statistics) - STATE ID-310600010052 Organizations: NEW YORK CITY PUBLIC SCHOOLS (SCHOOL DISTRICT)
CON EDISON - MH 46213 (260 SHERMAN STREET in NEW YORK, NY)
Large Quantity Generators, more that 1000 kg of hazardous waste/month (Resource Conservation and Recovery Act (tracking hazardous waste)) Organizations: CONSOLIDATED EDISON COMPANY OF NY, INC. (CONTACT/OPERATOR)
CON EDISON - MH 60217 (BROADWAY & HILLSIDE AVE. in NEW YORK, NY)
Large Quantity Generators, more that 1000 kg of hazardous waste/month (Resource Conservation and Recovery Act (tracking hazardous waste)) Organizations: CONSOLIDATED EDISON COMPANY OF NY, INC. (CONTACT/OPERATOR)
CON ED - MH 419 (9TH AVE N/O W 219 ST in MANHATTAN, NY)
HAZARDOUS WASTE BIENNIAL REPORTER (Resource Conservation and Recovery Act (tracking hazardous waste)) (Resource Conservation and Recovery Act (tracking hazardous waste))
CON ED - MH 46154 (SEC SHERMAN AVE & THAYER ST in NEW YORK, NY)
HAZARDOUS WASTE BIENNIAL REPORTER (Resource Conservation and Recovery Act (tracking hazardous waste)) (Resource Conservation and Recovery Act (tracking hazardous waste))
CON ED - MH 56067 (S/S W 201 ST 31' W/O 9TH AVE in MANHATTAN, NY)
HAZARDOUS WASTE BIENNIAL REPORTER (Resource Conservation and Recovery Act (tracking hazardous waste)) (Resource Conservation and Recovery Act (tracking hazardous waste))
4861 BROADWAY BUILDING (4861 BROADWAY in NEW YORK, NY)
AIR MINOR (AIRS/AFS)
AMTRAK (DYKMAN ST VIADUCT in NEW YORK, NY)
(Resource Conservation and Recovery Act (tracking hazardous waste))
GETTY PETROLEUM CORP (4880 BROADWAY & 204TH ST in NEW YORK, NY)
(Resource Conservation and Recovery Act (tracking hazardous waste))
Housing units lacking complete plumbing facilities: 0.4% Housing units lacking complete kitchen facilities: 1.4%
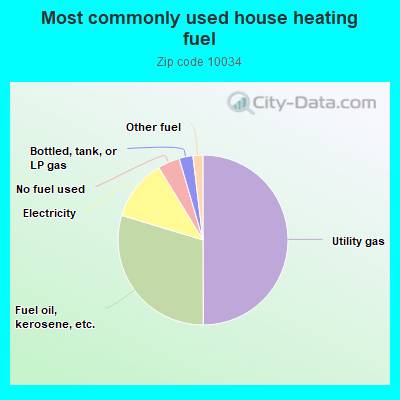
49.9%Utility gas
29.7%Fuel oil, kerosene, etc.
11.6%Electricity
4.2%No fuel used
2.6%Bottled, tank, or LP gas
1.9%Other fuel
Population in 1990: 41,131. Population change in the 1990s: +625 (+1.5%).
Place of birth for U.S.-born residents:
This state: 17,818
Northeast: 1,497
Midwest: 1,180
South: 1,748
West: 882
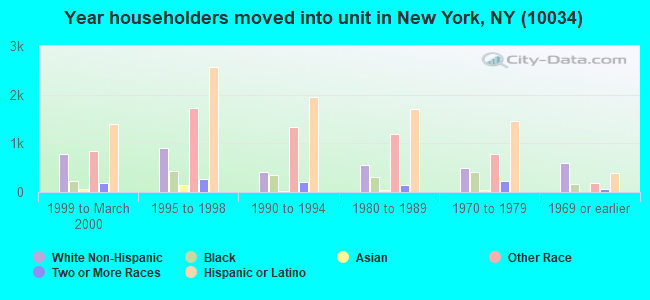
67% of the 10034 zip code residents lived in the same house 5 years ago. Out of people who lived in different houses, 62% lived in this county. Out of people who lived in different counties, 50% lived in New York.
91% of the 10034 zip code residents lived in the same house 1 year ago. Out of people who lived in different houses, 54% moved from this county. Out of people who lived in different houses, 27% moved from different county within same state. Out of people who lived in different houses, 10% moved from different state. Out of people who lived in different houses, 9% moved from abroad.
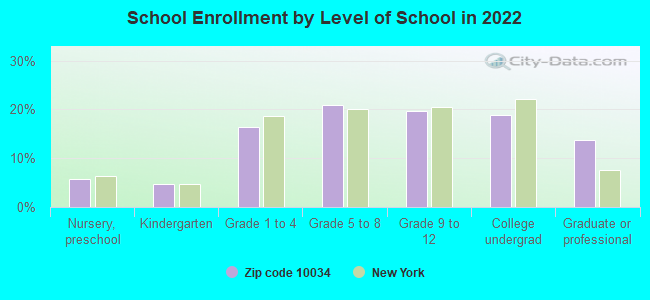
Private vs. public school enrollment:
Students in private schools in grades 1 to 8 (elementary and middle school): 538
Here:
16.6%
New York:
15.6%
Students in private schools in grades 9 to 12 (high school): 258
Here:
15.0%
New York:
15.0%
Students in private undergraduate colleges: 656
Here:
39.8%
New York:
39.2%
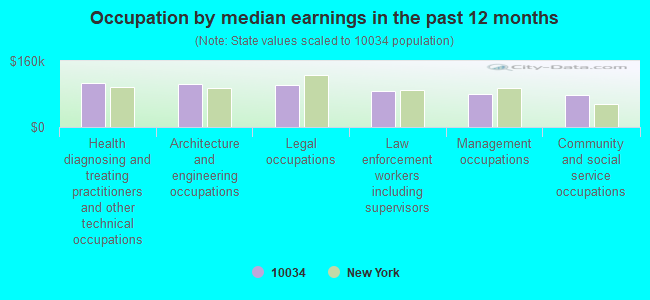
Occupation by median earnings in the past 12 months ($)
107,783Health diagnosing and treating practitioners and other technical occupations
104,382Architecture and engineering occupations
102,021Legal occupations
86,900Law enforcement workers including supervisors
79,499Management occupations
78,161Community and social service occupations
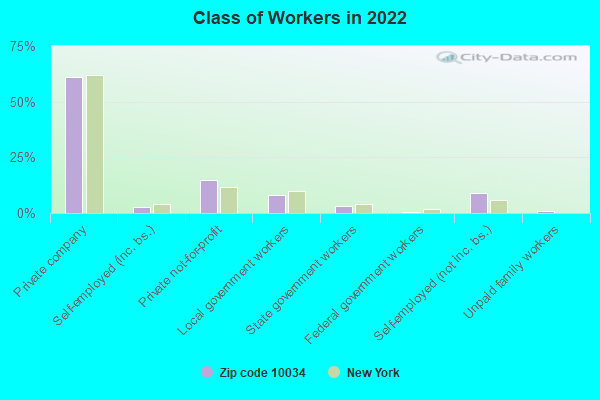
Companies with federal contracts located in this zip code:
ROBOTIC SURGICAL TECH, INC (5141 BROADWAY in NEW YORK, NY; small business) : $329,750 in 4 contractsfrom 2003 to 2006
$180,000 with Army for Services -- Advanced Development (R&D). Taking place in MD. Signed on 2004-12-21. Completion date: 2007-01-31.
$81,700 with Army for Biomedical -- Advanced Development (R&D). Signed on 2003-07-16. Completion date: 2004-01-24.
$68,050 with Army for Services -- Advanced Development (R&D). Taking place in MD. Signed on 2006-02-09. Completion date: 2007-01-31.
$0, same as above.Signed on 2006-02-09. Completion date: 2007-01-31.
Top industries in this zip code by the number of employees in 2005:
2003 - 2018 National Fire Incident Reporting System (NFIRS) incidents
Based on the data from the years 2003 - 2018 the average number of fires per year is 120. The highest number of fires - 187 took place in 2009, and the least - 0 in 2004. The data has a growing trend.
When looking into fire subcategories, the most reports belonged to: Structure Fires (69.5%), and Outside Fires (22.2%).
Fire incident types reported to NFIRS in Zip Code 10034
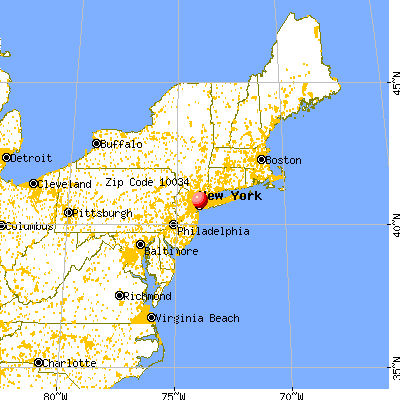


 Nearest zip codes: 10040, 10453, 10033, 10463, 10468, 07632.
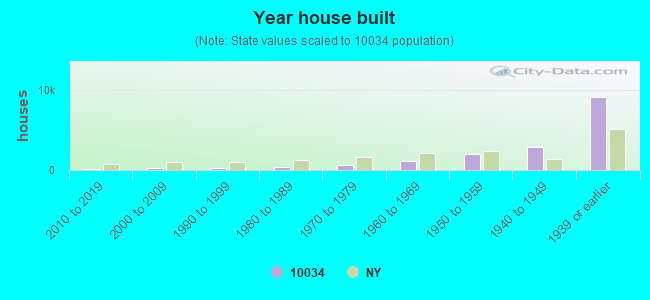


 Based on the data from the years 2003 - 2018 the average number of fires per year is 120. The highest number of fires - 187 took place in 2009, and the least - 0 in 2004. The data has a growing trend.
 When looking into fire subcategories, the most reports belonged to: Structure Fires (69.5%), and Outside Fires (22.2%).