Estimated zip code population in 2022: 58,902 Zip code population in 2010: 57,311 Zip code population in 2000: 53,707
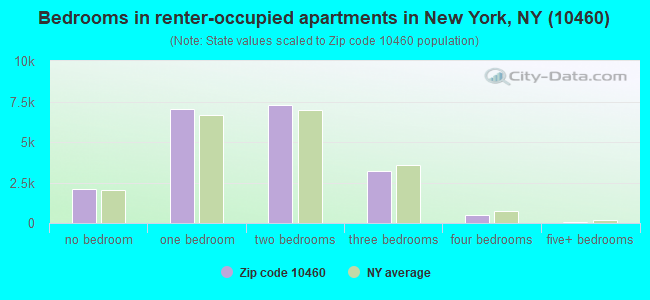
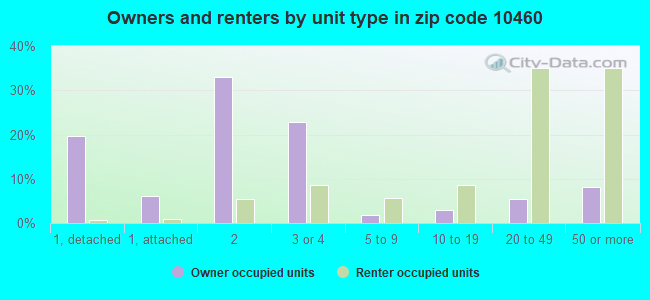
Houses and condos: 23,390 Renter-occupied apartments: 20,125
% of renters here:
90%
State:
46%
March 2022 cost of living index in zip code 10460: 163.9 (very high, U.S. average is 100)
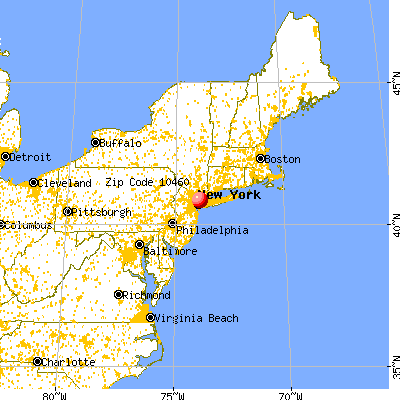
Land area: 1.3 sq. mi. Water area: 0.0 sq. mi.
Population density: 44,776 people per square mile
(very high).
OSM Map
General Map
Google Map
MSN Map
OSM Map
General Map
Google Map
MSN Map
OSM Map
General Map
Google Map
MSN Map
OSM Map
General Map
Google Map
MSN Map
Please wait while loading the map...
Real estate property taxes paid for housing units in 2022:
This zip code:
0.8% ($4,717)
New York:
1.5% ($6,180)
Median real estate property taxes paid for housing units with mortgages in 2022: $4,901 (0.8%) Median real estate property taxes paid for housing units with no mortgage in 2022: $4,566 (0.8%)
Business Search- 14 Million verified businesses
Males: 27,630
(46.9%)
Females: 31,271
(53.1%)
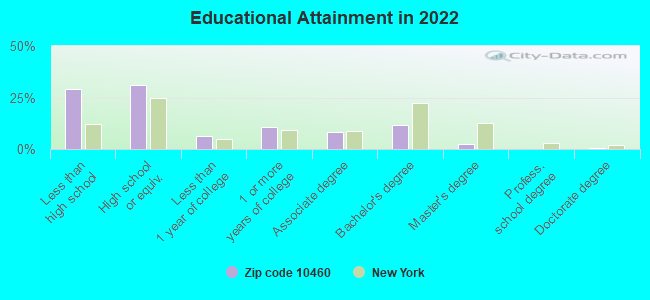
For population 25 years and over in 10460:
High school or higher: 69.9%
Bachelor's degree or higher: 14.7%
Graduate or professional degree: 3.2%
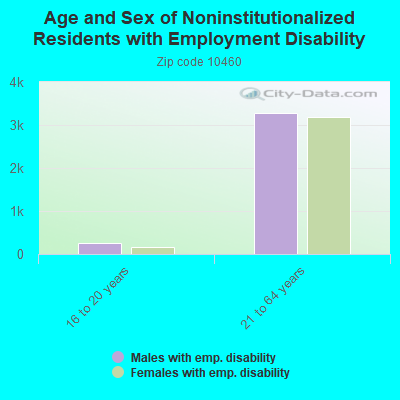
Unemployed: 12.3%
Mean travel time to work (commute): 46.2 minutes
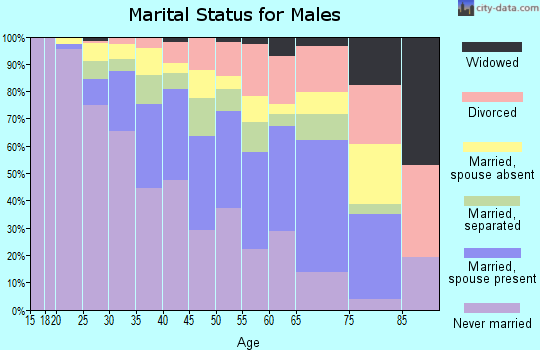
For population 15 years and over in 10460:
Never married: 51.8%
Now married: 29.8%
Separated: 4.8%
Widowed: 3.6%
Divorced: 10.0%
Zip code 10460 compared to state average:
Median household income significantly below state average.
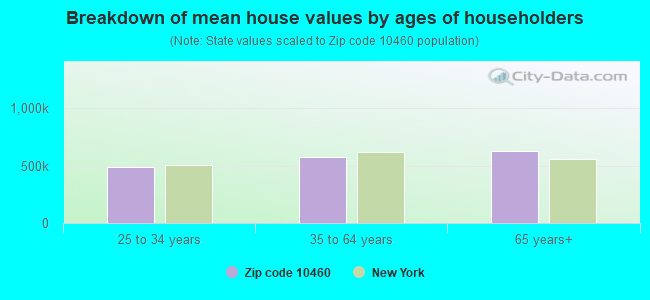
Median house value above state average.
Unemployed percentage above state average.
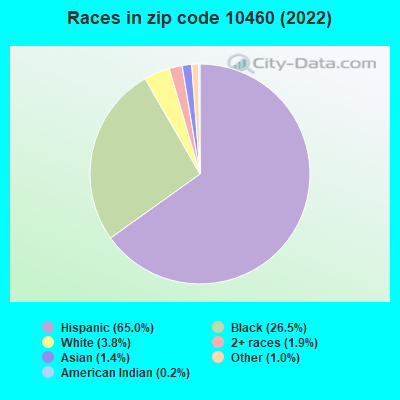
Black race population percentage above state average.
Hispanic race population percentage significantly above state average.
Median age below state average.
Renting percentage above state average.
Length of stay since moving in above state average.
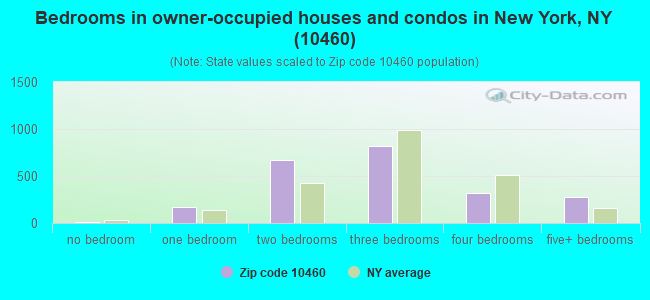
Number of rooms per house below state average.
Percentage of population with a bachelor's degree or higher significantly below state average.
Averages for the 2020 tax year for zip code 10460, filed in 2021:
Average Adjusted Gross Income (AGI) in 2020: $32,172 (Individual Income Tax Returns)
Here:
$32,172
State:
$90,930
Salary/wage: $32,552 (reported on 77.2% of returns)
Here:
$32,552
State:
$72,104
(% of AGI for various income ranges: 842.0% for AGIs below $25k, 3301.9% for AGIs $25k-50k, 6659.4% for AGIs $50k-75k, 10124.8% for AGIs $75k-100k, 16258.0% for AGIs $100k-200k)
Taxable interest for individuals: $228 (reported on 9.9% of returns)
This zip code:
$228
New York:
$3,075
(% of AGI for various income ranges: 1.6% for AGIs below $25k, 1.5% for AGIs $25k-50k, 4.2% for AGIs $50k-75k, 10.1% for AGIs $75k-100k, 30.8% for AGIs $100k-200k)
Ordinary dividends: $1,341 (reported on 2.2% of returns)
Here:
$1,341
State:
$11,095
(% of AGI for various income ranges: 1.0% for AGIs below $25k, 1.1% for AGIs $25k-50k, 1.7% for AGIs $50k-75k, 17.7% for AGIs $75k-100k, 89.0% for AGIs $100k-200k)
Net capital gain/loss in AGI: +$1,820 (reported on 3.1% of returns)
Here:
+$1,820
State:
+$44,925
(% of AGI for various income ranges: 2.3% for AGIs $25k-50k, 7.2% for AGIs $50k-75k, 14.4% for AGIs $75k-100k, 237.1% for AGIs $100k-200k)
Profit/loss from business: +$5,436 (reported on 19.0% of returns)
Here:
+$5,436
State:
+$14,940
(% of AGI for various income ranges: 195.6% for AGIs below $25k, 66.4% for AGIs $25k-50k, 65.9% for AGIs $50k-75k, 158.5% for AGIs $75k-100k, 190.6% for AGIs $100k-200k)
Taxable individual retirement arrangement distribution: $11,122 (reported on 0.8% of returns)
10460:
$11,122
New York:
$19,609
(% of AGI for various income ranges: 3.1% for AGIs below $25k, 5.7% for AGIs $25k-50k, 32.4% for AGIs $50k-75k, 165.9% for AGIs $100k-200k)
Total itemized deductions: $24,440 (reported on 2.4% of returns)
Here:
$24,440
State:
$39,326
(% of AGI for various income ranges: 10.1% for AGIs below $25k, 35.8% for AGIs $25k-50k, 136.5% for AGIs $50k-75k, 390.3% for AGIs $75k-100k, 1102.2% for AGIs $100k-200k)
Charity contributions: $7,074 (reported on 1.6% of returns)
Here:
$7,074
State:
$15,420
(% of AGI for various income ranges: 0.7% for AGIs below $25k, 5.9% for AGIs $25k-50k, 32.3% for AGIs $50k-75k, 77.2% for AGIs $75k-100k, 241.8% for AGIs $100k-200k)
Taxes paid: $8,131 (reported on 2.3% of returns)
10460:
$8,131
State:
$9,183
(% of AGI for various income ranges: 2.3% for AGIs below $25k, 10.1% for AGIs $25k-50k, 41.9% for AGIs $50k-75k, 145.9% for AGIs $75k-100k, 395.9% for AGIs $100k-200k)
Earned income credit: $2,480 (reported on 34.3% of returns)
Here:
$2,480
State:
$2,138
(% of AGI for various income ranges: 158.5% for AGIs below $25k, 97.0% for AGIs $25k-50k, 0.7% for AGIs $50k-75k)
Percentage of individuals using paid preparers for their 2020 taxes: 95.2%
Here:
95%
State:
95%
(% for various income ranges: 93.9% for AGIs below $25k, 96.7% for AGIs $25k-50k, 96.5% for AGIs $50k-75k, 96.3% for AGIs $75k-100k, 94.7% for AGIs $100k-200k, 80.0% for AGIs over 200k)
Averages for the 2012 tax year for zip code 10460, filed in 2013:
Average Adjusted Gross Income (AGI) in 2012: $26,068 (Individual Income Tax Returns)
Here:
$26,068
State:
$77,088
Salary/wage: $27,831 (reported on 81.2% of returns)
Here:
$27,831
State:
$60,593
(% of AGI for various income ranges: 71.0% for AGIs below $25k, 94.7% for AGIs $25k-50k, 93.5% for AGIs $50k-75k, 91.4% for AGIs $75k-100k, 84.6% for AGIs $100k-200k)
Taxable interest for individuals: $321 (reported on 9.0% of returns)
This zip code:
$321
New York:
$3,125
(% of AGI for various income ranges: 0.1% for AGIs $50k-75k, 0.1% for AGIs $75k-100k, 0.3% for AGIs $100k-200k)
Ordinary dividends: $1,322 (reported on 1.8% of returns)
Here:
$1,322
State:
$10,299
(% of AGI for various income ranges: 0.1% for AGIs $50k-75k, 0.2% for AGIs $75k-100k, 0.2% for AGIs $100k-200k)
Profit/loss from business: +$8,380 (reported on 20.7% of returns)
Here:
+$8,380
State:
+$16,168
(% of AGI for various income ranges: 21.8% for AGIs below $25k, 0.6% for AGIs $25k-50k, 0.6% for AGIs $50k-75k, 0.5% for AGIs $75k-100k, 0.3% for AGIs $100k-200k)
Taxable individual retirement arrangement distribution: $8,567 (reported on 1.0% of returns)
10460:
$8,567
New York:
$17,621
(% of AGI for various income ranges: 0.2% for AGIs below $25k, 0.2% for AGIs $25k-50k, 0.4% for AGIs $50k-75k, 0.5% for AGIs $75k-100k, 1.1% for AGIs $100k-200k)
Total itemized deductions: $19,432 (35% of AGI, reported on 17.8% of returns)
Here:
$19,432
State:
$34,985
Here:
35.5% of AGI
State:
21.3% of AGI
(% of AGI for various income ranges: 2.2% for AGIs below $25k, 13.9% for AGIs $25k-50k, 23.6% for AGIs $50k-75k, 18.4% for AGIs $75k-100k, 19.5% for AGIs $100k-200k)
Charity contributions: $2,854 (reported on 14.3% of returns)
Here:
$2,854
State:
$5,572
(% of AGI for various income ranges: 0.2% for AGIs below $25k, 1.7% for AGIs $25k-50k, 2.6% for AGIs $50k-75k, 2.5% for AGIs $75k-100k, 2.4% for AGIs $100k-200k)
Taxes paid: $6,236 (reported on 17.8% of returns)
10460:
$6,236
State:
$18,656
(% of AGI for various income ranges: 0.4% for AGIs below $25k, 3.3% for AGIs $25k-50k, 8.4% for AGIs $50k-75k, 7.7% for AGIs $75k-100k, 8.8% for AGIs $100k-200k)
Earned income credit: $2,715 (reported on 46.9% of returns)
Here:
$2,715
State:
$2,230
(% of AGI for various income ranges: 15.0% for AGIs below $25k, 1.7% for AGIs $25k-50k)
Percentage of individuals using paid preparers for their 2012 taxes: 78.0%
Here:
78%
State:
66%
(% for various income ranges: 78.3% for AGIs below $25k, 77.7% for AGIs $25k-50k, 78.7% for AGIs $50k-75k, 73.8% for AGIs $75k-100k, 76.5% for AGIs $100k-200k)
Averages for the 2004 tax year for zip code 10460, filed in 2005:
Average Adjusted Gross Income (AGI) in 2004: $23,660 (Individual Income Tax Returns)
Here:
$23,660
State:
$59,519
Salary/wage: $24,939 (reported on 85.9% of returns)
Here:
$24,939
State:
$50,673
(% of AGI for various income ranges: 61.8% for AGIs below $10k, 85.6% for AGIs $10k-25k, 97.0% for AGIs $25k-50k, 94.9% for AGIs $50k-75k, 89.2% for AGIs $75k-100k, 77.7% for AGIs over 100k)
Taxable interest for individuals: $473 (reported on 14.8% of returns)
This zip code:
$473
New York:
$2,377
(% of AGI for various income ranges: 0.5% for AGIs below $10k, 0.3% for AGIs $10k-25k, 0.2% for AGIs $25k-50k, 0.4% for AGIs $50k-75k, 0.3% for AGIs $75k-100k, 0.8% for AGIs over 100k)
Taxable dividends: $630 (reported on 2.8% of returns)
Here:
$630
State:
$5,394
(% of AGI for various income ranges: 0.1% for AGIs below $10k, 0.1% for AGIs $10k-25k, 0.0% for AGIs $25k-50k, 0.1% for AGIs $50k-75k, 0.1% for AGIs $75k-100k, 0.4% for AGIs over 100k)
Net capital gain/loss: +$2,578 (reported on 1.9% of returns)
Here:
+$2,578
State:
+$23,581
(% of AGI for various income ranges: -0.2% for AGIs below $10k, -0.0% for AGIs $10k-25k, -0.0% for AGIs $25k-50k, 0.1% for AGIs $50k-75k, 0.5% for AGIs $75k-100k, 6.9% for AGIs over 100k)
Profit/loss from business: +$7,056 (reported on 17.8% of returns)
Here:
+$7,056
State:
+$13,809
(% of AGI for various income ranges: 38.3% for AGIs below $10k, 10.4% for AGIs $10k-25k, 0.5% for AGIs $25k-50k, 0.1% for AGIs $50k-75k, 0.0% for AGIs $75k-100k, -0.6% for AGIs over 100k)
IRA payment deduction: $1,871 (reported on 0.9% of returns)
10460:
$1,871
New York:
$3,115
(% of AGI for various income ranges: 0.1% for AGIs below $10k, 0.1% for AGIs $10k-25k, 0.1% for AGIs $25k-50k, 0.1% for AGIs $50k-75k)
Total itemized deductions: $15,082 (33% of AGI, reported on 20.0% of returns)
Here:
$15,082
State:
$25,864
Here:
33.0% of AGI
State:
21.9% of AGI
(% of AGI for various income ranges: 1.7% for AGIs below $10k, 4.3% for AGIs $10k-25k, 14.8% for AGIs $25k-50k, 20.3% for AGIs $50k-75k, 20.7% for AGIs $75k-100k, 20.6% for AGIs over 100k)
Charity contributions deductions: $3,020 (6% of AGI, reported on 18.2% of returns)
Here:
$3,020
State:
$4,439
Here:
6.5% of AGI
State:
3.6% of AGI
(% of AGI for various income ranges: 0.1% for AGIs below $10k, 0.7% for AGIs $10k-25k, 2.7% for AGIs $25k-50k, 3.8% for AGIs $50k-75k, 3.7% for AGIs $75k-100k, 3.8% for AGIs over 100k)
Total tax: $2,214 (reported on 57.8% of returns)
10460:
$2,214
State:
$11,730
(% of AGI for various income ranges: 5.8% for AGIs below $10k, 3.1% for AGIs $10k-25k, 4.5% for AGIs $25k-50k, 8.1% for AGIs $50k-75k, 10.3% for AGIs $75k-100k, 13.4% for AGIs over 100k)
Earned income credit: $2,120 (reported on 48.8% of returns)
Here:
$2,120
State:
$1,757
Percentage of individuals using paid preparers for their 2004 taxes: 77.0%
Here:
77%
State:
67%
(% for various income ranges: 77.5% for AGIs below $10k, 79.9% for AGIs $10k-25k, 73.9% for AGIs $25k-50k, 73.5% for AGIs $50k-75k, 76.1% for AGIs $75k-100k, 74.0% for AGIs over 100k)
Likely homosexual households (counted as self-reported same-sex unmarried-partner households)
Lesbian couples: 0.1% of all households
Gay men: 0.2% of all households
Household received Food Stamps/SNAP in the past 12 months: 12,514 Household did not receive Food Stamps/SNAP in the past 12 months: 10,828
Women who had a birth in the past 12 months: 906 (315 now married, 608 unmarried) Women who did not have a birth in the past 12 months: 14,704 (3,551 now married, 11,240 unmarried)
Housing units in zip code 10460 with a mortgage: 1,449 (182 second mortgage, 67 home equity loan, 96 both second mortgage and home equity loan) Median monthly owner costs for units with a mortgage: $3,031 Median monthly owner costs for units without a mortgage: $1,102
Residents with income below the poverty level in 2022:
This zip code:
37.2%
Whole state:
14.3%
Residents with income below 50% of the poverty level in 2022:
This zip code:
20.5%
Whole state:
6.8%
Median number of rooms in houses and condos:
Here:
5.1
State:
6.3
Median number of rooms in apartments:
Here:
3.7
State:
3.8
Notable locations in this zip code not listed on our city pages
Notable locations in zip code 10460: West Farms Branch New York Public Library (A), Department of Sanitation District 6 Garage (B), Crotona Terrace (C), New York Ladder Company 58 (D), Madison Square Boys Club (E), Fire Department New York Engine 45 Ladder 58 Battalion 18 (F). Display/hide their locations on the map
Churches in zip code 10460 include: Iglesia Bautista Cristiana (A), Iglesia Pentecostal Jehova Shalom (B), Mennonite House of Friendship (C), Emmanuel Swedish Evangelical Church (D), Grace Episcopal Church (E), Messiah Swedish Lutheran Church (F), Roman Catholic Church of Saint Thomas Aquinas (G), Trinity Gospel Church (H), Russell Christian Methodist Episcopal Church (I). Display/hide their locations on the map
Parks in zip code 10460 include: Noble Playground (1), Wood Park (2), Young Park (3), Fairmount Playground (4), Mapes Ballfield (5), Garden of Happiness (6), Volky Flower Garden (7), Vidalia Park (8), Rock Garden Park (9). Display/hide their locations on the map
3,505 married couples with children.
9,025 single-parent households (1,092 men, 7,933 women).
38.0% of residents of 10460 zip code speak English at home.
53.8% of residents speak Spanish at home (53% very well, 16% well, 20% not well, 11% not at all).
3.3% of residents speak other Indo-European language at home (37% very well, 23% well, 31% not well, 9% not at all).
0.2% of residents speak Asian or Pacific Island language at home (26% very well, 13% well, 24% not well, 37% not at all).
4.1% of residents speak other language at home (55% very well, 36% well, 7% not well, 2% not at all).
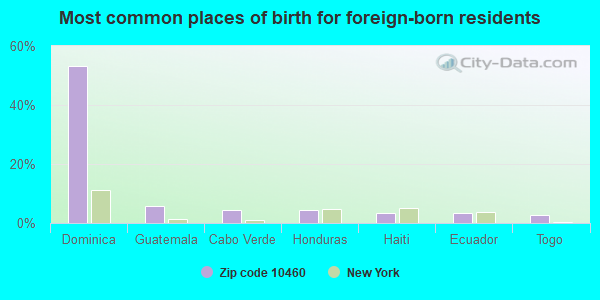
Foreign born population: 18,873 (32.0%) (50.5% of them are naturalized citizens)
This zip code:
32.0%
Whole state:
22.7%
53%Dominica
6%Guatemala
5%Cabo Verde
5%Honduras
3%Haiti
3%Ecuador
3%Togo
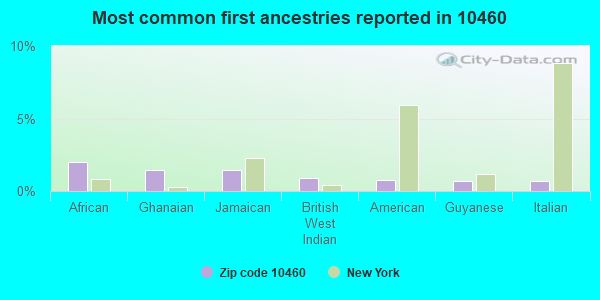
2%African
1%Ghanaian
1%Jamaican
1%British West Indian
1%American
1%Guyanese
1%Italian
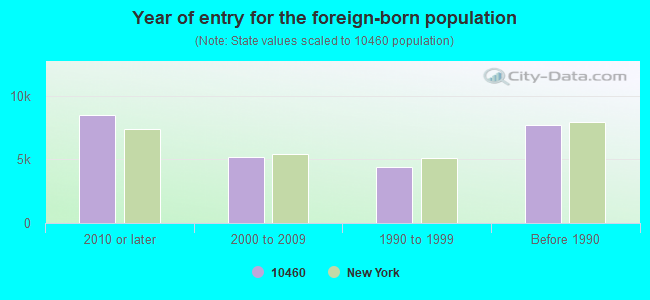
Year of entry for the foreign-born population
8,4732010 or later
5,1462000 to 2009
4,4111990 to 1999
7,690Before 1990
Major facilities with environmental interests located in this zip code:
GROUP HOME ( in BRONX, NY)
(National Center for Education Statistics) - STATE ID-321100898188 (National Center for Education Statistics) - STATE ID-321100898191 (National Center for Education Statistics) - STATE ID-321200890167 (National Center for Education Statistics) - STATE ID-321200890169 (National Center for Education Statistics) - STATE ID-321200891175 Organizations: NEW YORK CITY PUBLIC SCHOOLS (SCHOOL DISTRICT)
Alternative names: CARPENTER AVE GROUP HOME
GROUP HOME 2 APT 2R ( in BRONX, NY)
(National Center for Education Statistics) - STATE ID-321100890105 (National Center for Education Statistics) - STATE ID-321100898187 (National Center for Education Statistics) - STATE ID-321200890006 Organizations: NEW YORK CITY PUBLIC SCHOOLS (SCHOOL DISTRICT)
ARCHER CLEANERS (1803 ARCHER STREET in BRONX, NY)
AIR MINOR (AIRS/AFS) STATE MASTER (New York facility tracking) - AIR PROGRAM Conditionally Exempt Small Quantity Generators, less than 100 kg/month of hazardous waste (Resource Conservation and Recovery Act (tracking hazardous waste)) - notification Business SIC classification: DRYCLEANING PLANTS, EXCEPT RUG CLEANING Business NAICS classification: DRYCLEANING AND LAUNDRY SERVICES (EXCEPT COIN-OPERATED). Organizations: LANGSAM PROPERTY SERVICES CORP (CONTACT/OWNER)
, Y CLEANERS & TAILORS (LEGALLY RESPONSIBLE PARTY)
, PUVA INC (LEGALLY RESPONSIBLE PARTY)
, ARCHER CLEANER INC (LEGALLY RESPONSIBLE PARTY)
Alternative names: ARCHER'S CLEANERS & TAILORS, Y CLEANERS & TAILERS DBA HI SPOT CLEAN
ADHESIVE PRODUCTS CORP (1660-1684 BOONE AVE in BRONX, NY)
AIR MINOR (AIRS/AFS) (Integrated Compliance Information System) - ICIS-02-1992-0230, FORMAL ENFORCEMENT ACTION (Resource Conservation and Recovery Act (tracking hazardous waste)) Business SIC classification: ADHESIVES AND SEALANTS; NONCLASSIFIABLE ESTABLISHMENTS
ARECIBO CLEANERS (814 EAST 182 STREET in BRONX, NY)
AIR MINOR (AIRS/AFS) STATE MASTER (New York facility tracking) - AIR PROGRAM Conditionally Exempt Small Quantity Generators, less than 100 kg/month of hazardous waste (Resource Conservation and Recovery Act (tracking hazardous waste)) - notification Business SIC classification: DRYCLEANING PLANTS, EXCEPT RUG CLEANING Business NAICS classification: DRYCLEANING AND LAUNDRY SERVICES (EXCEPT COIN-OPERATED). Organizations: KELL ROSADO (CONTACT/OWNER)
CLEAN JEANS DRY CLEANERS (1407 E 180TH ST in BRONX, NY)
AIR MINOR (AIRS/AFS) STATE MASTER (New York facility tracking) - AIR PROGRAM Small Quantity Generators, between 100 kg and 1000 kg of hazardous waste/month (Resource Conservation and Recovery Act (tracking hazardous waste)) - notification Business SIC classification: DRYCLEANING PLANTS, EXCEPT RUG CLEANING Business NAICS classification: DRYCLEANING AND LAUNDRY SERVICES (EXCEPT COIN-OPERATED). Organizations: CLEAN SHEEN DRY CLEANERS NC (CONTACT/OWNER)
, CLEAN SHEEN DRY CLEANERS INC (LEGALLY RESPONSIBLE PARTY)
HILL S CLEANERS (985 E 174TH ST in BRONX, NY)
AIR MINOR (AIRS/AFS) STATE MASTER (New York facility tracking) - AIR PROGRAM Small Quantity Generators, between 100 kg and 1000 kg of hazardous waste/month (Resource Conservation and Recovery Act (tracking hazardous waste)) - notification Business SIC classification: DRYCLEANING PLANTS, EXCEPT RUG CLEANING Business NAICS classification: DRYCLEANING AND LAUNDRY SERVICES (EXCEPT COIN-OPERATED). Organizations: UNKNOWN (CONTACT/OWNER)
Alternative names: HILLS CLEANERS
AMOCO-#60024 (1776 SOUTHERN BLVD in BRONX, NY)
AIR MINOR (AIRS/AFS) STATE MASTER (New York facility tracking) - AIR PROGRAM Business SIC classification: GASOLINE SERVICE STATIONS Organizations: AMOCO OIL CO (LEGALLY RESPONSIBLE PARTY)
ICE CAP INC (1725 WEST FARMS ROAD in BRONX, NY)
AIR SYNTHETIC MINOR (AIRS/AFS) STATE MASTER (New York facility tracking) - AIR PROGRAM, Business SIC classification: MISCELLANEOUS STRUCTURAL METALWORK; FABRICATED METAL PRODUCTS Organizations: WIL-RAY METAL FABRICATORS (LEGALLY RESPONSIBLE PARTY)
Alternative names: WILRAY METAL FABRICATORS INCORPORATED
GETTY PETROLEUM CORP 00276 (1720 BOONE AVE & E 174TH ST in BRONX, NY)
(Integrated Compliance Information System) - ICIS-02-1999-7503, FORMAL ENFORCEMENT ACTION Small Quantity Generators, between 100 kg and 1000 kg of hazardous waste/month (Resource Conservation and Recovery Act (tracking hazardous waste)) - notification Business SIC classification: GASOLINE SERVICE STATIONS
IS 98 H. RIDDER CAMPUS ( in BRONX, NY)
(National Center for Education Statistics) - STATE ID-321200010098 Organizations: NEW YORK CITY PUBLIC SCHOOLS (SCHOOL DISTRICT)
IS 190 ( in BRONX, NY)
(National Center for Education Statistics) - STATE ID-321200010190 Organizations: NEW YORK CITY PUBLIC SCHOOLS (SCHOOL DISTRICT)
IS 191 ( in BRONX, NY)
(National Center for Education Statistics) - STATE ID-321200010191 Organizations: NEW YORK CITY PUBLIC SCHOOLS (SCHOOL DISTRICT)
Housing units lacking complete plumbing facilities: 1.1% Housing units lacking complete kitchen facilities: 1.0%
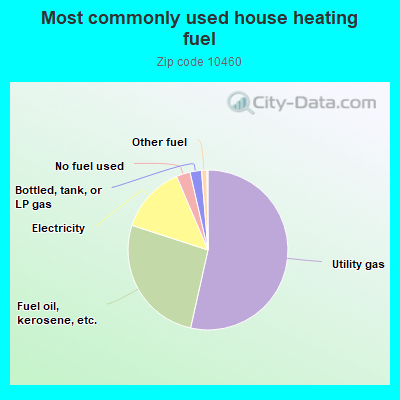
53.5%Utility gas
26.5%Fuel oil, kerosene, etc.
13.6%Electricity
2.8%No fuel used
2.3%Bottled, tank, or LP gas
1.1%Other fuel
Population in 1990: 47,250. Population change in the 1990s: +6,457 (+13.7%).
Place of birth for U.S.-born residents:
This state: 30,811
Northeast: 835
Midwest: 293
South: 1,231
West: 245
64% of the 10460 zip code residents lived in the same house 5 years ago. Out of people who lived in different houses, 75% lived in this county. Out of people who lived in different counties, 50% lived in New York.
91% of the 10460 zip code residents lived in the same house 1 year ago. Out of people who lived in different houses, 49% moved from this county. Out of people who lived in different houses, 37% moved from different county within same state. Out of people who lived in different houses, 6% moved from different state. Out of people who lived in different houses, 8% moved from abroad.
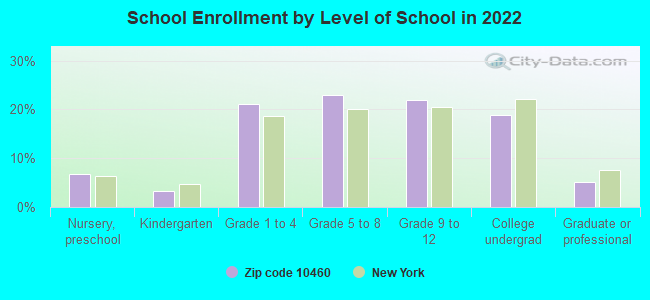
Private vs. public school enrollment:
Students in private schools in grades 1 to 8 (elementary and middle school): 384
Here:
5.4%
New York:
15.6%
Students in private schools in grades 9 to 12 (high school): 174
Here:
4.9%
New York:
15.0%
Students in private undergraduate colleges: 503
Here:
16.6%
New York:
39.2%
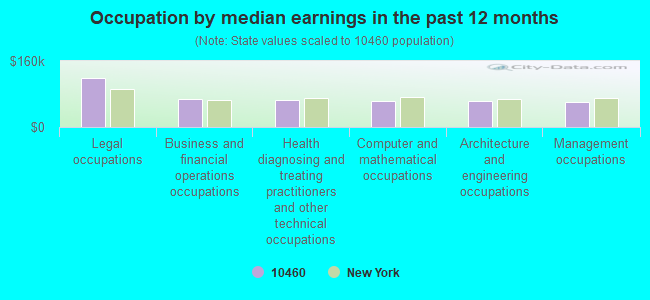
Occupation by median earnings in the past 12 months ($)
118,482Legal occupations
67,828Business and financial operations occupations
64,871Health diagnosing and treating practitioners and other technical occupations
63,340Computer and mathematical occupations
62,763Architecture and engineering occupations
61,614Management occupations
Top industries in this zip code by the number of employees in 2005:
Health Care and Social Assistance: Home Health Care Services (500-999 employees: 1 establishment, 10-19 employees: 1 establishment)
Administrative and Support and Waste Management and Remediation Services: Security Guards and Patrol Services (250-499: 1, 100-249: 2, 20-49: 1, 5-9: 1)
Management of Companies and Enterprises: Corporate, Subsidiary, and Regional Managing Offices (250-499: 1, 1-4: 1)
Health Care and Social Assistance: All Other Outpatient Care Centers (250-499: 1)
Arts, Entertainment, and Recreation: Zoos and Botanical Gardens (250-499: 1)
Health Care and Social Assistance: Child Day Care Services (100-249: 1, 50-99: 1, 20-49: 2, 10-19: 1, 5-9: 1, 1-4: 4)
Real Estate and Rental and Leasing: Lessors of Residential Buildings and Dwellings (20-49: 2, 10-19: 5, 5-9: 4, 1-4: 44)
2007 - 2018 National Fire Incident Reporting System (NFIRS) incidents
Based on the data from the years 2007 - 2018 the average number of fire incidents per year is 368. The highest number of fires - 477 took place in 2010, and the least - 203 in 2007. The data has a rising trend.
When looking into fire subcategories, the most incidents belonged to: Structure Fires (73.8%), and Outside Fires (14.6%).
Fire incident types reported to NFIRS in Zip Code 10460


 Nearest zip codes: 10472, 10462, 10457, 10459, 10458, 10456.


 Based on the data from the years 2007 - 2018 the average number of fire incidents per year is 368. The highest number of fires - 477 took place in 2010, and the least - 203 in 2007. The data has a rising trend.
 When looking into fire subcategories, the most incidents belonged to: Structure Fires (73.8%), and Outside Fires (14.6%).