Estimated zip code population in 2022: 34,200 Zip code population in 2010: 38,780 Zip code population in 2000: 44,321
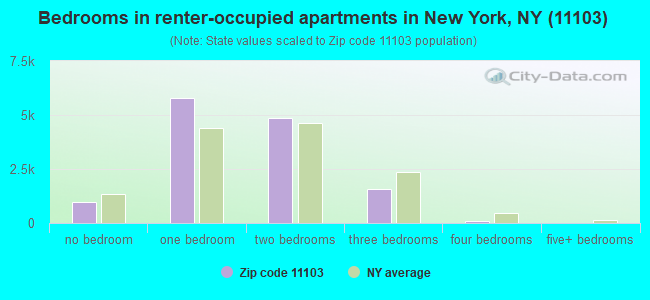
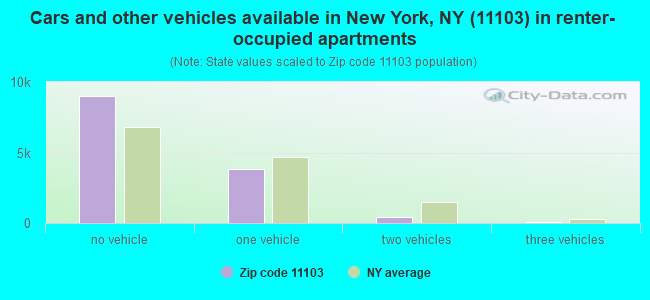
Houses and condos: 18,706 Renter-occupied apartments: 13,342
% of renters here:
84%
State:
46%
March 2022 cost of living index in zip code 11103: 156.6 (very high, U.S. average is 100)
Land area: 0.7 sq. mi. Water area: 0.0 sq. mi.
Population density: 48,096 people per square mile
(very high).
OSM Map
General Map
Google Map
MSN Map
OSM Map
General Map
Google Map
MSN Map
OSM Map
General Map
Google Map
MSN Map
OSM Map
General Map
Google Map
MSN Map
Please wait while loading the map...
Real estate property taxes paid for housing units in 2022:
This zip code:
0.8% ($8,319)
New York:
1.5% ($6,180)
Median real estate property taxes paid for housing units with mortgages in 2022: $9,118 (0.8%) Median real estate property taxes paid for housing units with no mortgage in 2022: $7,592 (0.9%)
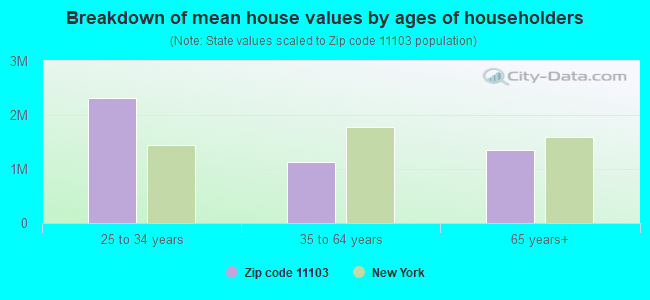
Estimated median house/condo value in 2022: $1,040,560
11103:
$1,040,560
New York:
$400,400
According to our research of New York and other state lists, there were 11 registered sex offenders living in 11103 zip code as of April 27, 2024. The ratio of all residents to sex offenders in zip code 11103 is 3,583 to 1. The ratio of registered sex offenders to all residents in this zip code is much lower than the state average.
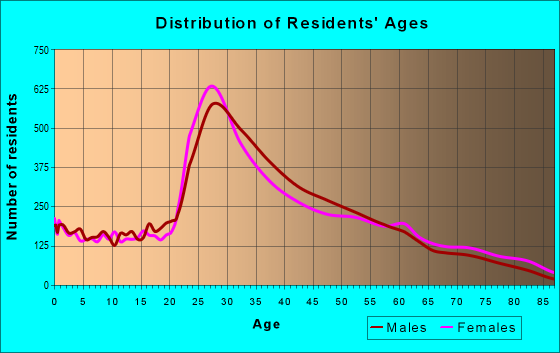
Median resident age:
This zip code:
35.9 years
New York median age:
40.0 years
Average household size:
This zip code:
2.1 people
New York:
2.5 people
Averages for the 2020 tax year for zip code 11103, filed in 2021:
Average Adjusted Gross Income (AGI) in 2020: $60,437 (Individual Income Tax Returns)
Here:
$60,437
State:
$90,930
Salary/wage: $59,374 (reported on 77.6% of returns)
Here:
$59,374
State:
$72,104
(% of AGI for various income ranges: 884.1% for AGIs below $25k, 3383.9% for AGIs $25k-50k, 7009.6% for AGIs $50k-75k, 10828.1% for AGIs $75k-100k, 19672.9% for AGIs $100k-200k, 85125.0% for AGIs over 200k)
Taxable interest for individuals: $1,107 (reported on 25.0% of returns)
This zip code:
$1,107
New York:
$3,075
(% of AGI for various income ranges: 20.6% for AGIs below $25k, 13.4% for AGIs $25k-50k, 30.7% for AGIs $50k-75k, 46.4% for AGIs $75k-100k, 104.4% for AGIs $100k-200k, 750.6% for AGIs over 200k)
Ordinary dividends: $2,814 (reported on 17.2% of returns)
Here:
$2,814
State:
$11,095
(% of AGI for various income ranges: 19.6% for AGIs below $25k, 21.2% for AGIs $25k-50k, 31.3% for AGIs $50k-75k, 83.4% for AGIs $75k-100k, 163.2% for AGIs $100k-200k, 2173.9% for AGIs over 200k)
Net capital gain/loss in AGI: +$7,859 (reported on 17.3% of returns)
Here:
+$7,859
State:
+$44,925
(% of AGI for various income ranges: 6.2% for AGIs below $25k, 26.3% for AGIs $25k-50k, 56.5% for AGIs $50k-75k, 110.1% for AGIs $75k-100k, 426.4% for AGIs $100k-200k, 9631.1% for AGIs over 200k)
Profit/loss from business: +$8,786 (reported on 24.5% of returns)
Here:
+$8,786
State:
+$14,940
(% of AGI for various income ranges: 404.0% for AGIs below $25k, 255.3% for AGIs $25k-50k, 180.9% for AGIs $50k-75k, 268.6% for AGIs $75k-100k, 380.0% for AGIs $100k-200k, 2640.6% for AGIs over 200k)
Taxable individual retirement arrangement distribution: $11,715 (reported on 3.5% of returns)
11103:
$11,715
New York:
$19,609
(% of AGI for various income ranges: 26.7% for AGIs below $25k, 25.1% for AGIs $25k-50k, 49.7% for AGIs $50k-75k, 109.8% for AGIs $75k-100k, 197.1% for AGIs $100k-200k, 293.9% for AGIs over 200k)
Self-employed (Keogh) retirement plans: $14,657 (reported on 0.3% of returns)
11103:
$14,657
New York:
$32,497
(% of AGI for various income ranges: 12.0% for AGIs $50k-75k, 48.2% for AGIs $100k-200k)
Total itemized deductions: $29,027 (reported on 4.1% of returns)
Here:
$29,027
State:
$39,326
(% of AGI for various income ranges: 36.1% for AGIs below $25k, 57.9% for AGIs $25k-50k, 100.7% for AGIs $50k-75k, 216.2% for AGIs $75k-100k, 527.1% for AGIs $100k-200k, 4045.6% for AGIs over 200k)
Charity contributions: $6,784 (reported on 3.3% of returns)
Here:
$6,784
State:
$15,420
(% of AGI for various income ranges: 3.1% for AGIs below $25k, 4.9% for AGIs $25k-50k, 12.7% for AGIs $50k-75k, 33.7% for AGIs $75k-100k, 87.6% for AGIs $100k-200k, 1182.8% for AGIs over 200k)
Taxes paid: $8,742 (reported on 4.1% of returns)
11103:
$8,742
State:
$9,183
(% of AGI for various income ranges: 7.7% for AGIs below $25k, 15.1% for AGIs $25k-50k, 28.4% for AGIs $50k-75k, 76.6% for AGIs $75k-100k, 187.5% for AGIs $100k-200k, 1036.1% for AGIs over 200k)
Earned income credit: $1,591 (reported on 14.0% of returns)
Here:
$1,591
State:
$2,138
(% of AGI for various income ranges: 72.9% for AGIs below $25k, 47.0% for AGIs $25k-50k, 0.3% for AGIs $50k-75k)
Percentage of individuals using paid preparers for their 2020 taxes: 94.2%
Here:
94%
State:
95%
(% for various income ranges: 91.5% for AGIs below $25k, 95.1% for AGIs $25k-50k, 96.1% for AGIs $50k-75k, 95.9% for AGIs $75k-100k, 95.6% for AGIs $100k-200k, 96.7% for AGIs over 200k)
Averages for the 2012 tax year for zip code 11103, filed in 2013:
Average Adjusted Gross Income (AGI) in 2012: $43,463 (Individual Income Tax Returns)
Here:
$43,463
State:
$77,088
Salary/wage: $45,943 (reported on 79.5% of returns)
Here:
$45,943
State:
$60,593
(% of AGI for various income ranges: 62.3% for AGIs below $25k, 88.5% for AGIs $25k-50k, 90.7% for AGIs $50k-75k, 89.2% for AGIs $75k-100k, 86.9% for AGIs $100k-200k, 65.4% for AGIs over 200k)
Taxable interest for individuals: $795 (reported on 28.3% of returns)
This zip code:
$795
New York:
$3,125
(% of AGI for various income ranges: 0.9% for AGIs below $25k, 0.3% for AGIs $25k-50k, 0.5% for AGIs $50k-75k, 0.5% for AGIs $75k-100k, 0.5% for AGIs $100k-200k, 0.9% for AGIs over 200k)
Ordinary dividends: $2,216 (reported on 12.7% of returns)
Here:
$2,216
State:
$10,299
(% of AGI for various income ranges: 0.8% for AGIs below $25k, 0.5% for AGIs $25k-50k, 0.5% for AGIs $50k-75k, 0.5% for AGIs $75k-100k, 0.7% for AGIs $100k-200k, 1.5% for AGIs over 200k)
Net capital gain/loss in AGI: +$4,189 (reported on 9.6% of returns)
Here:
+$4,189
State:
+$42,474
(% of AGI for various income ranges: 0.2% for AGIs $50k-75k, 0.2% for AGIs $75k-100k, 0.6% for AGIs $100k-200k, 9.9% for AGIs over 200k)
Profit/loss from business: +$9,305 (reported on 25.1% of returns)
Here:
+$9,305
State:
+$16,168
(% of AGI for various income ranges: 27.0% for AGIs below $25k, 4.9% for AGIs $25k-50k, 1.9% for AGIs $50k-75k, 1.6% for AGIs $75k-100k, 1.5% for AGIs $100k-200k, 2.3% for AGIs over 200k)
Taxable individual retirement arrangement distribution: $10,068 (reported on 3.9% of returns)
11103:
$10,068
New York:
$17,621
(% of AGI for various income ranges: 1.2% for AGIs below $25k, 0.7% for AGIs $25k-50k, 0.9% for AGIs $50k-75k, 0.9% for AGIs $75k-100k, 1.3% for AGIs $100k-200k)
Self-employment retirement plans: $6,850 (reported on 0.3% of returns)
11103:
$6,850
New York:
$27,330
Total itemized deductions: $17,250 (20% of AGI, reported on 24.2% of returns)
Here:
$17,250
State:
$34,985
Here:
20.1% of AGI
State:
21.3% of AGI
(% of AGI for various income ranges: 4.4% for AGIs below $25k, 5.9% for AGIs $25k-50k, 9.1% for AGIs $50k-75k, 11.7% for AGIs $75k-100k, 13.7% for AGIs $100k-200k, 15.6% for AGIs over 200k)
Charity contributions: $2,047 (reported on 19.0% of returns)
Here:
$2,047
State:
$5,572
(% of AGI for various income ranges: 0.3% for AGIs below $25k, 0.6% for AGIs $25k-50k, 1.0% for AGIs $50k-75k, 1.1% for AGIs $75k-100k, 1.2% for AGIs $100k-200k, 1.3% for AGIs over 200k)
Taxes paid: $8,752 (reported on 24.2% of returns)
11103:
$8,752
State:
$18,656
(% of AGI for various income ranges: 1.1% for AGIs below $25k, 1.7% for AGIs $25k-50k, 3.9% for AGIs $50k-75k, 6.4% for AGIs $75k-100k, 8.3% for AGIs $100k-200k, 11.2% for AGIs over 200k)
Earned income credit: $1,815 (reported on 18.4% of returns)
Here:
$1,815
State:
$2,230
(% of AGI for various income ranges: 5.6% for AGIs below $25k, 0.5% for AGIs $25k-50k)
Percentage of individuals using paid preparers for their 2012 taxes: 65.2%
Here:
65%
State:
66%
(% for various income ranges: 69.9% for AGIs below $25k, 61.1% for AGIs $25k-50k, 59.6% for AGIs $50k-75k, 64.8% for AGIs $75k-100k, 66.2% for AGIs $100k-200k, 73.7% for AGIs over 200k)
Averages for the 2004 tax year for zip code 11103, filed in 2005:
Average Adjusted Gross Income (AGI) in 2004: $33,337 (Individual Income Tax Returns)
Here:
$33,337
State:
$59,519
Salary/wage: $35,706 (reported on 79.7% of returns)
Here:
$35,706
State:
$50,673
(% of AGI for various income ranges: 65.1% for AGIs below $10k, 72.3% for AGIs $10k-25k, 91.4% for AGIs $25k-50k, 90.2% for AGIs $50k-75k, 90.2% for AGIs $75k-100k, 78.1% for AGIs over 100k)
Taxable interest for individuals: $1,140 (reported on 40.1% of returns)
This zip code:
$1,140
New York:
$2,377
(% of AGI for various income ranges: 5.0% for AGIs below $10k, 2.0% for AGIs $10k-25k, 0.9% for AGIs $25k-50k, 1.2% for AGIs $50k-75k, 0.8% for AGIs $75k-100k, 1.8% for AGIs over 100k)
Taxable dividends: $1,813 (reported on 14.1% of returns)
Here:
$1,813
State:
$5,394
(% of AGI for various income ranges: 1.9% for AGIs below $10k, 0.8% for AGIs $10k-25k, 0.4% for AGIs $25k-50k, 0.5% for AGIs $50k-75k, 0.6% for AGIs $75k-100k, 1.7% for AGIs over 100k)
Net capital gain/loss: +$2,670 (reported on 10.8% of returns)
Here:
+$2,670
State:
+$23,581
(% of AGI for various income ranges: -0.8% for AGIs below $10k, -0.0% for AGIs $10k-25k, -0.2% for AGIs $25k-50k, 0.5% for AGIs $50k-75k, 0.8% for AGIs $75k-100k, 4.7% for AGIs over 100k)
Profit/loss from business: +$8,160 (reported on 22.4% of returns)
Here:
+$8,160
State:
+$13,809
(% of AGI for various income ranges: 38.8% for AGIs below $10k, 16.3% for AGIs $10k-25k, 2.7% for AGIs $25k-50k, 1.5% for AGIs $50k-75k, 1.2% for AGIs $75k-100k, 4.0% for AGIs over 100k)
IRA payment deduction: $2,960 (reported on 3.2% of returns)
11103:
$2,960
New York:
$3,115
(% of AGI for various income ranges: 0.3% for AGIs below $10k, 0.3% for AGIs $10k-25k, 0.4% for AGIs $25k-50k, 0.3% for AGIs $50k-75k, 0.2% for AGIs $75k-100k, 0.1% for AGIs over 100k)
Self-employed pension: $8,600 (reported on 0.2% of returns)
Here:
$8,600
New York:
$19,016
Total itemized deductions: $14,380 (24% of AGI, reported on 26.8% of returns)
Here:
$14,380
State:
$25,864
Here:
23.5% of AGI
State:
21.9% of AGI
(% of AGI for various income ranges: 5.1% for AGIs below $10k, 6.9% for AGIs $10k-25k, 10.3% for AGIs $25k-50k, 13.3% for AGIs $50k-75k, 14.1% for AGIs $75k-100k, 15.2% for AGIs over 100k)
Charity contributions deductions: $2,156 (3% of AGI, reported on 23.7% of returns)
Here:
$2,156
State:
$4,439
Here:
3.5% of AGI
State:
3.6% of AGI
(% of AGI for various income ranges: 0.3% for AGIs below $10k, 0.8% for AGIs $10k-25k, 1.5% for AGIs $25k-50k, 1.9% for AGIs $50k-75k, 1.9% for AGIs $75k-100k, 1.7% for AGIs over 100k)
Total tax: $4,391 (reported on 79.4% of returns)
11103:
$4,391
State:
$11,730
(% of AGI for various income ranges: 6.6% for AGIs below $10k, 5.6% for AGIs $10k-25k, 8.1% for AGIs $25k-50k, 11.4% for AGIs $50k-75k, 12.7% for AGIs $75k-100k, 17.3% for AGIs over 100k)
Earned income credit: $1,458 (reported on 18.3% of returns)
Here:
$1,458
State:
$1,757
Percentage of individuals using paid preparers for their 2004 taxes: 69.9%
Here:
70%
State:
67%
(% for various income ranges: 70.6% for AGIs below $10k, 71.8% for AGIs $10k-25k, 66.6% for AGIs $25k-50k, 69.8% for AGIs $50k-75k, 71.4% for AGIs $75k-100k, 76.7% for AGIs over 100k)
Likely homosexual households (counted as self-reported same-sex unmarried-partner households)
Lesbian couples: 0.3% of all households
Gay men: 1.0% of all households
Household received Food Stamps/SNAP in the past 12 months: 1,168 Household did not receive Food Stamps/SNAP in the past 12 months: 14,528
Women who had a birth in the past 12 months: 294 (288 now married, 2 unmarried) Women who did not have a birth in the past 12 months: 10,692 (3,435 now married, 7,278 unmarried)
Housing units in zip code 11103 with a mortgage: 1,142 (143 second mortgage, 144 both second mortgage and home equity loan) Median monthly owner costs for units with a mortgage: $3,860 Median monthly owner costs for units without a mortgage: $1,145
Residents with income below the poverty level in 2022:
This zip code:
10.8%
Whole state:
14.3%
Residents with income below 50% of the poverty level in 2022:
This zip code:
5.2%
Whole state:
6.8%
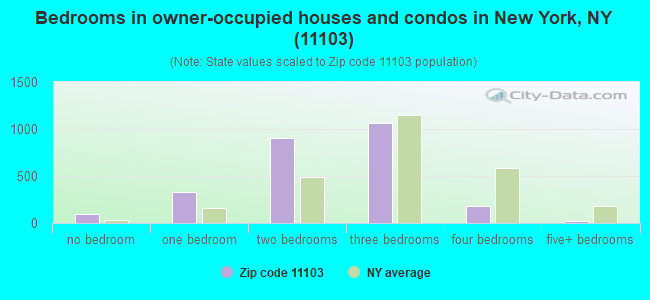
Median number of rooms in houses and condos:
Here:
4.7
State:
6.3
Median number of rooms in apartments:
Here:
3.5
State:
3.8
Notable locations in this zip code not listed on our city pages
Notable locations in zip code 11103: Fire Department New York Engine 263 Ladder 117 (A), New York Ladder Company 117 (B). Display/hide their locations on the map
Churches in zip code 11103 include: Trinity Lutheran Church (A), Saint Joseph's Roman Catholic Church (B), Saint Andrews Church (C), Open Door Bible Baptist Church (D), Church of the Most Precious Blood (E). Display/hide their locations on the map
Parks in zip code 11103 include: Playground Thirty-Five (1), Fagan Square (2), Astoria Heights Playground (3), Sean's Place (4). Display/hide their locations on the map
3,168 married couples with children.
608 single-parent households (213 men, 395 women).
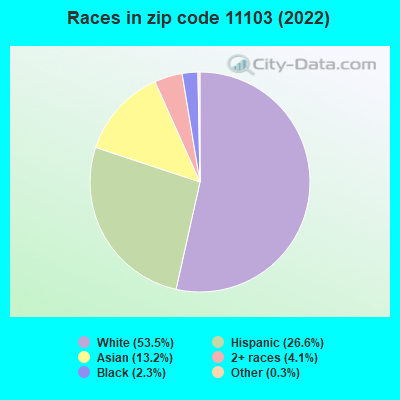
46.9% of residents of 11103 zip code speak English at home.
20.1% of residents speak Spanish at home (60% very well, 24% well, 11% not well, 6% not at all).
22.5% of residents speak other Indo-European language at home (66% very well, 24% well, 9% not well, 1% not at all).
6.2% of residents speak Asian or Pacific Island language at home (55% very well, 29% well, 9% not well, 7% not at all).
3.7% of residents speak other language at home (51% very well, 28% well, 14% not well, 7% not at all).
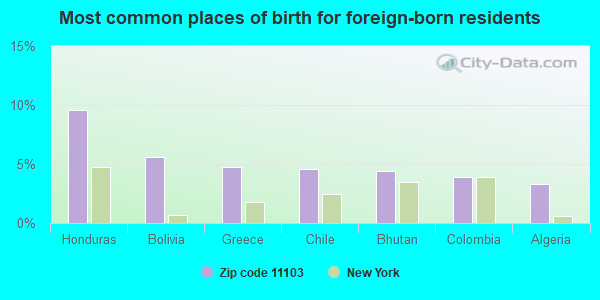
Foreign born population: 13,513 (39.5%) (55.0% of them are naturalized citizens)
This zip code:
39.5%
Whole state:
22.7%
10%Honduras
6%Bolivia
5%Greece
5%Chile
4%Bhutan
4%Colombia
3%Algeria
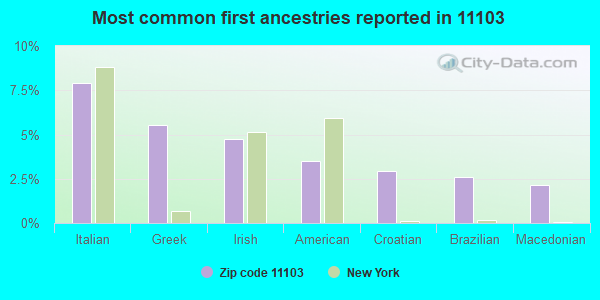
8%Italian
6%Greek
5%Irish
4%American
3%Croatian
3%Brazilian
2%Macedonian
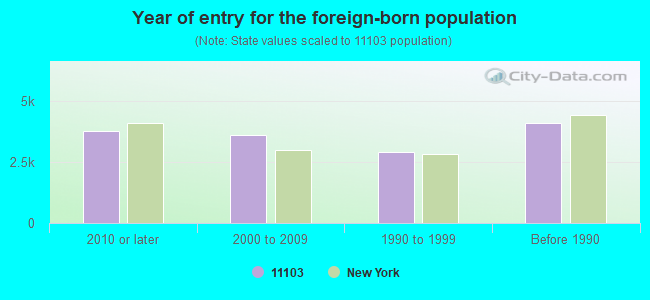
Year of entry for the foreign-born population
3,7562010 or later
3,6102000 to 2009
2,9071990 to 1999
4,101Before 1990
Private elementary/middle schools in in this zip code not listed on the city page:
Major facilities with environmental interests located in this zip code:
COZY 44 CLEANERS (43-20 BROADWAY in ASTORIA, NY)
AIR MINOR (AIRS/AFS) STATE MASTER (New York facility tracking) - AIR PROGRAM (Resource Conservation and Recovery Act (tracking hazardous waste)) Business SIC classification: DRYCLEANING PLANTS, EXCEPT RUG CLEANING Business NAICS classification: DRYCLEANING AND LAUNDRY SERVICES (EXCEPT COIN-OPERATED). Organizations: YOONS CLEANERS CORP (LEGALLY RESPONSIBLE PARTY)
Alternative names: YOON'S CLEANERS
30-45 42ND STREET SCHOOL - P-70 (30-45 42ND STREET in LONG ISLAND CITY, NY)
AIR MINOR (AIRS/AFS) STATE MASTER (New York facility tracking) - AIR PROGRAM Business SIC and NAICS classification: ELEMENTARY AND SECONDARY SCHOOLS Organizations: NYC DEPT OF EDUCATION (LEGALLY RESPONSIBLE PARTY)
Alternative names: LONG ISLAND PUBLIC SCHOOL 70
GUILD PLATERS INCORPORATED (48-09 25TH AVE in LONG ISLAND CITY, NY)
AIR MINOR (AIRS/AFS) ENFORCEMENT/COMPLIANCE ACTIVITY (Integrated Compliance Information System) HAZARDOUS WASTE BIENNIAL REPORTER (Resource Conservation and Recovery Act (tracking hazardous waste)) Large Quantity Generators, more that 1000 kg of hazardous waste/month (Resource Conservation and Recovery Act (tracking hazardous waste)) - notification TRI REPORTER (Tracking of toxic chemicals releasing facilities) Business SIC and NAICS classification: ELECTROPLATING, PLATING, POLISHING, ANODIZING, AND COLORING Organizations: GUILD PLATERS, INC. (CONTACT/OPERATOR)
BIG FAMOUS CLEANERS (42-02 30TH AVENUE in ASTORIA, NY)
AIR MINOR (AIRS/AFS) STATE MASTER (New York facility tracking) - AIR PROGRAM Business SIC classification: DRYCLEANING PLANTS, EXCEPT RUG CLEANING Business NAICS classification: DRYCLEANING AND LAUNDRY SERVICES (EXCEPT COIN-OPERATED). Organizations: NEW FAMOUS CLEANERS (LEGALLY RESPONSIBLE PARTY)
IS 10 H. GREELEY SCHOOL ( in LONG ISLAND CITY, NY)
(National Center for Education Statistics) - STATE ID-343000010010 Organizations: NEW YORK CITY PUBLIC SCHOOLS (SCHOOL DISTRICT)
ANDY & GARY SERVICE STATION (38-02 BROADWAY in LONG ISLAND CITY, NY)
CON ED - V 2673 (45-02 31ST ST in LONG ISLAND CITY, NY)
HAZARDOUS WASTE BIENNIAL REPORTER (Resource Conservation and Recovery Act (tracking hazardous waste)) (Resource Conservation and Recovery Act (tracking hazardous waste))
CON ED - V 3549 (43-23 37TH AVE in LONG ISLAND CITY, NY)
HAZARDOUS WASTE BIENNIAL REPORTER (Resource Conservation and Recovery Act (tracking hazardous waste)) (Resource Conservation and Recovery Act (tracking hazardous waste))
CON ED - V2968 (34-01 48TH AVE in LONG ISLAND CITY, NY)
HAZARDOUS WASTE BIENNIAL REPORTER (Resource Conservation and Recovery Act (tracking hazardous waste)) (Resource Conservation and Recovery Act (tracking hazardous waste))
CON ED - VS 7716 (W/S 23RD ST 64' S/O 41 ST AVE in QUEENS, NY)
HAZARDOUS WASTE BIENNIAL REPORTER (Resource Conservation and Recovery Act (tracking hazardous waste)) (Resource Conservation and Recovery Act (tracking hazardous waste))
24-20 46TH ST BUILDING (24-20 46TH ST in LONG ISLAND CITY, NY)
AIR MINOR (AIRS/AFS) Business SIC classification: ELECTRICAL MACHINERY, EQUIPMENT, AND SUPPLIES Alternative names: GILBERT MANUFACTURING COMPANY
ASTORIA AUTO REPAIR INC (40-17 28TH AVE in LONG ISLAND CITY, NY)
(Resource Conservation and Recovery Act (tracking hazardous waste))
A A AUTO BODY (2419 45TH STREET in LONG ISLAND CITY, NY)
Small Quantity Generators, between 100 kg and 1000 kg of hazardous waste/month (Resource Conservation and Recovery Act (tracking hazardous waste)) - notification
Housing units lacking complete plumbing facilities: 2.3% Housing units lacking complete kitchen facilities: 2.9%
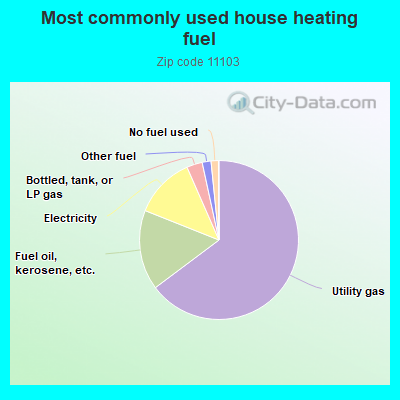
64.9%Utility gas
16.3%Fuel oil, kerosene, etc.
12.4%Electricity
3.2%Bottled, tank, or LP gas
1.8%Other fuel
1.5%No fuel used
Population in 1990: 38,597. Population change in the 1990s: +5,724 (+14.8%).
Place of birth for U.S.-born residents:
This state: 13,535
Northeast: 2,331
Midwest: 1,027
South: 1,902
West: 1,081
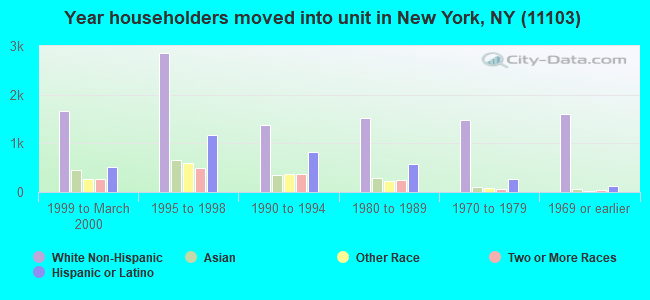
67% of the 11103 zip code residents lived in the same house 5 years ago. Out of people who lived in different houses, 60% lived in this county. Out of people who lived in different counties, 50% lived in New York.
86% of the 11103 zip code residents lived in the same house 1 year ago. Out of people who lived in different houses, 53% moved from this county. Out of people who lived in different houses, 29% moved from different county within same state. Out of people who lived in different houses, 13% moved from different state. Out of people who lived in different houses, 6% moved from abroad.
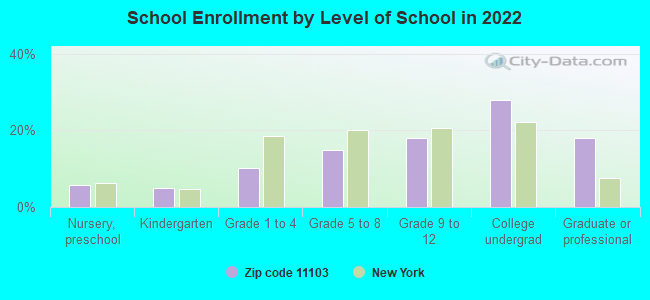
Private vs. public school enrollment:
Students in private schools in grades 1 to 8 (elementary and middle school): 210
Here:
14.3%
New York:
15.6%
Students in private schools in grades 9 to 12 (high school): 189
Here:
17.9%
New York:
15.0%
Students in private undergraduate colleges: 569
Here:
35.0%
New York:
39.2%
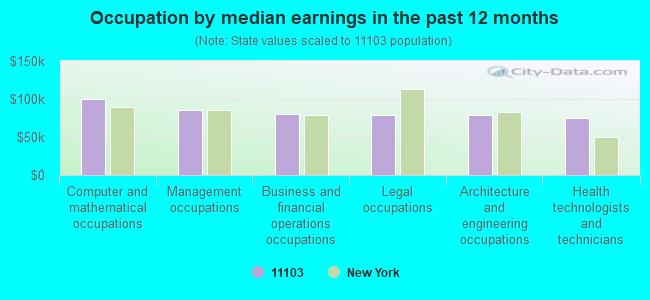
Occupation by median earnings in the past 12 months ($)
100,273Computer and mathematical occupations
86,168Management occupations
80,608Business and financial operations occupations
78,575Legal occupations
78,418Architecture and engineering occupations
74,661Health technologists and technicians
Companies with federal contracts located in this zip code:
VASTECH CONTRACTING CORP (47-20 28 AVE in ASTORIA, NY; small business) : $228,329 in 3 contractsfrom 2003 to 2004
$214,000 with Army for Construction of Structures and Facilities -- Office Buildings. Signed on 2003-09-26. Completion date: 2003-11-14.
$12,904, same as above.Signed on 2004-02-06. Completion date: 2003-11-14.
$1,425, same as above.Signed on 2004-07-01. Completion date: 2003-11-14.
UNIVERSAL TOOL & MACHINE CO (35-10 ASTORIA BLVD in ASTORIA, NY; small business) : $157,084 in 3 contractsin 2001
$59,492 with Defense Logistics Agency for Valves, Nonpowered. Signed on 2001-10-01. Completion date: 2002-01-28.
$59,492, same as above.Signed on 2001-09-30. Completion date: 2002-01-25.
$38,100, same as above.Signed on 2001-04-20. Completion date: 2001-07-22.
THEODOSIOU INC (3214 49TH ST in LONG ISLAND CI, NY) : $10,108 in 2 contractsin 2005
$6,123 with Defense Logistics Agency for Nails, Machine Keys, and Pins. Signed on 2005-01-19. Completion date: 2005-03-21.
$3,985 with Defense Logistics Agency for Hardware, Commercial. Signed on 2005-03-30. Completion date: 2005-11-26.
STANTON TODD D (4505 NEWTOWN RD in ASTORIA, NY; small business)
$5,000 with Army for Other Professional Services. Taking place in VA. Signed on 2005-03-10. Completion date: 2005-03-19.
Top industries in this zip code by the number of employees in 2005:
Health Care and Social Assistance: Home Health Care Services (over 1000 employees: 1 establishment, 1-4 employees: 1 establishment)
Health Care and Social Assistance: Services for the Elderly and Persons with Disabilities (500-999: 1, 5-9: 1, 1-4: 1)
Health Care and Social Assistance: Offices of Physicians (except Mental Health Specialists) (20-49: 5, 10-19: 4, 5-9: 8, 1-4: 23)
2007 - 2018 National Fire Incident Reporting System (NFIRS) incidents
According to the data from the years 2007 - 2018 the average number of fire incidents per year is 116. The highest number of reported fire incidents - 141 took place in 2008, and the least - 83 in 2012. The data has a rising trend.
When looking into fire subcategories, the most reports belonged to: Structure Fires (62.1%), and Outside Fires (25.9%).
Fire incident types reported to NFIRS in Zip Code 11103


 Nearest zip codes: 11102, 11105, 11106, 11104, 11377, 11370.
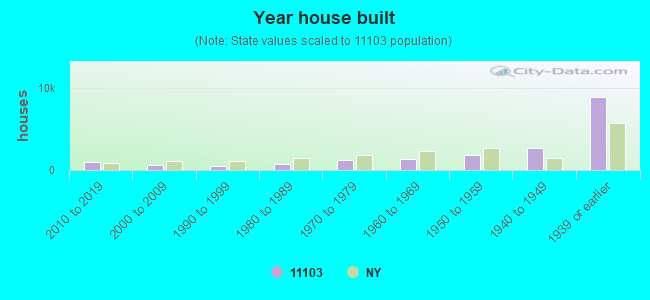


 (Students: 128, Location: 2542 49TH ST, Grades: PK-5)


 According to the data from the years 2007 - 2018 the average number of fire incidents per year is 116. The highest number of reported fire incidents - 141 took place in 2008, and the least - 83 in 2012. The data has a rising trend.
 When looking into fire subcategories, the most reports belonged to: Structure Fires (62.1%), and Outside Fires (25.9%).