Estimated zip code population in 2022: 26,639 Zip code population in 2010: 34,133 Zip code population in 2000: 36,291
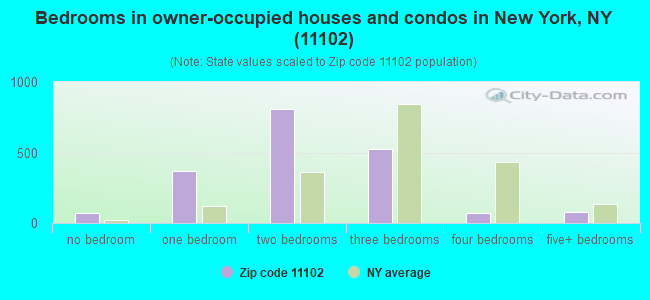
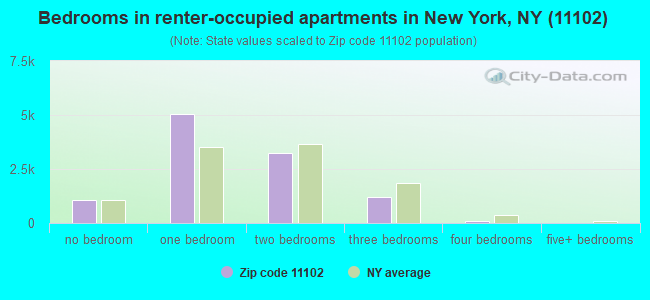
Houses and condos: 19,574 Renter-occupied apartments: 10,579
% of renters here:
85%
State:
46%
March 2022 cost of living index in zip code 11102: 151.3 (very high, U.S. average is 100)
Land area: 0.8 sq. mi. Water area: 0.0 sq. mi.
Population density: 32,978 people per square mile
(very high).
OSM Map
General Map
Google Map
MSN Map
OSM Map
General Map
Google Map
MSN Map
OSM Map
General Map
Google Map
MSN Map
OSM Map
General Map
Google Map
MSN Map
Please wait while loading the map...
Real estate property taxes paid for housing units in 2022:
This zip code:
0.7% ($5,549)
New York:
1.5% ($6,180)
Median real estate property taxes paid for housing units with mortgages in 2022: $4,825 (0.5%) Median real estate property taxes paid for housing units with no mortgage in 2022: $6,369 (0.8%)
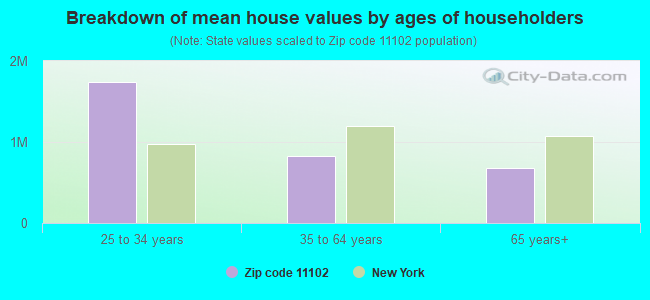
Estimated median house/condo value in 2022: $832,803
11102:
$832,803
New York:
$400,400
According to our research of New York and other state lists, there were 5 registered sex offenders living in 11102 zip code as of April 27, 2024. The ratio of all residents to sex offenders in zip code 11102 is 6,847 to 1. The ratio of registered sex offenders to all residents in this zip code is much lower than the state average.
Median resident age:
This zip code:
36.6 years
New York median age:
40.0 years
Average household size:
This zip code:
2.1 people
New York:
2.5 people
Averages for the 2020 tax year for zip code 11102, filed in 2021:
Average Adjusted Gross Income (AGI) in 2020: $62,216 (Individual Income Tax Returns)
Here:
$62,216
State:
$90,930
Salary/wage: $63,386 (reported on 80.1% of returns)
Here:
$63,386
State:
$72,104
(% of AGI for various income ranges: 890.6% for AGIs below $25k, 3380.1% for AGIs $25k-50k, 6953.2% for AGIs $50k-75k, 11141.3% for AGIs $75k-100k, 19326.1% for AGIs $100k-200k, 78105.7% for AGIs over 200k)
Taxable interest for individuals: $1,177 (reported on 24.1% of returns)
This zip code:
$1,177
New York:
$3,075
(% of AGI for various income ranges: 13.2% for AGIs below $25k, 13.1% for AGIs $25k-50k, 17.6% for AGIs $50k-75k, 42.9% for AGIs $75k-100k, 62.9% for AGIs $100k-200k, 1065.7% for AGIs over 200k)
Ordinary dividends: $2,660 (reported on 17.6% of returns)
Here:
$2,660
State:
$11,095
(% of AGI for various income ranges: 12.3% for AGIs below $25k, 21.4% for AGIs $25k-50k, 31.8% for AGIs $50k-75k, 58.6% for AGIs $75k-100k, 128.7% for AGIs $100k-200k, 1772.6% for AGIs over 200k)
Net capital gain/loss in AGI: +$8,865 (reported on 17.2% of returns)
Here:
+$8,865
State:
+$44,925
(% of AGI for various income ranges: 13.8% for AGIs below $25k, 23.4% for AGIs $25k-50k, 45.4% for AGIs $50k-75k, 106.7% for AGIs $75k-100k, 304.7% for AGIs $100k-200k, 8902.6% for AGIs over 200k)
Profit/loss from business: +$8,860 (reported on 22.7% of returns)
Here:
+$8,860
State:
+$14,940
(% of AGI for various income ranges: 347.5% for AGIs below $25k, 232.2% for AGIs $25k-50k, 145.6% for AGIs $50k-75k, 227.2% for AGIs $75k-100k, 385.2% for AGIs $100k-200k, 2015.2% for AGIs over 200k)
Taxable individual retirement arrangement distribution: $12,054 (reported on 3.0% of returns)
11102:
$12,054
New York:
$19,609
(% of AGI for various income ranges: 25.4% for AGIs below $25k, 28.3% for AGIs $25k-50k, 38.8% for AGIs $50k-75k, 80.5% for AGIs $75k-100k, 128.0% for AGIs $100k-200k, 408.3% for AGIs over 200k)
Self-employed (Keogh) retirement plans: $16,129 (reported on 0.4% of returns)
11102:
$16,129
New York:
$32,497
(% of AGI for various income ranges: 31.0% for AGIs $75k-100k, 297.8% for AGIs over 200k)
Total itemized deductions: $28,172 (reported on 4.5% of returns)
Here:
$28,172
State:
$39,326
(% of AGI for various income ranges: 21.3% for AGIs below $25k, 53.5% for AGIs $25k-50k, 103.0% for AGIs $50k-75k, 197.6% for AGIs $75k-100k, 499.5% for AGIs $100k-200k, 3556.1% for AGIs over 200k)
Charity contributions: $5,735 (reported on 3.6% of returns)
Here:
$5,735
State:
$15,420
(% of AGI for various income ranges: 5.2% for AGIs $25k-50k, 12.4% for AGIs $50k-75k, 40.8% for AGIs $75k-100k, 87.8% for AGIs $100k-200k, 619.6% for AGIs over 200k)
Taxes paid: $8,566 (reported on 4.5% of returns)
11102:
$8,566
State:
$9,183
(% of AGI for various income ranges: 4.1% for AGIs below $25k, 13.8% for AGIs $25k-50k, 30.1% for AGIs $50k-75k, 75.0% for AGIs $75k-100k, 193.6% for AGIs $100k-200k, 776.1% for AGIs over 200k)
Earned income credit: $1,922 (reported on 14.4% of returns)
Here:
$1,922
State:
$2,138
(% of AGI for various income ranges: 91.4% for AGIs below $25k, 55.8% for AGIs $25k-50k)
Percentage of individuals using paid preparers for their 2020 taxes: 94.7%
Here:
95%
State:
95%
(% for various income ranges: 91.6% for AGIs below $25k, 96.0% for AGIs $25k-50k, 96.6% for AGIs $50k-75k, 97.1% for AGIs $75k-100k, 95.8% for AGIs $100k-200k, 94.4% for AGIs over 200k)
Averages for the 2012 tax year for zip code 11102, filed in 2013:
Average Adjusted Gross Income (AGI) in 2012: $44,049 (Individual Income Tax Returns)
Here:
$44,049
State:
$77,088
Salary/wage: $46,130 (reported on 81.7% of returns)
Here:
$46,130
State:
$60,593
(% of AGI for various income ranges: 65.9% for AGIs below $25k, 90.1% for AGIs $25k-50k, 91.9% for AGIs $50k-75k, 90.5% for AGIs $75k-100k, 89.2% for AGIs $100k-200k, 67.7% for AGIs over 200k)
Taxable interest for individuals: $742 (reported on 25.5% of returns)
This zip code:
$742
New York:
$3,125
(% of AGI for various income ranges: 0.6% for AGIs below $25k, 0.3% for AGIs $25k-50k, 0.3% for AGIs $50k-75k, 0.3% for AGIs $75k-100k, 0.5% for AGIs $100k-200k, 0.7% for AGIs over 200k)
Ordinary dividends: $2,890 (reported on 11.4% of returns)
Here:
$2,890
State:
$10,299
(% of AGI for various income ranges: 0.6% for AGIs below $25k, 0.3% for AGIs $25k-50k, 0.4% for AGIs $50k-75k, 0.4% for AGIs $75k-100k, 0.9% for AGIs $100k-200k, 3.0% for AGIs over 200k)
Net capital gain/loss in AGI: +$5,488 (reported on 8.9% of returns)
Here:
+$5,488
State:
+$42,474
(% of AGI for various income ranges: 0.1% for AGIs $50k-75k, 0.3% for AGIs $75k-100k, 0.6% for AGIs $100k-200k, 10.6% for AGIs over 200k)
Profit/loss from business: +$10,006 (reported on 23.7% of returns)
Here:
+$10,006
State:
+$16,168
(% of AGI for various income ranges: 24.1% for AGIs below $25k, 4.6% for AGIs $25k-50k, 2.1% for AGIs $50k-75k, 1.9% for AGIs $75k-100k, 2.5% for AGIs $100k-200k, 2.8% for AGIs over 200k)
Taxable individual retirement arrangement distribution: $10,516 (reported on 3.3% of returns)
11102:
$10,516
New York:
$17,621
(% of AGI for various income ranges: 1.2% for AGIs below $25k, 0.7% for AGIs $25k-50k, 0.6% for AGIs $50k-75k, 0.8% for AGIs $75k-100k, 1.1% for AGIs $100k-200k)
Self-employment retirement plans: $15,150 (reported on 0.2% of returns)
11102:
$15,150
New York:
$27,330
Total itemized deductions: $17,747 (20% of AGI, reported on 24.8% of returns)
Here:
$17,747
State:
$34,985
Here:
19.7% of AGI
State:
21.3% of AGI
(% of AGI for various income ranges: 3.4% for AGIs below $25k, 7.3% for AGIs $25k-50k, 8.5% for AGIs $50k-75k, 12.3% for AGIs $75k-100k, 14.2% for AGIs $100k-200k, 14.4% for AGIs over 200k)
Charity contributions: $2,151 (reported on 19.2% of returns)
Here:
$2,151
State:
$5,572
(% of AGI for various income ranges: 0.3% for AGIs below $25k, 0.7% for AGIs $25k-50k, 0.9% for AGIs $50k-75k, 1.2% for AGIs $75k-100k, 1.3% for AGIs $100k-200k, 1.0% for AGIs over 200k)
Taxes paid: $8,884 (reported on 24.8% of returns)
11102:
$8,884
State:
$18,656
(% of AGI for various income ranges: 0.6% for AGIs below $25k, 1.7% for AGIs $25k-50k, 3.7% for AGIs $50k-75k, 6.6% for AGIs $75k-100k, 8.6% for AGIs $100k-200k, 10.1% for AGIs over 200k)
Earned income credit: $2,089 (reported on 21.4% of returns)
Here:
$2,089
State:
$2,230
(% of AGI for various income ranges: 7.3% for AGIs below $25k, 0.7% for AGIs $25k-50k)
Percentage of individuals using paid preparers for their 2012 taxes: 63.6%
Here:
64%
State:
66%
(% for various income ranges: 67.9% for AGIs below $25k, 60.1% for AGIs $25k-50k, 57.3% for AGIs $50k-75k, 61.4% for AGIs $75k-100k, 64.1% for AGIs $100k-200k, 75.0% for AGIs over 200k)
Averages for the 2004 tax year for zip code 11102, filed in 2005:
Average Adjusted Gross Income (AGI) in 2004: $32,980 (Individual Income Tax Returns)
Here:
$32,980
State:
$59,519
Salary/wage: $34,958 (reported on 81.7% of returns)
Here:
$34,958
State:
$50,673
(% of AGI for various income ranges: 72.1% for AGIs below $10k, 76.1% for AGIs $10k-25k, 92.1% for AGIs $25k-50k, 91.4% for AGIs $50k-75k, 90.8% for AGIs $75k-100k, 78.7% for AGIs over 100k)
Taxable interest for individuals: $984 (reported on 36.1% of returns)
This zip code:
$984
New York:
$2,377
(% of AGI for various income ranges: 3.7% for AGIs below $10k, 1.2% for AGIs $10k-25k, 0.7% for AGIs $25k-50k, 0.8% for AGIs $50k-75k, 1.1% for AGIs $75k-100k, 1.5% for AGIs over 100k)
Taxable dividends: $1,682 (reported on 12.8% of returns)
Here:
$1,682
State:
$5,394
(% of AGI for various income ranges: 1.4% for AGIs below $10k, 0.6% for AGIs $10k-25k, 0.4% for AGIs $25k-50k, 0.5% for AGIs $50k-75k, 0.5% for AGIs $75k-100k, 1.3% for AGIs over 100k)
Net capital gain/loss: +$3,239 (reported on 10.1% of returns)
Here:
+$3,239
State:
+$23,581
(% of AGI for various income ranges: -0.6% for AGIs below $10k, -0.1% for AGIs $10k-25k, 0.0% for AGIs $25k-50k, 0.2% for AGIs $50k-75k, 0.4% for AGIs $75k-100k, 5.3% for AGIs over 100k)
Profit/loss from business: +$7,836 (reported on 21.7% of returns)
Here:
+$7,836
State:
+$13,809
(% of AGI for various income ranges: 36.2% for AGIs below $10k, 14.9% for AGIs $10k-25k, 2.7% for AGIs $25k-50k, 1.1% for AGIs $50k-75k, 1.9% for AGIs $75k-100k, 3.3% for AGIs over 100k)
IRA payment deduction: $2,831 (reported on 2.6% of returns)
11102:
$2,831
New York:
$3,115
(% of AGI for various income ranges: 0.2% for AGIs below $10k, 0.2% for AGIs $10k-25k, 0.3% for AGIs $25k-50k, 0.2% for AGIs $50k-75k, 0.2% for AGIs $75k-100k, 0.1% for AGIs over 100k)
Self-employed pension: $10,057 (reported on 0.2% of returns)
Here:
$10,057
New York:
$19,016
Total itemized deductions: $15,099 (24% of AGI, reported on 26.4% of returns)
Here:
$15,099
State:
$25,864
Here:
24.3% of AGI
State:
21.9% of AGI
(% of AGI for various income ranges: 3.9% for AGIs below $10k, 7.1% for AGIs $10k-25k, 10.7% for AGIs $25k-50k, 13.5% for AGIs $50k-75k, 15.1% for AGIs $75k-100k, 16.3% for AGIs over 100k)
Charity contributions deductions: $2,323 (4% of AGI, reported on 23.2% of returns)
Here:
$2,323
State:
$4,439
Here:
3.6% of AGI
State:
3.6% of AGI
(% of AGI for various income ranges: 0.2% for AGIs below $10k, 0.7% for AGIs $10k-25k, 1.6% for AGIs $25k-50k, 2.1% for AGIs $50k-75k, 2.0% for AGIs $75k-100k, 1.9% for AGIs over 100k)
Total tax: $4,462 (reported on 75.8% of returns)
11102:
$4,462
State:
$11,730
(% of AGI for various income ranges: 6.1% for AGIs below $10k, 5.1% for AGIs $10k-25k, 7.8% for AGIs $25k-50k, 11.3% for AGIs $50k-75k, 12.7% for AGIs $75k-100k, 16.9% for AGIs over 100k)
Earned income credit: $1,697 (reported on 22.3% of returns)
Here:
$1,697
State:
$1,757
Percentage of individuals using paid preparers for their 2004 taxes: 70.0%
Here:
70%
State:
67%
(% for various income ranges: 67.3% for AGIs below $10k, 73.9% for AGIs $10k-25k, 67.8% for AGIs $25k-50k, 67.2% for AGIs $50k-75k, 73.7% for AGIs $75k-100k, 77.2% for AGIs over 100k)
Likely homosexual households (counted as self-reported same-sex unmarried-partner households)
Lesbian couples: 0.1% of all households
Gay men: 0.4% of all households
Household received Food Stamps/SNAP in the past 12 months: 1,714 Household did not receive Food Stamps/SNAP in the past 12 months: 10,685
Women who had a birth in the past 12 months: 333 (304 now married, 25 unmarried) Women who did not have a birth in the past 12 months: 7,765 (2,654 now married, 5,119 unmarried)
Housing units in zip code 11102 with a mortgage: 715 (28 second mortgage, 19 both second mortgage and home equity loan) Houses without a mortgage: 51
Median monthly owner costs for units with a mortgage: $3,144 Median monthly owner costs for units without a mortgage: $1,170
Residents with income below the poverty level in 2022:
This zip code:
15.1%
Whole state:
14.3%
Residents with income below 50% of the poverty level in 2022:
This zip code:
7.0%
Whole state:
6.8%
Median number of rooms in houses and condos:
Here:
4.1
State:
6.3
Median number of rooms in apartments:
Here:
3.2
State:
3.8
Notable locations in this zip code not listed on our city pages
Notable locations in zip code 11102: Astoria Square (A), Bohemian Hall (B), Astoria Branch Queens Borough Public Library (C), Fire Department New York Engine 262 Decontamination Unit 2 (D), New York Decontamination Company 2 (E), Elm Towers (F). Display/hide their locations on the map
Churches in zip code 11102 include: Yugoslavian Seventh Day Adventist Church (A), Taiwan Union Christian Church (B), Saint Demetrios Greek Orthodox Church (C), Saint George's Church (D), Good Shepherd United Methodist Church (E), Episcopal Church of the Redeemer (F), Our Lady of Mount Carmel Roman Catholic Church (G), First Reformed Church of Astoria (H), Good Church of Deliverance Pentecostal (I). Display/hide their locations on the map
Parks in zip code 11102 include: Astoria Play Center and Swimming Pool (1), Columbus Triangle (2), Chappetto Square (3), Hoyt Playground (4), Athens Square (5), Van Alst Playground (6), Goodwill Park (7), Hallets Cove Playground (8), Hellgate Field (9). Display/hide their locations on the map
Tourist attraction (not listed on the city page) : Pharos Travel Services Inc (Tourism Consultants; 30-19 30th St).
2,305 married couples with children.
633 single-parent households (48 men, 585 women).
53.5% of residents of 11102 zip code speak English at home.
19.6% of residents speak Spanish at home (52% very well, 27% well, 17% not well, 4% not at all).
18.3% of residents speak other Indo-European language at home (60% very well, 27% well, 11% not well, 2% not at all).
4.8% of residents speak Asian or Pacific Island language at home (71% very well, 18% well, 9% not well, 3% not at all).
3.3% of residents speak other language at home (69% very well, 29% well, 2% not well).
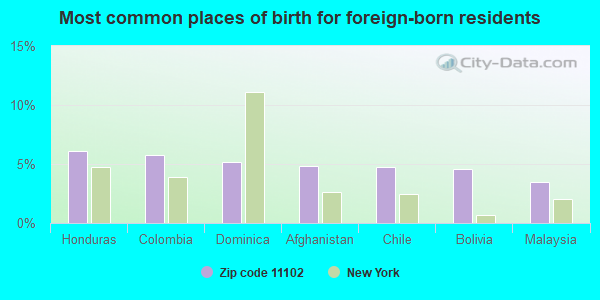
Foreign born population: 9,241 (34.7%) (60.8% of them are naturalized citizens)
This zip code:
34.7%
Whole state:
22.7%
6%Honduras
6%Colombia
5%Dominica
5%Afghanistan
5%Chile
5%Bolivia
3%Malaysia
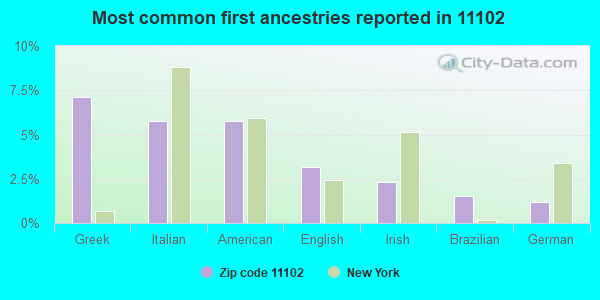
7%Greek
6%Italian
6%American
3%English
2%Irish
2%Brazilian
1%German
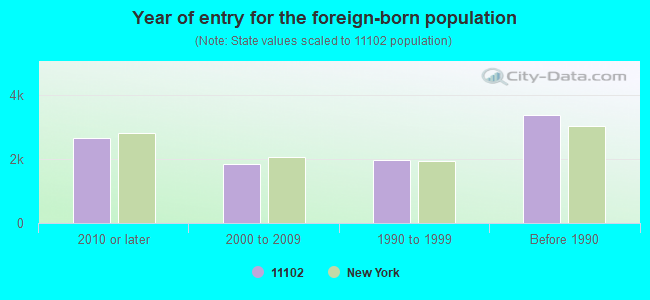
Year of entry for the foreign-born population
2,6612010 or later
1,8292000 to 2009
1,9581990 to 1999
3,362Before 1990
Private high school in in this zip code not listed on the city page:
ST DEMETRIOS SCHOOL (Students: 610, Location: 3003 30TH DR, Grades: PK-12)
Public elementary/middle schools in in zip code 11102 not listed on the city page:
30TH AVENUE SCHOOL (THE) (Location: 28-37 29TH ST, Grades: KG-6)
Facilities with environmental interests located in this zip code:
J C CLEANERS (2701 24TH AVENUE in LONG ISLAND CITY, NY)
AIR MINOR (AIRS/AFS) STATE MASTER (New York facility tracking) - AIR PROGRAM Conditionally Exempt Small Quantity Generators, less than 100 kg/month of hazardous waste (Resource Conservation and Recovery Act (tracking hazardous waste)) - notification Business SIC classification: DRYCLEANING PLANTS, EXCEPT RUG CLEANING Business NAICS classification: DRYCLEANING AND LAUNDRY SERVICES (EXCEPT COIN-OPERATED). Organizations: JACK CHUNG (CONTACT/OWNER)
, 27 J C CLEANERS INC (LEGALLY RESPONSIBLE PARTY)
CHIC CLEANERS (30-05 30TH AVE in ASTORIA, NY)
AIR MINOR (AIRS/AFS) STATE MASTER (New York facility tracking) - AIR PROGRAM, HAZARDOUS WASTE PROGRAM (Resource Conservation and Recovery Act (tracking hazardous waste)) Business SIC classification: DRYCLEANING PLANTS, EXCEPT RUG CLEANING Business NAICS classification: DRYCLEANING AND LAUNDRY SERVICES (EXCEPT COIN-OPERATED).
GGK CORP-ASTORIA (30-75 21ST STREET in ASTORIA, NY)
AIR MINOR (AIRS/AFS) (Resource Conservation and Recovery Act (tracking hazardous waste)) Business SIC classification: GASOLINE SERVICE STATIONS Alternative names: GGK CORPORATION SERVICE STATION, SUNOCO SERVICE STATION
CON ED - VS 4619 (26 AVE N 253 E 4TH ST in ASTORIA, NY)
HAZARDOUS WASTE BIENNIAL REPORTER (Resource Conservation and Recovery Act (tracking hazardous waste)) (Resource Conservation and Recovery Act (tracking hazardous waste))
CON ED MH 15521 (27TH AVE 8TH AND 9TH ST in QUEENS, NY)
HAZARDOUS WASTE BIENNIAL REPORTER (Resource Conservation and Recovery Act (tracking hazardous waste)) (Resource Conservation and Recovery Act (tracking hazardous waste))
GREATER PUNJAB PETROLEUM CORP (31-02 ASTORIA BLVD in ASTORIA, NY)
(Resource Conservation and Recovery Act (tracking hazardous waste))
HENRY G DIETZ CO INC THE (14-26 28TH AVE in LONG ISLAND CITY, NY)
(Resource Conservation and Recovery Act (tracking hazardous waste))
CROSS COUNTY FEDERAL SAVINGS (1807-15 38TH ST in ASTORIA, NY)
(Resource Conservation and Recovery Act (tracking hazardous waste))
CRYSTAL CLEANERS (31-05 24TH AVE in ASTORIA, NY)
(Resource Conservation and Recovery Act (tracking hazardous waste))
100 CENTER STREET PRODUCTIONS (2-15 26TH AVE in LONG ISLAND CITY, NY)
Small Quantity Generators, between 100 kg and 1000 kg of hazardous waste/month (Resource Conservation and Recovery Act (tracking hazardous waste)) - notification Organizations: 100 CENTER STREET PRODUCTIONS (CONTACT/OWNER)
A.S.K CONSTRUCTION, INC. (26-10 21ST STREET in ASTORIA, NY)
ENFORCEMENT/COMPLIANCE ACTIVITY (Integrated Compliance Information System) COMPLIANCE ACTIVITY (Tracking inspections of insecticide, fungicide, and rodenticide, and toxic substances) Business SIC classification: BUSINESS SERVICES
Housing units lacking complete plumbing facilities: 5.1% Housing units lacking complete kitchen facilities: 5.6%
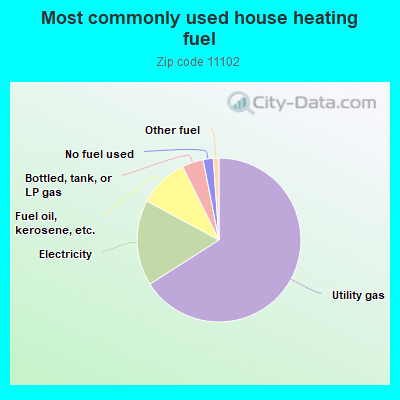
65.9%Utility gas
16.9%Electricity
9.8%Fuel oil, kerosene, etc.
4.2%Bottled, tank, or LP gas
2.0%No fuel used
1.1%Other fuel
Population in 1990: 30,078. Population change in the 1990s: +6,213 (+20.7%).
Place of birth for U.S.-born residents:
This state: 11,563
Northeast: 1,801
Midwest: 856
South: 1,353
West: 1,344
62% of the 11102 zip code residents lived in the same house 5 years ago. Out of people who lived in different houses, 54% lived in this county. Out of people who lived in different counties, 50% lived in New York.
88% of the 11102 zip code residents lived in the same house 1 year ago. Out of people who lived in different houses, 51% moved from this county. Out of people who lived in different houses, 29% moved from different county within same state. Out of people who lived in different houses, 13% moved from different state. Out of people who lived in different houses, 8% moved from abroad.
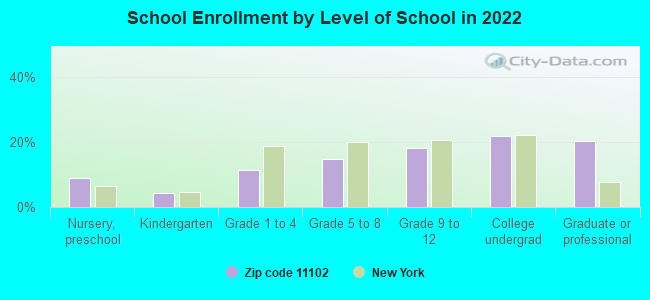
Private vs. public school enrollment:
Students in private schools in grades 1 to 8 (elementary and middle school): 96
Here:
7.6%
New York:
15.6%
Students in private schools in grades 9 to 12 (high school): 75
Here:
8.7%
New York:
15.0%
Students in private undergraduate colleges: 169
Here:
16.2%
New York:
39.2%
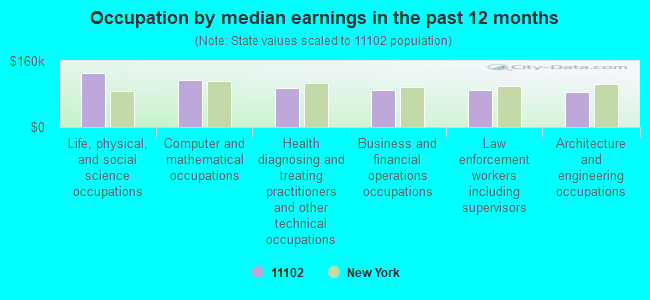
Occupation by median earnings in the past 12 months ($)
130,528Life, physical, and social science occupations
114,383Computer and mathematical occupations
95,177Health diagnosing and treating practitioners and other technical occupations
90,784Business and financial operations occupations
89,665Law enforcement workers including supervisors
84,335Architecture and engineering occupations
Top industries in this zip code by the number of employees in 2005:
Health Care and Social Assistance: General Medical and Surgical Hospitals (over 1000 employees: 1 establishment)
Management of Companies and Enterprises: Corporate, Subsidiary, and Regional Managing Offices (500-999: 1, 100-249: 1, 5-9: 1)
Health Care and Social Assistance: Nursing Care Facilities (250-499: 1)
2007 - 2018 National Fire Incident Reporting System (NFIRS) incidents
Based on the data from the years 2007 - 2018 the average number of fires per year is 108. The highest number of fires - 124 took place in 2015, and the least - 75 in 2007. The data has a growing trend.
When looking into fire subcategories, the most incidents belonged to: Structure Fires (66.0%), and Outside Fires (20.8%).
Fire incident types reported to NFIRS in Zip Code 11102


 Nearest zip codes: 11106, 11103, 11105, 10035, 10162, 10128.


 (Students: 610, Location: 3003 30TH DR, Grades: PK-12)

 Based on the data from the years 2007 - 2018 the average number of fires per year is 108. The highest number of fires - 124 took place in 2015, and the least - 75 in 2007. The data has a growing trend.
 When looking into fire subcategories, the most incidents belonged to: Structure Fires (66.0%), and Outside Fires (20.8%).