Estimated zip code population in 2022: 39,560 Zip code population in 2010: 38,875 Zip code population in 2000: 43,130
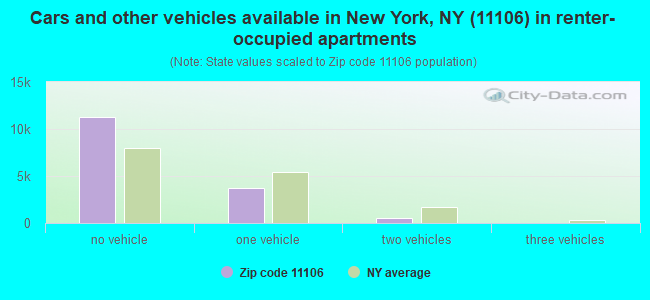
Houses and condos: 21,638 Renter-occupied apartments: 15,548
% of renters here:
82%
State:
46%
March 2022 cost of living index in zip code 11106: 151.0 (very high, U.S. average is 100)
Land area: 0.9 sq. mi. Water area: 0.0 sq. mi.
Population density: 46,158 people per square mile
(very high).
OSM Map
General Map
Google Map
MSN Map
OSM Map
General Map
Google Map
MSN Map
OSM Map
General Map
Google Map
MSN Map
OSM Map
General Map
Google Map
MSN Map
Please wait while loading the map...
Real estate property taxes paid for housing units in 2022:
This zip code:
0.8% ($5,659)
New York:
1.5% ($6,180)
Median real estate property taxes paid for housing units with mortgages in 2022: $6,069 (0.8%) Median real estate property taxes paid for housing units with no mortgage in 2022: $5,221 (0.9%)
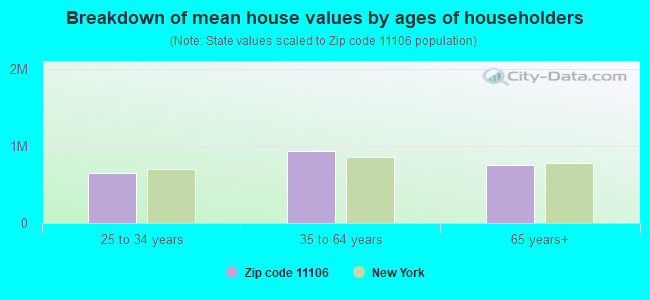
Estimated median house/condo value in 2022: $690,823
11106:
$690,823
New York:
$400,400
According to our research of New York and other state lists, there were 7 registered sex offenders living in 11106 zip code as of April 27, 2024. The ratio of all residents to sex offenders in zip code 11106 is 5,711 to 1. The ratio of registered sex offenders to all residents in this zip code is much lower than the state average.
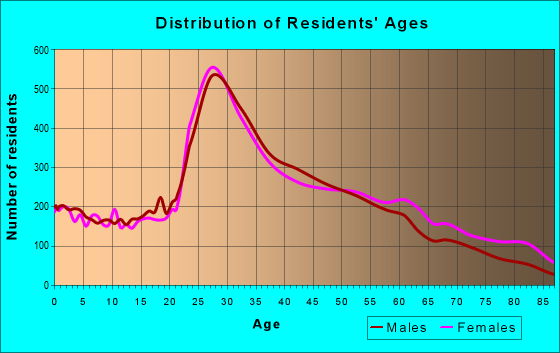
Median resident age:
This zip code:
36.9 years
New York median age:
40.0 years
Average household size:
This zip code:
2.1 people
New York:
2.5 people
Averages for the 2020 tax year for zip code 11106, filed in 2021:
Average Adjusted Gross Income (AGI) in 2020: $62,430 (Individual Income Tax Returns)
Here:
$62,430
State:
$90,930
Salary/wage: $62,003 (reported on 79.8% of returns)
Here:
$62,003
State:
$72,104
(% of AGI for various income ranges: 914.5% for AGIs below $25k, 3345.4% for AGIs $25k-50k, 6958.4% for AGIs $50k-75k, 11022.4% for AGIs $75k-100k, 19643.6% for AGIs $100k-200k, 89483.5% for AGIs over 200k)
Taxable interest for individuals: $1,206 (reported on 27.1% of returns)
This zip code:
$1,206
New York:
$3,075
(% of AGI for various income ranges: 17.6% for AGIs below $25k, 17.3% for AGIs $25k-50k, 29.1% for AGIs $50k-75k, 44.8% for AGIs $75k-100k, 103.5% for AGIs $100k-200k, 1050.9% for AGIs over 200k)
Ordinary dividends: $2,789 (reported on 18.2% of returns)
Here:
$2,789
State:
$11,095
(% of AGI for various income ranges: 13.7% for AGIs below $25k, 24.1% for AGIs $25k-50k, 47.9% for AGIs $50k-75k, 80.4% for AGIs $75k-100k, 176.6% for AGIs $100k-200k, 1716.1% for AGIs over 200k)
Net capital gain/loss in AGI: +$8,923 (reported on 17.8% of returns)
Here:
+$8,923
State:
+$44,925
(% of AGI for various income ranges: 7.8% for AGIs below $25k, 22.7% for AGIs $25k-50k, 55.1% for AGIs $50k-75k, 113.4% for AGIs $75k-100k, 401.1% for AGIs $100k-200k, 10152.6% for AGIs over 200k)
Profit/loss from business: +$9,221 (reported on 22.4% of returns)
Here:
+$9,221
State:
+$14,940
(% of AGI for various income ranges: 316.6% for AGIs below $25k, 238.3% for AGIs $25k-50k, 173.8% for AGIs $50k-75k, 235.0% for AGIs $75k-100k, 395.4% for AGIs $100k-200k, 3024.8% for AGIs over 200k)
Taxable individual retirement arrangement distribution: $12,868 (reported on 3.5% of returns)
11106:
$12,868
New York:
$19,609
(% of AGI for various income ranges: 32.0% for AGIs below $25k, 28.0% for AGIs $25k-50k, 54.9% for AGIs $50k-75k, 72.0% for AGIs $75k-100k, 162.6% for AGIs $100k-200k, 787.8% for AGIs over 200k)
Self-employed (Keogh) retirement plans: $16,270 (reported on 0.5% of returns)
11106:
$16,270
New York:
$32,497
(% of AGI for various income ranges: 13.1% for AGIs $50k-75k, 26.9% for AGIs $100k-200k, 341.7% for AGIs over 200k)
Total itemized deductions: $25,045 (reported on 4.6% of returns)
Here:
$25,045
State:
$39,326
(% of AGI for various income ranges: 19.4% for AGIs below $25k, 58.1% for AGIs $25k-50k, 104.8% for AGIs $50k-75k, 222.0% for AGIs $75k-100k, 546.5% for AGIs $100k-200k, 2721.7% for AGIs over 200k)
Charity contributions: $5,638 (reported on 3.7% of returns)
Here:
$5,638
State:
$15,420
(% of AGI for various income ranges: 1.3% for AGIs below $25k, 6.7% for AGIs $25k-50k, 15.7% for AGIs $50k-75k, 38.4% for AGIs $75k-100k, 109.8% for AGIs $100k-200k, 563.5% for AGIs over 200k)
Taxes paid: $8,403 (reported on 4.6% of returns)
11106:
$8,403
State:
$9,183
(% of AGI for various income ranges: 4.2% for AGIs below $25k, 14.0% for AGIs $25k-50k, 33.3% for AGIs $50k-75k, 82.5% for AGIs $75k-100k, 211.9% for AGIs $100k-200k, 801.7% for AGIs over 200k)
Earned income credit: $1,823 (reported on 14.9% of returns)
Here:
$1,823
State:
$2,138
(% of AGI for various income ranges: 87.2% for AGIs below $25k, 56.9% for AGIs $25k-50k)
Percentage of individuals using paid preparers for their 2020 taxes: 94.3%
Here:
94%
State:
95%
(% for various income ranges: 91.4% for AGIs below $25k, 95.0% for AGIs $25k-50k, 95.8% for AGIs $50k-75k, 96.0% for AGIs $75k-100k, 96.2% for AGIs $100k-200k, 97.5% for AGIs over 200k)
Averages for the 2012 tax year for zip code 11106, filed in 2013:
Average Adjusted Gross Income (AGI) in 2012: $44,886 (Individual Income Tax Returns)
Here:
$44,886
State:
$77,088
Salary/wage: $46,689 (reported on 80.8% of returns)
Here:
$46,689
State:
$60,593
(% of AGI for various income ranges: 63.4% for AGIs below $25k, 87.7% for AGIs $25k-50k, 90.5% for AGIs $50k-75k, 89.2% for AGIs $75k-100k, 86.6% for AGIs $100k-200k, 69.6% for AGIs over 200k)
Taxable interest for individuals: $812 (reported on 28.5% of returns)
This zip code:
$812
New York:
$3,125
(% of AGI for various income ranges: 0.9% for AGIs below $25k, 0.5% for AGIs $25k-50k, 0.4% for AGIs $50k-75k, 0.4% for AGIs $75k-100k, 0.5% for AGIs $100k-200k, 0.6% for AGIs over 200k)
Ordinary dividends: $2,231 (reported on 13.7% of returns)
Here:
$2,231
State:
$10,299
(% of AGI for various income ranges: 0.9% for AGIs below $25k, 0.6% for AGIs $25k-50k, 0.6% for AGIs $50k-75k, 0.6% for AGIs $75k-100k, 0.6% for AGIs $100k-200k, 1.3% for AGIs over 200k)
Net capital gain/loss in AGI: +$2,588 (reported on 10.3% of returns)
Here:
+$2,588
State:
+$42,474
(% of AGI for various income ranges: 0.2% for AGIs $50k-75k, 0.3% for AGIs $75k-100k, 0.7% for AGIs $100k-200k, 4.8% for AGIs over 200k)
Profit/loss from business: +$9,731 (reported on 23.8% of returns)
Here:
+$9,731
State:
+$16,168
(% of AGI for various income ranges: 24.9% for AGIs below $25k, 4.7% for AGIs $25k-50k, 1.8% for AGIs $50k-75k, 1.9% for AGIs $75k-100k, 2.2% for AGIs $100k-200k, 2.8% for AGIs over 200k)
Taxable individual retirement arrangement distribution: $10,837 (reported on 4.3% of returns)
11106:
$10,837
New York:
$17,621
(% of AGI for various income ranges: 1.4% for AGIs below $25k, 0.8% for AGIs $25k-50k, 0.7% for AGIs $50k-75k, 0.7% for AGIs $75k-100k, 1.2% for AGIs $100k-200k, 2.1% for AGIs over 200k)
Self-employment retirement plans: $11,100 (reported on 0.3% of returns)
11106:
$11,100
New York:
$27,330
Total itemized deductions: $17,437 (20% of AGI, reported on 26.4% of returns)
Here:
$17,437
State:
$34,985
Here:
19.7% of AGI
State:
21.3% of AGI
(% of AGI for various income ranges: 4.7% for AGIs below $25k, 6.4% for AGIs $25k-50k, 9.8% for AGIs $50k-75k, 12.9% for AGIs $75k-100k, 13.8% for AGIs $100k-200k, 14.2% for AGIs over 200k)
Charity contributions: $2,205 (reported on 20.6% of returns)
Here:
$2,205
State:
$5,572
(% of AGI for various income ranges: 0.4% for AGIs below $25k, 0.8% for AGIs $25k-50k, 1.1% for AGIs $50k-75k, 1.2% for AGIs $75k-100k, 1.3% for AGIs $100k-200k, 1.0% for AGIs over 200k)
Taxes paid: $8,657 (reported on 26.3% of returns)
11106:
$8,657
State:
$18,656
(% of AGI for various income ranges: 1.0% for AGIs below $25k, 1.7% for AGIs $25k-50k, 4.2% for AGIs $50k-75k, 6.9% for AGIs $75k-100k, 8.2% for AGIs $100k-200k, 9.8% for AGIs over 200k)
Earned income credit: $1,920 (reported on 20.3% of returns)
Here:
$1,920
State:
$2,230
(% of AGI for various income ranges: 6.5% for AGIs below $25k, 0.7% for AGIs $25k-50k)
Percentage of individuals using paid preparers for their 2012 taxes: 64.4%
Here:
64%
State:
66%
(% for various income ranges: 67.9% for AGIs below $25k, 61.5% for AGIs $25k-50k, 58.9% for AGIs $50k-75k, 63.4% for AGIs $75k-100k, 67.5% for AGIs $100k-200k, 72.0% for AGIs over 200k)
Averages for the 2004 tax year for zip code 11106, filed in 2005:
Average Adjusted Gross Income (AGI) in 2004: $33,999 (Individual Income Tax Returns)
Here:
$33,999
State:
$59,519
Salary/wage: $35,626 (reported on 81.2% of returns)
Here:
$35,626
State:
$50,673
(% of AGI for various income ranges: 90.7% for AGIs below $10k, 72.7% for AGIs $10k-25k, 91.2% for AGIs $25k-50k, 89.9% for AGIs $50k-75k, 87.1% for AGIs $75k-100k, 74.9% for AGIs over 100k)
Taxable interest for individuals: $1,194 (reported on 39.7% of returns)
This zip code:
$1,194
New York:
$2,377
(% of AGI for various income ranges: 6.4% for AGIs below $10k, 2.2% for AGIs $10k-25k, 0.9% for AGIs $25k-50k, 1.1% for AGIs $50k-75k, 1.3% for AGIs $75k-100k, 1.5% for AGIs over 100k)
Taxable dividends: $1,794 (reported on 14.9% of returns)
Here:
$1,794
State:
$5,394
(% of AGI for various income ranges: 2.2% for AGIs below $10k, 0.8% for AGIs $10k-25k, 0.5% for AGIs $25k-50k, 0.7% for AGIs $50k-75k, 0.7% for AGIs $75k-100k, 1.3% for AGIs over 100k)
Net capital gain/loss: +$3,163 (reported on 11.4% of returns)
Here:
+$3,163
State:
+$23,581
(% of AGI for various income ranges: -1.7% for AGIs below $10k, -0.1% for AGIs $10k-25k, 0.1% for AGIs $25k-50k, 0.3% for AGIs $50k-75k, 0.7% for AGIs $75k-100k, 5.5% for AGIs over 100k)
Profit/loss from business: +$7,600 (reported on 20.9% of returns)
Here:
+$7,600
State:
+$13,809
(% of AGI for various income ranges: 46.6% for AGIs below $10k, 15.0% for AGIs $10k-25k, 2.2% for AGIs $25k-50k, 1.2% for AGIs $50k-75k, 2.6% for AGIs $75k-100k, 1.9% for AGIs over 100k)
IRA payment deduction: $3,078 (reported on 3.1% of returns)
11106:
$3,078
New York:
$3,115
(% of AGI for various income ranges: 0.5% for AGIs below $10k, 0.3% for AGIs $10k-25k, 0.3% for AGIs $25k-50k, 0.3% for AGIs $50k-75k, 0.2% for AGIs $75k-100k, 0.2% for AGIs over 100k)
Self-employed pension: $7,479 (reported on 0.3% of returns)
Here:
$7,479
New York:
$19,016
Total itemized deductions: $14,668 (24% of AGI, reported on 28.1% of returns)
Here:
$14,668
State:
$25,864
Here:
23.7% of AGI
State:
21.9% of AGI
(% of AGI for various income ranges: 8.8% for AGIs below $10k, 6.5% for AGIs $10k-25k, 10.9% for AGIs $25k-50k, 13.9% for AGIs $50k-75k, 15.5% for AGIs $75k-100k, 14.6% for AGIs over 100k)
Charity contributions deductions: $2,271 (4% of AGI, reported on 25.1% of returns)
Here:
$2,271
State:
$4,439
Here:
3.6% of AGI
State:
3.6% of AGI
(% of AGI for various income ranges: 0.3% for AGIs below $10k, 0.8% for AGIs $10k-25k, 1.7% for AGIs $25k-50k, 2.0% for AGIs $50k-75k, 2.1% for AGIs $75k-100k, 1.8% for AGIs over 100k)
Total tax: $4,598 (reported on 78.0% of returns)
11106:
$4,598
State:
$11,730
(% of AGI for various income ranges: 7.8% for AGIs below $10k, 5.4% for AGIs $10k-25k, 7.8% for AGIs $25k-50k, 11.2% for AGIs $50k-75k, 12.7% for AGIs $75k-100k, 17.7% for AGIs over 100k)
Earned income credit: $1,545 (reported on 20.5% of returns)
Here:
$1,545
State:
$1,757
Percentage of individuals using paid preparers for their 2004 taxes: 69.0%
Here:
69%
State:
67%
(% for various income ranges: 68.0% for AGIs below $10k, 73.1% for AGIs $10k-25k, 66.6% for AGIs $25k-50k, 66.5% for AGIs $50k-75k, 70.4% for AGIs $75k-100k, 72.3% for AGIs over 100k)
Likely homosexual households (counted as self-reported same-sex unmarried-partner households)
Lesbian couples: 0.3% of all households
Gay men: 0.1% of all households
Household received Food Stamps/SNAP in the past 12 months: 3,201 Household did not receive Food Stamps/SNAP in the past 12 months: 15,742
Women who had a birth in the past 12 months: 260 (247 now married, 9 unmarried) Women who did not have a birth in the past 12 months: 10,459 (3,401 now married, 7,076 unmarried)
Housing units in zip code 11106 with a mortgage: 1,429 (86 second mortgage, 19 home equity loan, 65 both second mortgage and home equity loan) Houses without a mortgage: 10
Median monthly owner costs for units with a mortgage: $3,290 Median monthly owner costs for units without a mortgage: $1,007
Residents with income below the poverty level in 2022:
This zip code:
12.7%
Whole state:
14.3%
Residents with income below 50% of the poverty level in 2022:
This zip code:
6.5%
Whole state:
6.8%
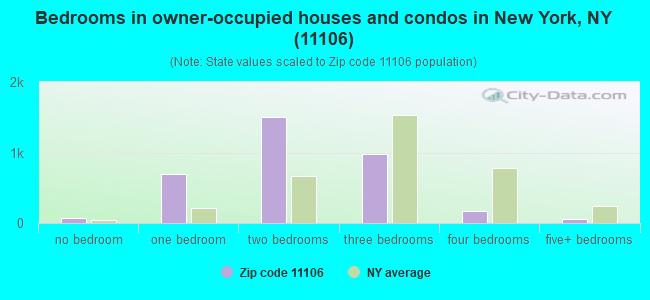
Median number of rooms in houses and condos:
Here:
4.3
State:
6.3
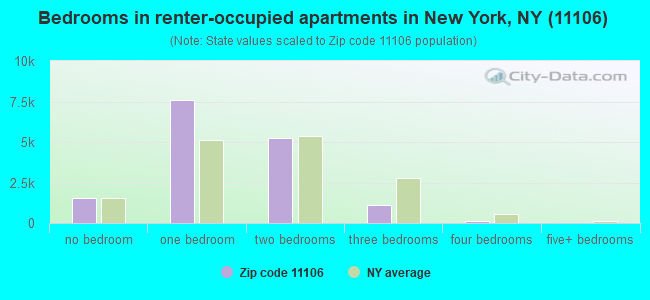
Median number of rooms in apartments:
Here:
3.3
State:
3.8
Notable locations in this zip code not listed on our city pages
Notable locations in zip code 11106: Adirondack Building (A), Isamu Noguchi Garden Museum (B), Museum of the Moving Image (C), Fire Department New York Engine 260 Foam Unit 81 (D), New York Foam Company 81 (E), Kaufman's Astoria Motion Picture And Television Center (F). Display/hide their locations on the map
Churches in zip code 11106 include: Saint Rita's Roman Catholic Church (A), Iglesia Adventista Septimo Dia (B), Holy Cross Ukrainian Church (C), Adath Israel Center (D), Community Church of Astoria (E). Display/hide their locations on the map
Parks in zip code 11106 include: Socrates Sculpture Garden (1), Rainey Park (2), Ravenswood Playground (3), Spirit Playground (4), Dutch Kills Playground (5), Arrow Community Garden (6), Astoria Health Center Playground (7). Display/hide their locations on the map
Tourist attraction (not listed on the city page) : Culinary Concepts Services Inc (Cultural Attractions- Events- & Facilities; 31 -16 36th Ave).
3,600 married couples with children.
1,662 single-parent households (645 men, 1,017 women).
46.7% of residents of 11106 zip code speak English at home.
21.7% of residents speak Spanish at home (56% very well, 20% well, 16% not well, 8% not at all).
19.6% of residents speak other Indo-European language at home (64% very well, 25% well, 8% not well, 3% not at all).
8.4% of residents speak Asian or Pacific Island language at home (48% very well, 25% well, 19% not well, 8% not at all).
3.1% of residents speak other language at home (68% very well, 27% well, 6% not well).
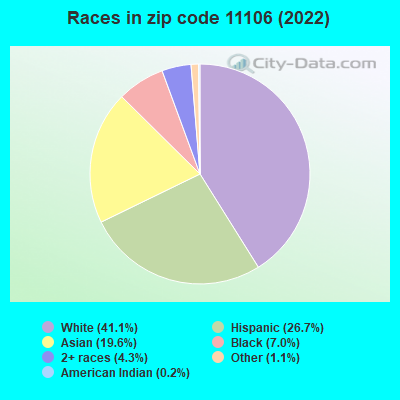
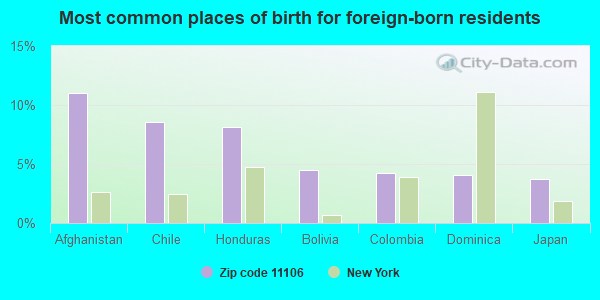
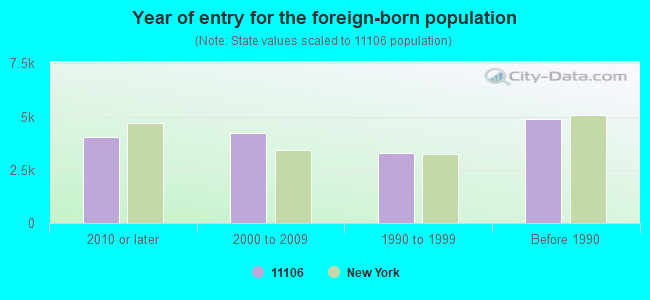
Foreign born population: 15,584 (39.4%) (59.7% of them are naturalized citizens)
This zip code:
39.4%
Whole state:
22.7%
11%Afghanistan
9%Chile
8%Honduras
5%Bolivia
4%Colombia
4%Dominica
4%Japan
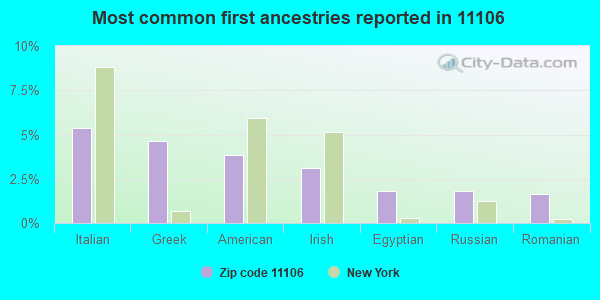
5%Italian
5%Greek
4%American
3%Irish
2%Egyptian
2%Russian
2%Romanian
Year of entry for the foreign-born population
4,0592010 or later
4,2142000 to 2009
3,3011990 to 1999
4,884Before 1990
Public elementary/middle school in in zip code 11106 not listed on the city page:
Major facilities with environmental interests located in this zip code:
IS 126 ASTORIA IS ( in LONG ISLAND CITY, NY)
(National Center for Education Statistics) - STATE ID-343000010126 Organizations: NEW YORK CITY PUBLIC SCHOOLS (SCHOOL DISTRICT)
IS 204 O. W. HOLMES SCHOOL ( in LONG ISLAND CITY, NY)
(National Center for Education Statistics) - STATE ID-343000010204 Organizations: NEW YORK CITY PUBLIC SCHOOLS (SCHOOL DISTRICT)
CON ED-RAINEY SUBSTATION (35-58 VERNON BOULEVARD in LONG ISLAND CITY, NY)
AIR MINOR (AIRS/AFS) CRITERIA AND HAZARDOUS AIR POLLUTANT INVENTORY (Inventory of air pollution sources) HAZARDOUS WASTE BIENNIAL REPORTER (Resource Conservation and Recovery Act (tracking hazardous waste)) Large Quantity Generators, more that 1000 kg of hazardous waste/month (Resource Conservation and Recovery Act (tracking hazardous waste)) Business SIC classification: ELECTRIC AND OTHER SERVICES COMBINED Business NAICS classification: ELECTRIC POWER DISTRIBUTION. Alternative names: CON ED RAINEY SUBSTATION & TANK FARM, CON EDISON - RAINEY SS & TANK FARM
HEER METAL WORKS INCORPORATED (3652 36TH STREET in LONG ISLAND CITY, NY)
(Resource Conservation and Recovery Act (tracking hazardous waste)) Small Quantity Generators, between 100 kg and 1000 kg of hazardous waste/month (Resource Conservation and Recovery Act (tracking hazardous waste)) Organizations: FRED & WILLIAM EVANS (CONTACT/OPERATOR)
CON EDISON - RAINEY PURS (34-58 VERNON BOULEVARD in QUEENS, NY)
HAZARDOUS WASTE BIENNIAL REPORTER (Resource Conservation and Recovery Act (tracking hazardous waste)) Large Quantity Generators, more that 1000 kg of hazardous waste/month (Resource Conservation and Recovery Act (tracking hazardous waste)) Organizations: CONSOLIDATED EDISON COMPANY OF NY, INC. (CONTACT/OPERATOR)
Alternative names: CON ED RAINEY COOLING PLANT, CON EDISON - RAINEY CP
33-34 21ST STREET (33-34 21ST ST in LONG ISLAND CITY, NY)
(Resource Conservation and Recovery Act (tracking hazardous waste)) Organizations: BILL WOLF PETROLEUM CORP (CONTACT/OWNER)
, ROUTE 109 SERVICE STATION INC (CONTACT/OWNER)
CON EDISON - MH 19532 (BROADWAY & 21 ST in ASTORIA, NY)
Large Quantity Generators, more that 1000 kg of hazardous waste/month (Resource Conservation and Recovery Act (tracking hazardous waste)) Organizations: CONSOLIDATED EDISON COMPANY OF NY, INC. (CONTACT/OPERATOR)
CON EDISON - MH 19720 (9TH STREET & 35TH AVENUE in ASTORIA, NY)
Large Quantity Generators, more that 1000 kg of hazardous waste/month (Resource Conservation and Recovery Act (tracking hazardous waste)) Organizations: CONSOLIDATED EDISON COMPANY OF NY, INC. (CONTACT/OPERATOR)
CON EDISON - VS 7324 (VERNON BLVD AND 34 AVE in ASTORIA, NY)
Large Quantity Generators, more that 1000 kg of hazardous waste/month (Resource Conservation and Recovery Act (tracking hazardous waste)) Organizations: CONSOLIDATED EDISON COMPANY OF NY, INC. (CONTACT/OPERATOR)
CON EDISON - VS 7402 (VERNON BLVD AND 34 AVE in ASTORIA, NY)
Large Quantity Generators, more that 1000 kg of hazardous waste/month (Resource Conservation and Recovery Act (tracking hazardous waste)) Organizations: CONSOLIDATED EDISON COMPANY OF NY, INC. (CONTACT/OPERATOR)
KAUFMAN ASTORIA STUDIOS (34-12 36TH ST in ASTORIA, NY)
AIR SYNTHETIC MINOR (AIRS/AFS) (Resource Conservation and Recovery Act (tracking hazardous waste)) Business SIC classification: SERVICES ALLIED TO MOTION PICTURE PRODUCTION Alternative names: 34-31 35TH ST BUILDING
A & D STEEL EQUIPMENT CO INCORPORATED (1135 31ST DRIVE in LONG ISLAND CITY, NY)
AIR MINOR (AIRS/AFS) Small Quantity Generators, between 100 kg and 1000 kg of hazardous waste/month (Resource Conservation and Recovery Act (tracking hazardous waste)) Business SIC classification: COATING, ENGRAVING, AND ALLIED SERVICES Alternative names: A & D STEEL EQUIPMENT CO - LIC FACILITY
CIPICO CONSTRUCTION INC (3203 VERNON BLVD in LONG ISLAND CITY, NY)
HAZARDOUS WASTE BIENNIAL REPORTER (Resource Conservation and Recovery Act (tracking hazardous waste)) (Resource Conservation and Recovery Act (tracking hazardous waste))
Housing units lacking complete plumbing facilities: 1.2% Housing units lacking complete kitchen facilities: 1.4%
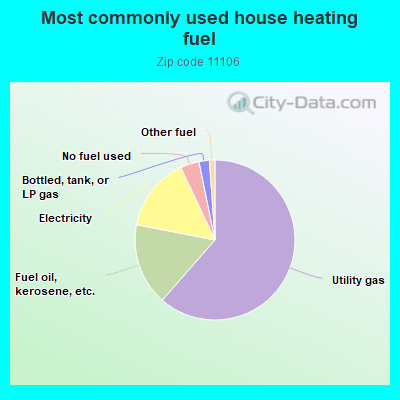
62.1%Utility gas
17.0%Fuel oil, kerosene, etc.
14.5%Electricity
3.4%No fuel used
2.0%Bottled, tank, or LP gas
0.9%Other fuel
Population in 1990: 36,515. Population change in the 1990s: +6,615 (+18.1%).
Place of birth for U.S.-born residents:
This state: 16,218
Northeast: 2,009
Midwest: 1,275
South: 1,949
West: 1,705
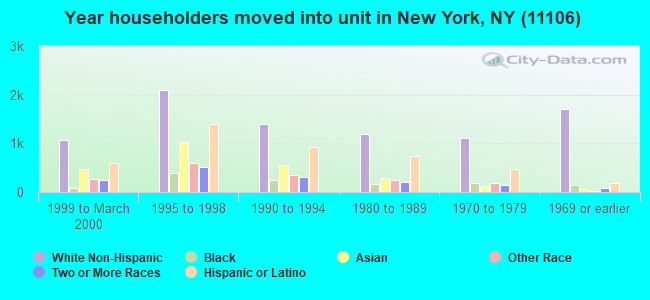
67% of the 11106 zip code residents lived in the same house 5 years ago. Out of people who lived in different houses, 56% lived in this county. Out of people who lived in different counties, 50% lived in New York.
87% of the 11106 zip code residents lived in the same house 1 year ago. Out of people who lived in different houses, 52% moved from this county. Out of people who lived in different houses, 34% moved from different county within same state. Out of people who lived in different houses, 10% moved from different state. Out of people who lived in different houses, 5% moved from abroad.
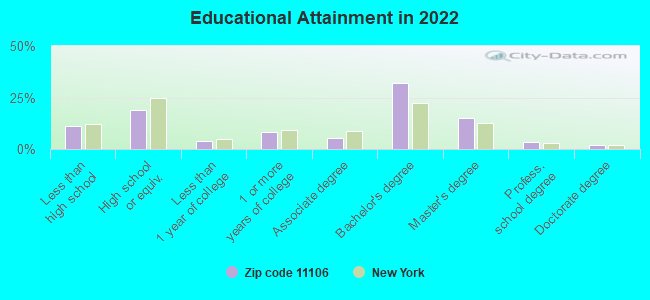
Private vs. public school enrollment:
Students in private schools in grades 1 to 8 (elementary and middle school): 168
Here:
7.2%
New York:
15.6%
Students in private schools in grades 9 to 12 (high school): 100
Here:
8.2%
New York:
15.0%
Students in private undergraduate colleges: 350
Here:
18.7%
New York:
39.2%
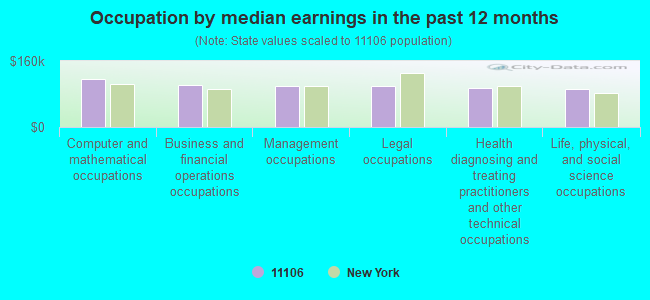
Occupation by median earnings in the past 12 months ($)
116,633Computer and mathematical occupations
102,948Business and financial operations occupations
99,908Management occupations
99,843Legal occupations
93,973Health diagnosing and treating practitioners and other technical occupations
92,498Life, physical, and social science occupations
Companies with federal contracts located in this zip code:
RUTA SUPPLIES, INC (30-09 35TH AVENUE in ASTORIA, NY; small business) : $22,017,177 in 396 contractsfrom 1999 to 2006
Contracts for Vehicular Cab, Body, and Frame Structural Components, Packing and Gasket Materials, Miscellaneous Alarm, Signal and Security Detection Systems, Engine Cooling System Components, Nonaircraft, and moreby Defense Logistics Agency, Navy, Army Signed by year:2000: $3,587,572; 2001: $6,732,154; 2002: $2,774,629; 2003: $3,419,601; 2004: $2,830,733; 2005: $1,483,983; 2006: $792,031.
Biggest contracts:
$543,000 with Defense Logistics Agency for Vehicular Cab, Body, and Frame Structural Components. Taking place in NJ. Signed on 2003-11-28. Completion date: 2004-02-11.
$494,390 with Defense Logistics Agency for Packing and Gasket Materials. Signed on 2001-10-09. Completion date: 2002-06-09.
$346,096 with Navy for Miscellaneous Alarm, Signal and Security Detection Systems. Signed on 2003-05-15. Completion date: 2004-05-15.
$330,000 with Defense Logistics Agency for Engine Cooling System Components, Nonaircraft. Signed on 2000-12-04. Completion date: 2001-02-17.
AIR CONDITIONING SUPPLY CO IN (9-07 34TH AVE in LONG ISLAND CI, NY; small business) : $182,133 in 11 contractsfrom 2002 to 2006
Contracts for Valves, Nonpowered, Hose, Pipe, Tube, Lubrication, and Railing Fittings, Refrigeration and Air Conditioning Components by Defense Logistics Agency Signed by year:2000: $0; 2001: $0; 2002: $108,035; 2003: $0; 2004: $41,114; 2005: $26,065; 2006: $6,919.
Biggest contracts:
$65,790 with Defense Logistics Agency for Valves, Nonpowered. Signed on 2002-02-21. Completion date: 2002-09-09.
$42,245, same as above.Signed on 2002-03-26. Completion date: 2002-05-15.
$19,656, same as above.Signed on 2005-02-28. Completion date: 2005-04-30.
$13,589, same as above.Signed on 2004-10-01. Completion date: 2005-09-30.
OCEANSIDE AVIATION, INC (32-35 30TH STREET D-26 in LONG ISLAND CI, NY; small business) 50 employees, $0 revenue. Woman Owned Business: $175,500 in 5 contractsin 2003
Contracts for Airframe Structural Components by Air Force Signed by year:2000: $0; 2001: $0; 2002: $0; 2003: $175,500; 2004: $0; 2005: $0; 2006: $0.
Biggest contracts:
$49,950 with Air Force for Airframe Structural Components. Signed on 2003-09-30. Completion date: 2003-10-15.
$41,393, same as above.Signed on 2003-12-04. Completion date: 2003-12-18.
$31,770, same as above.Signed on 2003-09-04. Completion date: 2003-09-19.
$26,624, same as above.Signed on 2003-09-25. Completion date: 2003-10-10.
VOICEMETHODS, LLC (ECTACO CORP CENTER in LONG ISLAND CI, NY; small business)
$99,000 with Army for Other Defense -- Applied Research and Exploratory Development (R&D). Signed on 2003-08-14. Completion date: 2004-04-23.
EFAM ENTERPRISES, LLC (35-21 VERNON BLVD in LONG ISLAND CI, NY; small business) : $15,923 in 2 contractsfrom 2003 to 2004
$9,140 with Army for ADP Supplies. Taking place in VT. Signed on 2003-09-16. Completion date: 2003-09-29.
$6,783 with Army for ADP Supplies. Taking place in AL. Signed on 2004-09-09. Completion date: 2004-10-15.
BELAIRE DINER CORP (31-91 21ST ST in LONG ISLAND CI, NY; small business)
$5,669 with Army for Food Services. Signed on 2004-09-10. Completion date: 2004-09-30.
Top industries in this zip code by the number of employees in 2005:
Health Care and Social Assistance: Services for the Elderly and Persons with Disabilities (over 1000 employees: 1 establishment, 20-49 employees: 1 establishment, 10-19 employees: 1 establishment, 5-9 employees: 1 establishment, 1-4 employees: 1 establishment)
Health Care and Social Assistance: Home Health Care Services (500-999: 1)
2007 - 2018 National Fire Incident Reporting System (NFIRS) incidents
Based on the data from the years 2007 - 2018 the average number of fires per year is 122. The highest number of fires - 131 took place in 2015, and the least - 100 in 2012. The data has a growing trend.
When looking into fire subcategories, the most incidents belonged to: Structure Fires (67.4%), and Outside Fires (20.3%).
Fire incident types reported to NFIRS in Zip Code 11106


 Nearest zip codes: 11102, 11101, 11103, 10044, 10162, 11104.
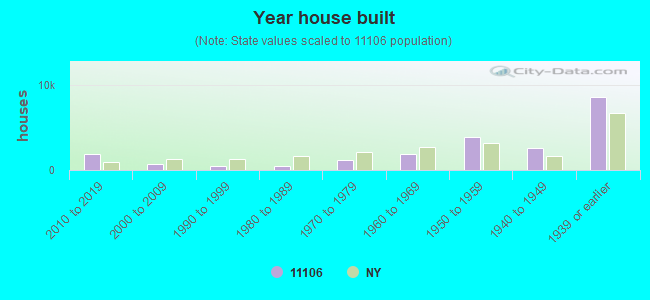


 (Students: 707, Location: 36-12 35TH AVE, Grades: KG-8, Charter school)

 Based on the data from the years 2007 - 2018 the average number of fires per year is 122. The highest number of fires - 131 took place in 2015, and the least - 100 in 2012. The data has a growing trend.
 When looking into fire subcategories, the most incidents belonged to: Structure Fires (67.4%), and Outside Fires (20.3%).