Estimated zip code population in 2022: 26,511 Zip code population in 2010: 27,232 Zip code population in 2000: 29,506
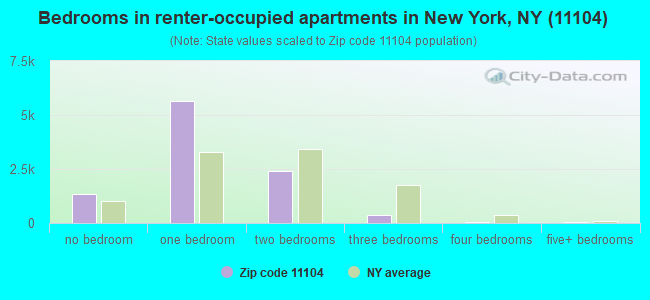
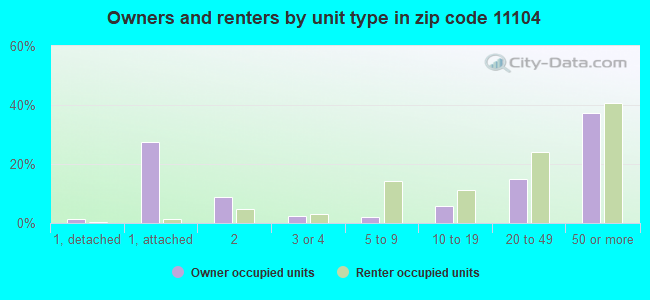
Houses and condos: 13,256 Renter-occupied apartments: 9,832
% of renters here:
80%
State:
46%
March 2022 cost of living index in zip code 11104: 150.9 (very high, U.S. average is 100)
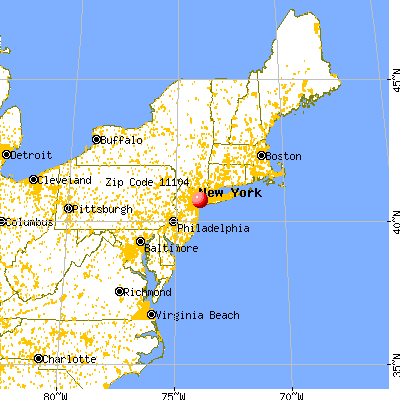
Land area: 0.4 sq. mi. Water area: 0.0 sq. mi.
Population density: 68,122 people per square mile
(very high).
OSM Map
General Map
Google Map
MSN Map
OSM Map
General Map
Google Map
MSN Map
OSM Map
General Map
Google Map
MSN Map
OSM Map
General Map
Google Map
MSN Map
Please wait while loading the map...
Real estate property taxes paid for housing units in 2022:
This zip code:
0.7% ($5,306)
New York:
1.5% ($6,180)
Median real estate property taxes paid for housing units with mortgages in 2022: $5,473 (0.8%) Median real estate property taxes paid for housing units with no mortgage in 2022: $5,083 (0.7%)
Estimated median house/condo value in 2022: $707,710
11104:
$707,710
New York:
$400,400
According to our research of New York and other state lists, there were 6 registered sex offenders living in 11104 zip code as of April 27, 2024. The ratio of all residents to sex offenders in zip code 11104 is 4,413 to 1. The ratio of registered sex offenders to all residents in this zip code is much lower than the state average.
Median resident age:
This zip code:
39.4 years
New York median age:
40.0 years
Average household size:
This zip code:
2.2 people
New York:
2.5 people
Averages for the 2020 tax year for zip code 11104, filed in 2021:
Average Adjusted Gross Income (AGI) in 2020: $65,634 (Individual Income Tax Returns)
Here:
$65,634
State:
$90,930
Salary/wage: $64,659 (reported on 77.9% of returns)
Here:
$64,659
State:
$72,104
(% of AGI for various income ranges: 851.3% for AGIs below $25k, 3243.6% for AGIs $25k-50k, 6895.6% for AGIs $50k-75k, 10546.6% for AGIs $75k-100k, 20128.6% for AGIs $100k-200k, 90647.2% for AGIs over 200k)
Taxable interest for individuals: $1,078 (reported on 27.8% of returns)
This zip code:
$1,078
New York:
$3,075
(% of AGI for various income ranges: 16.5% for AGIs below $25k, 20.6% for AGIs $25k-50k, 24.8% for AGIs $50k-75k, 52.0% for AGIs $75k-100k, 98.6% for AGIs $100k-200k, 711.7% for AGIs over 200k)
Ordinary dividends: $4,316 (reported on 18.8% of returns)
Here:
$4,316
State:
$11,095
(% of AGI for various income ranges: 21.8% for AGIs below $25k, 30.9% for AGIs $25k-50k, 58.3% for AGIs $50k-75k, 94.0% for AGIs $75k-100k, 240.1% for AGIs $100k-200k, 3208.3% for AGIs over 200k)
Net capital gain/loss in AGI: +$11,735 (reported on 18.9% of returns)
Here:
+$11,735
State:
+$44,925
(% of AGI for various income ranges: 9.9% for AGIs below $25k, 39.2% for AGIs $25k-50k, 69.5% for AGIs $50k-75k, 155.3% for AGIs $75k-100k, 373.3% for AGIs $100k-200k, 13655.0% for AGIs over 200k)
Profit/loss from business: +$9,457 (reported on 25.2% of returns)
Here:
+$9,457
State:
+$14,940
(% of AGI for various income ranges: 391.9% for AGIs below $25k, 282.8% for AGIs $25k-50k, 187.2% for AGIs $50k-75k, 262.5% for AGIs $75k-100k, 488.9% for AGIs $100k-200k, 2859.4% for AGIs over 200k)
Taxable individual retirement arrangement distribution: $15,077 (reported on 4.1% of returns)
11104:
$15,077
New York:
$19,609
(% of AGI for various income ranges: 31.2% for AGIs below $25k, 42.2% for AGIs $25k-50k, 67.3% for AGIs $50k-75k, 119.2% for AGIs $75k-100k, 187.8% for AGIs $100k-200k, 1419.4% for AGIs over 200k)
Self-employed (Keogh) retirement plans: $17,825 (reported on 0.5% of returns)
11104:
$17,825
New York:
$32,497
(% of AGI for various income ranges: 16.7% for AGIs $50k-75k, 29.4% for AGIs $100k-200k, 424.4% for AGIs over 200k)
Total itemized deductions: $27,194 (reported on 5.9% of returns)
Here:
$27,194
State:
$39,326
(% of AGI for various income ranges: 26.7% for AGIs below $25k, 54.9% for AGIs $25k-50k, 139.3% for AGIs $50k-75k, 339.9% for AGIs $75k-100k, 689.2% for AGIs $100k-200k, 3985.0% for AGIs over 200k)
Charity contributions: $6,139 (reported on 4.7% of returns)
Here:
$6,139
State:
$15,420
(% of AGI for various income ranges: 1.6% for AGIs below $25k, 6.1% for AGIs $25k-50k, 19.6% for AGIs $50k-75k, 47.3% for AGIs $75k-100k, 120.8% for AGIs $100k-200k, 980.6% for AGIs over 200k)
Taxes paid: $9,048 (reported on 5.8% of returns)
11104:
$9,048
State:
$9,183
(% of AGI for various income ranges: 6.2% for AGIs below $25k, 12.4% for AGIs $25k-50k, 42.8% for AGIs $50k-75k, 136.5% for AGIs $75k-100k, 273.0% for AGIs $100k-200k, 1006.7% for AGIs over 200k)
Earned income credit: $1,740 (reported on 14.0% of returns)
Here:
$1,740
State:
$2,138
(% of AGI for various income ranges: 78.5% for AGIs below $25k, 55.9% for AGIs $25k-50k)
Percentage of individuals using paid preparers for their 2020 taxes: 94.1%
Here:
94%
State:
95%
(% for various income ranges: 91.4% for AGIs below $25k, 95.1% for AGIs $25k-50k, 95.7% for AGIs $50k-75k, 95.2% for AGIs $75k-100k, 95.1% for AGIs $100k-200k, 96.4% for AGIs over 200k)
Averages for the 2012 tax year for zip code 11104, filed in 2013:
Average Adjusted Gross Income (AGI) in 2012: $48,955 (Individual Income Tax Returns)
Here:
$48,955
State:
$77,088
Salary/wage: $50,807 (reported on 78.6% of returns)
Here:
$50,807
State:
$60,593
(% of AGI for various income ranges: 59.1% for AGIs below $25k, 86.7% for AGIs $25k-50k, 89.1% for AGIs $50k-75k, 88.8% for AGIs $75k-100k, 85.3% for AGIs $100k-200k, 67.6% for AGIs over 200k)
Taxable interest for individuals: $857 (reported on 30.7% of returns)
This zip code:
$857
New York:
$3,125
(% of AGI for various income ranges: 0.9% for AGIs below $25k, 0.4% for AGIs $25k-50k, 0.6% for AGIs $50k-75k, 0.5% for AGIs $75k-100k, 0.4% for AGIs $100k-200k, 0.7% for AGIs over 200k)
Ordinary dividends: $2,810 (reported on 14.3% of returns)
Here:
$2,810
State:
$10,299
(% of AGI for various income ranges: 1.0% for AGIs below $25k, 0.6% for AGIs $25k-50k, 0.7% for AGIs $50k-75k, 0.8% for AGIs $75k-100k, 1.0% for AGIs $100k-200k, 0.8% for AGIs over 200k)
Net capital gain/loss in AGI: +$3,287 (reported on 11.1% of returns)
Here:
+$3,287
State:
+$42,474
(% of AGI for various income ranges: 0.1% for AGIs $75k-100k, 1.0% for AGIs $100k-200k, 3.6% for AGIs over 200k)
Profit/loss from business: +$10,469 (reported on 26.7% of returns)
Here:
+$10,469
State:
+$16,168
(% of AGI for various income ranges: 30.3% for AGIs below $25k, 6.1% for AGIs $25k-50k, 2.5% for AGIs $50k-75k, 1.7% for AGIs $75k-100k, 2.7% for AGIs $100k-200k, 1.1% for AGIs over 200k)
Taxable individual retirement arrangement distribution: $11,016 (reported on 5.0% of returns)
11104:
$11,016
New York:
$17,621
(% of AGI for various income ranges: 2.0% for AGIs below $25k, 1.0% for AGIs $25k-50k, 1.0% for AGIs $50k-75k, 1.1% for AGIs $75k-100k, 1.3% for AGIs $100k-200k, 0.6% for AGIs over 200k)
Self-employment retirement plans: $12,467 (reported on 0.4% of returns)
11104:
$12,467
New York:
$27,330
Total itemized deductions: $19,304 (19% of AGI, reported on 27.8% of returns)
Here:
$19,304
State:
$34,985
Here:
19.4% of AGI
State:
21.3% of AGI
(% of AGI for various income ranges: 4.7% for AGIs below $25k, 7.3% for AGIs $25k-50k, 10.2% for AGIs $50k-75k, 12.9% for AGIs $75k-100k, 14.7% for AGIs $100k-200k, 13.2% for AGIs over 200k)
Charity contributions: $2,259 (reported on 22.4% of returns)
Here:
$2,259
State:
$5,572
(% of AGI for various income ranges: 0.4% for AGIs below $25k, 0.8% for AGIs $25k-50k, 1.3% for AGIs $50k-75k, 1.3% for AGIs $75k-100k, 1.3% for AGIs $100k-200k, 0.8% for AGIs over 200k)
Taxes paid: $10,127 (reported on 27.7% of returns)
11104:
$10,127
State:
$18,656
(% of AGI for various income ranges: 1.0% for AGIs below $25k, 1.9% for AGIs $25k-50k, 4.2% for AGIs $50k-75k, 6.8% for AGIs $75k-100k, 8.6% for AGIs $100k-200k, 10.5% for AGIs over 200k)
Earned income credit: $1,901 (reported on 19.9% of returns)
Here:
$1,901
State:
$2,230
(% of AGI for various income ranges: 6.2% for AGIs below $25k, 0.8% for AGIs $25k-50k)
Percentage of individuals using paid preparers for their 2012 taxes: 67.8%
Here:
68%
State:
66%
(% for various income ranges: 70.6% for AGIs below $25k, 67.0% for AGIs $25k-50k, 62.2% for AGIs $50k-75k, 65.0% for AGIs $75k-100k, 68.8% for AGIs $100k-200k, 73.9% for AGIs over 200k)
Averages for the 2004 tax year for zip code 11104, filed in 2005:
Average Adjusted Gross Income (AGI) in 2004: $35,617 (Individual Income Tax Returns)
Here:
$35,617
State:
$59,519
Salary/wage: $37,193 (reported on 79.0% of returns)
Here:
$37,193
State:
$50,673
(% of AGI for various income ranges: 58.1% for AGIs below $10k, 69.9% for AGIs $10k-25k, 90.0% for AGIs $25k-50k, 90.1% for AGIs $50k-75k, 85.8% for AGIs $75k-100k, 73.1% for AGIs over 100k)
Taxable interest for individuals: $1,115 (reported on 42.3% of returns)
This zip code:
$1,115
New York:
$2,377
(% of AGI for various income ranges: 3.7% for AGIs below $10k, 1.8% for AGIs $10k-25k, 1.0% for AGIs $25k-50k, 1.0% for AGIs $50k-75k, 1.5% for AGIs $75k-100k, 1.3% for AGIs over 100k)
Taxable dividends: $2,172 (reported on 15.5% of returns)
Here:
$2,172
State:
$5,394
(% of AGI for various income ranges: 2.0% for AGIs below $10k, 1.0% for AGIs $10k-25k, 0.5% for AGIs $25k-50k, 0.8% for AGIs $50k-75k, 1.0% for AGIs $75k-100k, 1.4% for AGIs over 100k)
Net capital gain/loss: +$3,087 (reported on 12.2% of returns)
Here:
+$3,087
State:
+$23,581
(% of AGI for various income ranges: -1.2% for AGIs below $10k, -0.2% for AGIs $10k-25k, -0.3% for AGIs $25k-50k, 0.3% for AGIs $50k-75k, 0.3% for AGIs $75k-100k, 5.3% for AGIs over 100k)
Profit/loss from business: +$8,677 (reported on 23.4% of returns)
Here:
+$8,677
State:
+$13,809
(% of AGI for various income ranges: 39.2% for AGIs below $10k, 18.5% for AGIs $10k-25k, 3.4% for AGIs $25k-50k, 1.9% for AGIs $50k-75k, 1.8% for AGIs $75k-100k, 2.6% for AGIs over 100k)
IRA payment deduction: $3,004 (reported on 3.5% of returns)
11104:
$3,004
New York:
$3,115
(% of AGI for various income ranges: 0.4% for AGIs below $10k, 0.4% for AGIs $10k-25k, 0.4% for AGIs $25k-50k, 0.3% for AGIs $50k-75k, 0.3% for AGIs $75k-100k, 0.1% for AGIs over 100k)
Self-employed pension: $9,257 (reported on 0.5% of returns)
Here:
$9,257
New York:
$19,016
(% of AGI for various income ranges: 0.1% for AGIs $25k-50k, 0.1% for AGIs $50k-75k, 0.1% for AGIs $75k-100k, 0.3% for AGIs over 100k)
Total itemized deductions: $15,370 (24% of AGI, reported on 28.6% of returns)
Here:
$15,370
State:
$25,864
Here:
23.7% of AGI
State:
21.9% of AGI
(% of AGI for various income ranges: 6.6% for AGIs below $10k, 6.7% for AGIs $10k-25k, 11.3% for AGIs $25k-50k, 14.5% for AGIs $50k-75k, 15.3% for AGIs $75k-100k, 14.1% for AGIs over 100k)
Charity contributions deductions: $2,334 (3% of AGI, reported on 25.7% of returns)
Here:
$2,334
State:
$4,439
Here:
3.4% of AGI
State:
3.6% of AGI
(% of AGI for various income ranges: 0.3% for AGIs below $10k, 0.9% for AGIs $10k-25k, 1.7% for AGIs $25k-50k, 2.0% for AGIs $50k-75k, 2.0% for AGIs $75k-100k, 1.9% for AGIs over 100k)
Total tax: $4,744 (reported on 79.2% of returns)
11104:
$4,744
State:
$11,730
(% of AGI for various income ranges: 6.8% for AGIs below $10k, 5.6% for AGIs $10k-25k, 7.7% for AGIs $25k-50k, 11.2% for AGIs $50k-75k, 12.5% for AGIs $75k-100k, 16.3% for AGIs over 100k)
Earned income credit: $1,516 (reported on 20.3% of returns)
Here:
$1,516
State:
$1,757
Percentage of individuals using paid preparers for their 2004 taxes: 70.8%
Here:
71%
State:
67%
(% for various income ranges: 68.5% for AGIs below $10k, 74.3% for AGIs $10k-25k, 69.2% for AGIs $25k-50k, 69.2% for AGIs $50k-75k, 71.5% for AGIs $75k-100k, 74.0% for AGIs over 100k)
Likely homosexual households (counted as self-reported same-sex unmarried-partner households)
Lesbian couples: 0.5% of all households
Gay men: 0.5% of all households
Household received Food Stamps/SNAP in the past 12 months: 1,068 Household did not receive Food Stamps/SNAP in the past 12 months: 11,081
Women who had a birth in the past 12 months: 352 (265 now married, 86 unmarried) Women who did not have a birth in the past 12 months: 7,181 (3,175 now married, 3,979 unmarried)
Housing units in zip code 11104 with a mortgage: 1,281 (160 second mortgage, 22 both second mortgage and home equity loan) Houses without a mortgage: 76
Median monthly owner costs for units with a mortgage: $2,294 Median monthly owner costs for units without a mortgage: $786
Residents with income below the poverty level in 2022:
This zip code:
11.4%
Whole state:
14.3%
Residents with income below 50% of the poverty level in 2022:
This zip code:
5.0%
Whole state:
6.8%
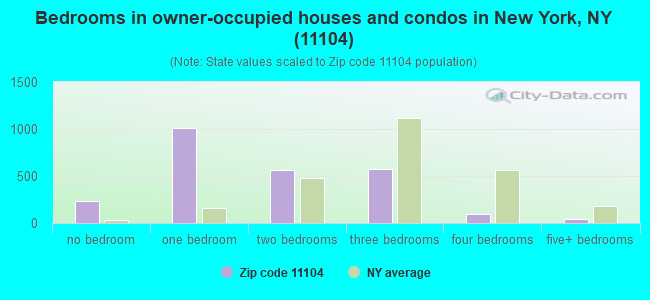
Median number of rooms in houses and condos:
Here:
3.9
State:
6.3
Median number of rooms in apartments:
Here:
3.2
State:
3.8
Notable locations in this zip code not listed on our city pages
Churches in zip code 11104 include: Sunnyside Reformed Church (A), Sunnyside Jewish Center (B), Queen of Angels Roman Catholic Church (C). Display/hide their locations on the map
3,243 married couples with children.
989 single-parent households (439 men, 550 women).
39.2% of residents of 11104 zip code speak English at home.
23.6% of residents speak Spanish at home (49% very well, 18% well, 19% not well, 15% not at all).
19.8% of residents speak other Indo-European language at home (63% very well, 25% well, 9% not well, 3% not at all).
13.7% of residents speak Asian or Pacific Island language at home (57% very well, 31% well, 9% not well, 4% not at all).
3.3% of residents speak other language at home (57% very well, 24% well, 16% not well, 3% not at all).
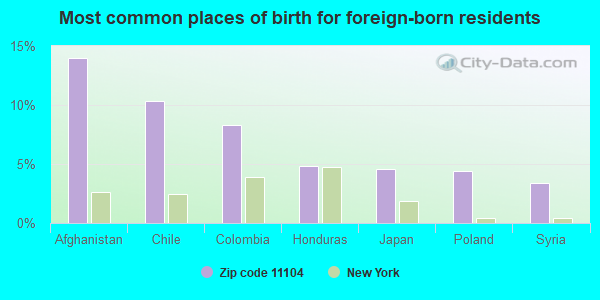
Foreign born population: 12,068 (45.5%) (47.5% of them are naturalized citizens)
This zip code:
45.5%
Whole state:
22.7%
14%Afghanistan
10%Chile
8%Colombia
5%Honduras
5%Japan
4%Poland
3%Syria
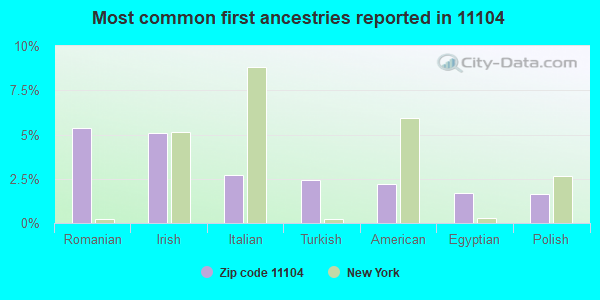
5%Romanian
5%Irish
3%Italian
2%Turkish
2%American
2%Egyptian
2%Polish
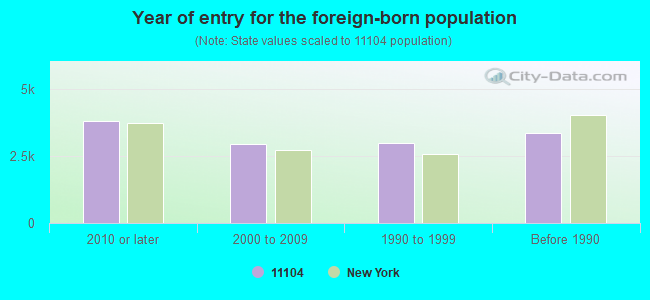
Year of entry for the foreign-born population
3,8082010 or later
2,9272000 to 2009
2,9831990 to 1999
3,337Before 1990
Major facilities with environmental interests located in this zip code:
CHROMY AUTO INC-43-17 39TH ST (43-17 39TH STREET in LONG ISLAND CITY, NY)
STATE MASTER (New York facility tracking) - AIR PROGRAM, (Resource Conservation and Recovery Act (tracking hazardous waste)) Organizations: UNKNOWN (CONTACT/OWNER)
, CHROMY AUTOMOTIVE INC (LEGALLY RESPONSIBLE PARTY)
Alternative names: CHROMG AUTOMOTIVE INC, CHROMY AUTOMOTIVE INC
A C CLEANERS (39-33 47TH AVE in LONG ISLAND CITY, NY)
STATE MASTER (New York facility tracking) - HAZARDOUS WASTE PROGRAM Conditionally Exempt Small Quantity Generators, less than 100 kg/month of hazardous waste (Resource Conservation and Recovery Act (tracking hazardous waste)) - notification Organizations: JEUNG EM YUN (CONTACT/OWNER)
, ROLANDO ACOSTA (CONTACT/OWNER)
Alternative names: SUNNYSIDE ACOSTA CLEANERS
ASCOT STEEL EQUIP (45-35 39TH ST in LONG ISLAND CITY, NY)
(Integrated Compliance Information System) - ICIS-02-1989-0036, FORMAL ENFORCEMENT ACTION, ICIS-02-1989-0366, (Resource Conservation and Recovery Act (tracking hazardous waste)) Business SIC classification: OFFICE AND STORE FIXTURES, PARTITIONS, SHELVING, AND LOCKERS, EXCEPT WOOD Alternative names: ASCOT STEEL EQUIPMENT CO INC
4315-4333 46TH STREET APARTMENTS CORP (43-15 46TH ST in QUEENS, NY)
AIR SYNTHETIC MINOR (AIRS/AFS) STATE MASTER (New York facility tracking) - AIR PROGRAM Business SIC classification: OPERATORS OF APARTMENT BUILDINGS Business NAICS classification: LESSORS OF RESIDENTIAL BUILDINGS AND DWELLINGS. Organizations: 4315 - 4333 46TH STREET APARTMENTS CORP (LEGALLY RESPONSIBLE PARTY)
Alternative names: 4315-4333 46 ST. OWNERS, 4315-4333 46TH ST OWNERS
46-01 39TH AVE BUILDING (46-01 39TH AVE in LONG ISLAND CITY, NY)
AIR SYNTHETIC MINOR (AIRS/AFS) STATE MASTER (New York facility tracking) - AIR PROGRAM, AIR FACILITY REGISTRATION Business SIC classification: OPERATORS OF APARTMENT BUILDINGS Organizations: SUNNYSIDE TOWERS OWNERS CORP
AMOCO SERVICE STATION (11-02 BORDEN AVENUE in LONG ISLAND CITY, NY)
AIR MINOR (AIRS/AFS) (Resource Conservation and Recovery Act (tracking hazardous waste)) Business SIC classification: GASOLINE SERVICE STATIONS Alternative names: 11TH AVENUE GAS INC, AMOCO-ZEEV HANIMONI 2458
CON EDISON - MH 10082 (S/S UNION TURNPIKE, 50` E/O LI in SUNNYSIDE, NY)
Large Quantity Generators, more that 1000 kg of hazardous waste/month (Resource Conservation and Recovery Act (tracking hazardous waste)) Organizations: CONSOLIDATED EDISON COMPANY OF NY, INC. (CONTACT/OPERATOR)
CLEANERS PRODUCTS (50-45 BARNETT AVENUE in LONG ISLAND CITY, NY)
Conditionally Exempt Small Quantity Generators, less than 100 kg/month of hazardous waste (Resource Conservation and Recovery Act (tracking hazardous waste)) - notification Conditionally Exempt Small Quantity Generators, less than 100 kg/month of hazardous waste (Resource Conservation and Recovery Act (tracking hazardous waste)) - notification Organizations: HAROLD JANOW (CONTACT/OWNER)
CON ED - MH 954 (N/W/C 47 ST & SKILLMAN AVE in SUNNYSIDE, NY)
HAZARDOUS WASTE BIENNIAL REPORTER (Resource Conservation and Recovery Act (tracking hazardous waste)) (Resource Conservation and Recovery Act (tracking hazardous waste))
CON ED - MH578 (THOMPSON AVE in LONG ISLAND CITY, NY)
HAZARDOUS WASTE BIENNIAL REPORTER (Resource Conservation and Recovery Act (tracking hazardous waste)) (Resource Conservation and Recovery Act (tracking hazardous waste))
CON ED - TM 1000 (N/S 36 AVE 30 W/O STEINWAY ST in ASTORIA, NY)
HAZARDOUS WASTE BIENNIAL REPORTER (Resource Conservation and Recovery Act (tracking hazardous waste)) (Resource Conservation and Recovery Act (tracking hazardous waste))
CON ED - V 3724 (REVIEW AVE COREENPOINT AVE in LONG ISLAND CITY, NY)
HAZARDOUS WASTE BIENNIAL REPORTER (Resource Conservation and Recovery Act (tracking hazardous waste)) (Resource Conservation and Recovery Act (tracking hazardous waste))
CON ED - V 7752 (W/S 39TH ST 77 N/O 43RD AVE in SUNNYSIDE, NY)
HAZARDOUS WASTE BIENNIAL REPORTER (Resource Conservation and Recovery Act (tracking hazardous waste)) (Resource Conservation and Recovery Act (tracking hazardous waste))
Housing units lacking complete plumbing facilities: 0.4% Housing units lacking complete kitchen facilities: 1.2%
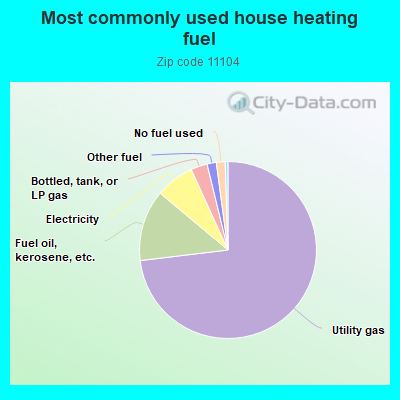
73.1%Utility gas
13.0%Fuel oil, kerosene, etc.
7.1%Electricity
3.0%Bottled, tank, or LP gas
1.7%Other fuel
1.6%No fuel used
Population in 1990: 25,898. Population change in the 1990s: +3,608 (+13.9%).
Place of birth for U.S.-born residents:
This state: 9,972
Northeast: 1,209
Midwest: 663
South: 1,023
West: 689
68% of the 11104 zip code residents lived in the same house 5 years ago. Out of people who lived in different houses, 68% lived in this county. Out of people who lived in different counties, 50% lived in New York.
89% of the 11104 zip code residents lived in the same house 1 year ago. Out of people who lived in different houses, 48% moved from this county. Out of people who lived in different houses, 28% moved from different county within same state. Out of people who lived in different houses, 18% moved from different state. Out of people who lived in different houses, 6% moved from abroad.
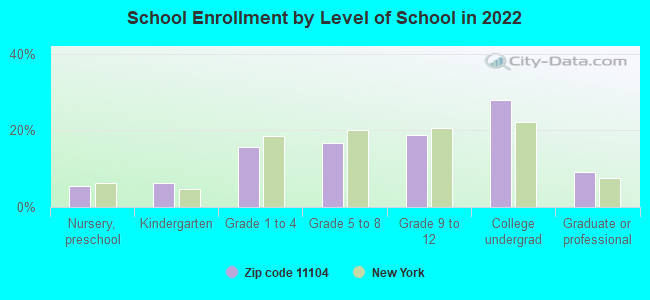
Private vs. public school enrollment:
Students in private schools in grades 1 to 8 (elementary and middle school): 123
Here:
7.8%
New York:
15.6%
Students in private schools in grades 9 to 12 (high school): 83
Here:
9.1%
New York:
15.0%
Students in private undergraduate colleges: 548
Here:
39.8%
New York:
39.2%
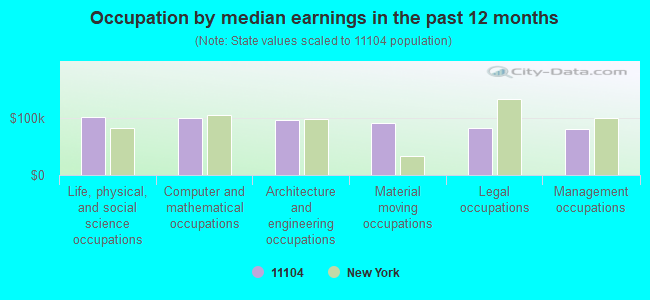
Occupation by median earnings in the past 12 months ($)
101,888Life, physical, and social science occupations
100,226Computer and mathematical occupations
96,415Architecture and engineering occupations
90,405Material moving occupations
81,360Legal occupations
80,430Management occupations
Top industries in this zip code by the number of employees in 2005:
Health Care and Social Assistance: Home Health Care Services (over 1000 employees: 1 establishment, 10-19 employees: 1 establishment, 1-4 employees: 1 establishment)
2007 - 2018 National Fire Incident Reporting System (NFIRS) incidents
Based on the data from the years 2007 - 2018 the average number of fires per year is 56. The highest number of fires - 70 took place in 2009, and the least - 45 in 2012. The data has a dropping trend.
When looking into fire subcategories, the most incidents belonged to: Structure Fires (69.1%), and Outside Fires (17.9%).
Fire incident types reported to NFIRS in Zip Code 11104


 Nearest zip codes: 11377, 11103, 11101, 11106, 11378, 11102.


 Based on the data from the years 2007 - 2018 the average number of fires per year is 56. The highest number of fires - 70 took place in 2009, and the least - 45 in 2012. The data has a dropping trend.
 When looking into fire subcategories, the most incidents belonged to: Structure Fires (69.1%), and Outside Fires (17.9%).