Estimated zip code population in 2022: 27,717 Zip code population in 2010: 39,688 Zip code population in 2000: 43,142
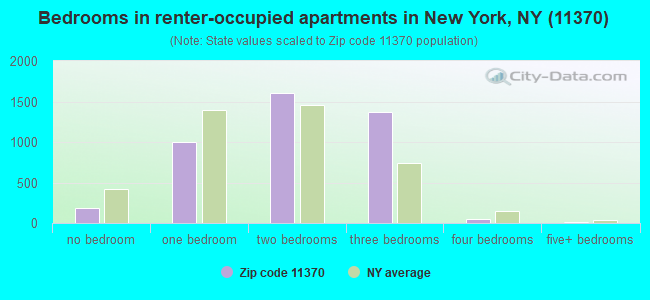
Houses and condos: 11,862 Renter-occupied apartments: 4,239
% of renters here:
51%
State:
46%
March 2022 cost of living index in zip code 11370: 157.4 (very high, U.S. average is 100)
Land area: 1.4 sq. mi. Water area: 0.0 sq. mi.
Population density: 19,500 people per square mile
(very high).
OSM Map
General Map
Google Map
MSN Map
OSM Map
General Map
Google Map
MSN Map
OSM Map
General Map
Google Map
MSN Map
OSM Map
General Map
Google Map
MSN Map
Please wait while loading the map...
Real estate property taxes paid for housing units in 2022:
This zip code:
0.8% ($6,683)
New York:
1.5% ($6,180)
Median real estate property taxes paid for housing units with mortgages in 2022: $6,615 (0.7%) Median real estate property taxes paid for housing units with no mortgage in 2022: $6,764 (0.8%)
Averages for the 2020 tax year for zip code 11370, filed in 2021:
Average Adjusted Gross Income (AGI) in 2020: $46,253 (Individual Income Tax Returns)
Here:
$46,253
State:
$90,930
Salary/wage: $47,114 (reported on 70.4% of returns)
Here:
$47,114
State:
$72,104
(% of AGI for various income ranges: 873.1% for AGIs below $25k, 3146.7% for AGIs $25k-50k, 6711.3% for AGIs $50k-75k, 10559.6% for AGIs $75k-100k, 19247.3% for AGIs $100k-200k, 60512.2% for AGIs over 200k)
Taxable interest for individuals: $1,182 (reported on 22.7% of returns)
This zip code:
$1,182
New York:
$3,075
(% of AGI for various income ranges: 14.6% for AGIs below $25k, 20.3% for AGIs $25k-50k, 39.6% for AGIs $50k-75k, 79.4% for AGIs $75k-100k, 159.0% for AGIs $100k-200k, 593.3% for AGIs over 200k)
Ordinary dividends: $3,243 (reported on 12.2% of returns)
Here:
$3,243
State:
$11,095
(% of AGI for various income ranges: 12.8% for AGIs below $25k, 18.2% for AGIs $25k-50k, 42.0% for AGIs $50k-75k, 113.6% for AGIs $75k-100k, 252.6% for AGIs $100k-200k, 1700.0% for AGIs over 200k)
Net capital gain/loss in AGI: +$6,969 (reported on 13.3% of returns)
Here:
+$6,969
State:
+$44,925
(% of AGI for various income ranges: 2.0% for AGIs below $25k, 32.2% for AGIs $25k-50k, 58.4% for AGIs $50k-75k, 128.5% for AGIs $75k-100k, 418.4% for AGIs $100k-200k, 8514.4% for AGIs over 200k)
Profit/loss from business: +$7,979 (reported on 28.9% of returns)
Here:
+$7,979
State:
+$14,940
(% of AGI for various income ranges: 425.0% for AGIs below $25k, 329.0% for AGIs $25k-50k, 198.5% for AGIs $50k-75k, 349.6% for AGIs $75k-100k, 351.8% for AGIs $100k-200k, 1927.8% for AGIs over 200k)
Taxable individual retirement arrangement distribution: $13,314 (reported on 3.5% of returns)
11370:
$13,314
New York:
$19,609
(% of AGI for various income ranges: 23.6% for AGIs below $25k, 41.3% for AGIs $25k-50k, 67.3% for AGIs $50k-75k, 163.7% for AGIs $75k-100k, 250.0% for AGIs $100k-200k, 955.6% for AGIs over 200k)
Total itemized deductions: $26,915 (reported on 6.0% of returns)
Here:
$26,915
State:
$39,326
(% of AGI for various income ranges: 44.0% for AGIs below $25k, 87.3% for AGIs $25k-50k, 242.0% for AGIs $50k-75k, 516.7% for AGIs $75k-100k, 1204.3% for AGIs $100k-200k, 4036.7% for AGIs over 200k)
Charity contributions: $4,564 (reported on 4.6% of returns)
Here:
$4,564
State:
$15,420
(% of AGI for various income ranges: 2.0% for AGIs below $25k, 7.5% for AGIs $25k-50k, 23.1% for AGIs $50k-75k, 65.2% for AGIs $75k-100k, 174.8% for AGIs $100k-200k, 753.3% for AGIs over 200k)
Taxes paid: $8,692 (reported on 6.0% of returns)
11370:
$8,692
State:
$9,183
(% of AGI for various income ranges: 10.7% for AGIs below $25k, 27.7% for AGIs $25k-50k, 81.7% for AGIs $50k-75k, 185.1% for AGIs $75k-100k, 398.4% for AGIs $100k-200k, 1181.1% for AGIs over 200k)
Earned income credit: $1,941 (reported on 19.3% of returns)
Here:
$1,941
State:
$2,138
(% of AGI for various income ranges: 89.0% for AGIs below $25k, 83.2% for AGIs $25k-50k, 1.3% for AGIs $50k-75k)
Percentage of individuals using paid preparers for their 2020 taxes: 92.4%
Here:
92%
State:
95%
(% for various income ranges: 88.7% for AGIs below $25k, 95.7% for AGIs $25k-50k, 94.2% for AGIs $50k-75k, 94.2% for AGIs $75k-100k, 95.6% for AGIs $100k-200k, 96.4% for AGIs over 200k)
Averages for the 2012 tax year for zip code 11370, filed in 2013:
Average Adjusted Gross Income (AGI) in 2012: $40,290 (Individual Income Tax Returns)
Here:
$40,290
State:
$77,088
Salary/wage: $42,475 (reported on 73.8% of returns)
Here:
$42,475
State:
$60,593
(% of AGI for various income ranges: 58.3% for AGIs below $25k, 84.0% for AGIs $25k-50k, 85.4% for AGIs $50k-75k, 85.3% for AGIs $75k-100k, 81.3% for AGIs $100k-200k, 56.8% for AGIs over 200k)
Taxable interest for individuals: $1,082 (reported on 27.6% of returns)
This zip code:
$1,082
New York:
$3,125
(% of AGI for various income ranges: 1.0% for AGIs below $25k, 0.5% for AGIs $25k-50k, 0.7% for AGIs $50k-75k, 0.6% for AGIs $75k-100k, 0.9% for AGIs $100k-200k, 0.7% for AGIs over 200k)
Ordinary dividends: $3,216 (reported on 11.9% of returns)
Here:
$3,216
State:
$10,299
(% of AGI for various income ranges: 0.8% for AGIs below $25k, 0.7% for AGIs $25k-50k, 0.8% for AGIs $50k-75k, 0.7% for AGIs $75k-100k, 1.0% for AGIs $100k-200k, 2.6% for AGIs over 200k)
Net capital gain/loss in AGI: +$3,064 (reported on 9.3% of returns)
Here:
+$3,064
State:
+$42,474
(% of AGI for various income ranges: 0.3% for AGIs $75k-100k, 0.8% for AGIs $100k-200k, 6.6% for AGIs over 200k)
Profit/loss from business: +$11,084 (reported on 26.3% of returns)
Here:
+$11,084
State:
+$16,168
(% of AGI for various income ranges: 31.6% for AGIs below $25k, 7.1% for AGIs $25k-50k, 2.2% for AGIs $50k-75k, 1.8% for AGIs $75k-100k, 2.1% for AGIs $100k-200k)
Taxable individual retirement arrangement distribution: $10,133 (reported on 5.4% of returns)
11370:
$10,133
New York:
$17,621
(% of AGI for various income ranges: 1.5% for AGIs below $25k, 1.2% for AGIs $25k-50k, 1.3% for AGIs $50k-75k, 1.3% for AGIs $75k-100k, 1.9% for AGIs $100k-200k)
Total itemized deductions: $20,435 (26% of AGI, reported on 28.9% of returns)
Here:
$20,435
State:
$34,985
Here:
26.0% of AGI
State:
21.3% of AGI
(% of AGI for various income ranges: 6.9% for AGIs below $25k, 13.3% for AGIs $25k-50k, 15.4% for AGIs $50k-75k, 17.9% for AGIs $75k-100k, 18.3% for AGIs $100k-200k, 14.5% for AGIs over 200k)
Charity contributions: $1,987 (reported on 22.8% of returns)
Here:
$1,987
State:
$5,572
(% of AGI for various income ranges: 0.3% for AGIs below $25k, 1.0% for AGIs $25k-50k, 1.4% for AGIs $50k-75k, 1.4% for AGIs $75k-100k, 1.4% for AGIs $100k-200k, 1.1% for AGIs over 200k)
Taxes paid: $8,676 (reported on 28.6% of returns)
11370:
$8,676
State:
$18,656
(% of AGI for various income ranges: 1.6% for AGIs below $25k, 3.1% for AGIs $25k-50k, 6.1% for AGIs $50k-75k, 8.2% for AGIs $75k-100k, 9.6% for AGIs $100k-200k, 9.7% for AGIs over 200k)
Earned income credit: $2,291 (reported on 25.5% of returns)
Here:
$2,291
State:
$2,230
(% of AGI for various income ranges: 8.3% for AGIs below $25k, 1.2% for AGIs $25k-50k)
Percentage of individuals using paid preparers for their 2012 taxes: 77.8%
Here:
78%
State:
66%
(% for various income ranges: 76.6% for AGIs below $25k, 79.5% for AGIs $25k-50k, 77.6% for AGIs $50k-75k, 77.3% for AGIs $75k-100k, 80.9% for AGIs $100k-200k, 76.9% for AGIs over 200k)
Averages for the 2004 tax year for zip code 11370, filed in 2005:
Average Adjusted Gross Income (AGI) in 2004: $35,584 (Individual Income Tax Returns)
Here:
$35,584
State:
$59,519
Salary/wage: $37,472 (reported on 76.1% of returns)
Here:
$37,472
State:
$50,673
(% of AGI for various income ranges: 63.2% for AGIs below $10k, 66.7% for AGIs $10k-25k, 87.6% for AGIs $25k-50k, 87.1% for AGIs $50k-75k, 85.3% for AGIs $75k-100k, 70.9% for AGIs over 100k)
Taxable interest for individuals: $1,248 (reported on 46.3% of returns)
This zip code:
$1,248
New York:
$2,377
(% of AGI for various income ranges: 5.2% for AGIs below $10k, 1.9% for AGIs $10k-25k, 1.1% for AGIs $25k-50k, 1.2% for AGIs $50k-75k, 1.2% for AGIs $75k-100k, 2.3% for AGIs over 100k)
Taxable dividends: $1,987 (reported on 18.1% of returns)
Here:
$1,987
State:
$5,394
(% of AGI for various income ranges: 2.9% for AGIs below $10k, 1.1% for AGIs $10k-25k, 0.6% for AGIs $25k-50k, 0.7% for AGIs $50k-75k, 1.1% for AGIs $75k-100k, 1.4% for AGIs over 100k)
Net capital gain/loss: +$7,489 (reported on 12.8% of returns)
Here:
+$7,489
State:
+$23,581
(% of AGI for various income ranges: 2.8% for AGIs below $10k, -0.2% for AGIs $10k-25k, 0.2% for AGIs $25k-50k, 0.7% for AGIs $50k-75k, 0.5% for AGIs $75k-100k, 10.9% for AGIs over 100k)
Profit/loss from business: +$9,225 (reported on 22.9% of returns)
Here:
+$9,225
State:
+$13,809
(% of AGI for various income ranges: 40.7% for AGIs below $10k, 21.6% for AGIs $10k-25k, 4.3% for AGIs $25k-50k, 2.0% for AGIs $50k-75k, 1.0% for AGIs $75k-100k, 1.0% for AGIs over 100k)
IRA payment deduction: $3,213 (reported on 3.4% of returns)
11370:
$3,213
New York:
$3,115
(% of AGI for various income ranges: 0.3% for AGIs below $10k, 0.3% for AGIs $10k-25k, 0.4% for AGIs $25k-50k, 0.3% for AGIs $50k-75k, 0.4% for AGIs $75k-100k, 0.2% for AGIs over 100k)
Self-employed pension: $7,833 (reported on 0.3% of returns)
Here:
$7,833
New York:
$19,016
Total itemized deductions: $17,394 (27% of AGI, reported on 34.7% of returns)
Here:
$17,394
State:
$25,864
Here:
27.5% of AGI
State:
21.9% of AGI
(% of AGI for various income ranges: 13.9% for AGIs below $10k, 11.3% for AGIs $10k-25k, 17.5% for AGIs $25k-50k, 19.2% for AGIs $50k-75k, 18.4% for AGIs $75k-100k, 16.9% for AGIs over 100k)
Charity contributions deductions: $2,142 (3% of AGI, reported on 30.8% of returns)
Here:
$2,142
State:
$4,439
Here:
3.2% of AGI
State:
3.6% of AGI
(% of AGI for various income ranges: 0.4% for AGIs below $10k, 1.0% for AGIs $10k-25k, 1.9% for AGIs $25k-50k, 2.3% for AGIs $50k-75k, 2.2% for AGIs $75k-100k, 1.8% for AGIs over 100k)
Total tax: $4,564 (reported on 75.6% of returns)
11370:
$4,564
State:
$11,730
(% of AGI for various income ranges: 6.6% for AGIs below $10k, 5.3% for AGIs $10k-25k, 6.6% for AGIs $25k-50k, 9.5% for AGIs $50k-75k, 10.9% for AGIs $75k-100k, 16.0% for AGIs over 100k)
Earned income credit: $1,740 (reported on 21.6% of returns)
Here:
$1,740
State:
$1,757
Percentage of individuals using paid preparers for their 2004 taxes: 74.6%
Here:
75%
State:
67%
(% for various income ranges: 72.0% for AGIs below $10k, 75.8% for AGIs $10k-25k, 74.8% for AGIs $25k-50k, 74.9% for AGIs $50k-75k, 75.7% for AGIs $75k-100k, 76.5% for AGIs over 100k)
Household received Food Stamps/SNAP in the past 12 months: 1,160 Household did not receive Food Stamps/SNAP in the past 12 months: 7,138
Women who had a birth in the past 12 months: 136 (111 now married, 24 unmarried) Women who did not have a birth in the past 12 months: 5,869 (2,301 now married, 3,559 unmarried)
Housing units in zip code 11370 with a mortgage: 1,886 (75 second mortgage, 3 home equity loan, 72 both second mortgage and home equity loan) Houses without a mortgage: 71
Median monthly owner costs for units with a mortgage: $3,090 Median monthly owner costs for units without a mortgage: $1,102
Residents with income below the poverty level in 2022:
This zip code:
10.9%
Whole state:
14.3%
Residents with income below 50% of the poverty level in 2022:
This zip code:
5.1%
Whole state:
6.8%
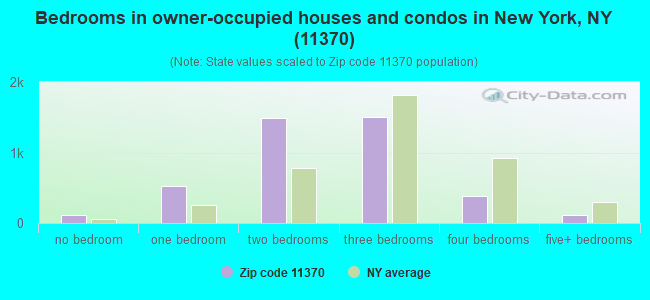
Median number of rooms in houses and condos:
Here:
4.6
State:
6.3
Median number of rooms in apartments:
Here:
4.1
State:
3.8
Notable locations in this zip code not listed on our city pages
Notable locations in zip code 11370: Fire Department New York Engine 307 Ladder 154 (A), New York Ladder Company 154 (B). Display/hide their locations on the map
Churches in zip code 11370 include: Our Lady of Fatima Church (A), Islamic Center of Jackson Heights (B), Augustana Evangelical Lutheran Church (C). Display/hide their locations on the map
2,939 married couples with children.
598 single-parent households (179 men, 419 women).
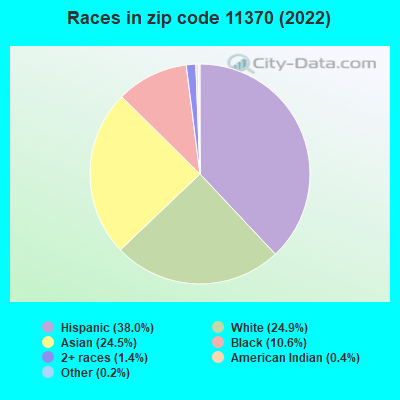
36.7% of residents of 11370 zip code speak English at home.
32.1% of residents speak Spanish at home (42% very well, 28% well, 20% not well, 10% not at all).
17.2% of residents speak other Indo-European language at home (58% very well, 28% well, 13% not well, 1% not at all).
10.8% of residents speak Asian or Pacific Island language at home (34% very well, 22% well, 36% not well, 8% not at all).
3.2% of residents speak other language at home (66% very well, 7% well, 26% not well, 1% not at all).
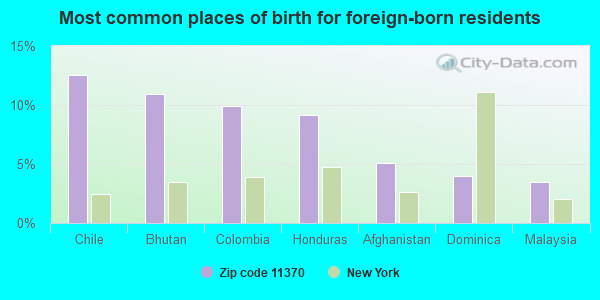
Foreign born population: 12,495 (45.1%) (63.6% of them are naturalized citizens)
This zip code:
45.1%
Whole state:
22.7%
13%Chile
11%Bhutan
10%Colombia
9%Honduras
5%Afghanistan
4%Dominica
4%Malaysia
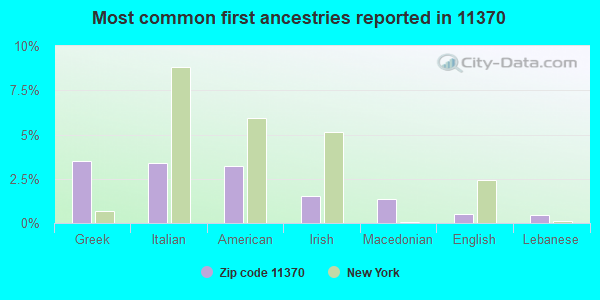
4%Greek
3%Italian
3%American
2%Irish
1%Macedonian
1%English
0%Lebanese
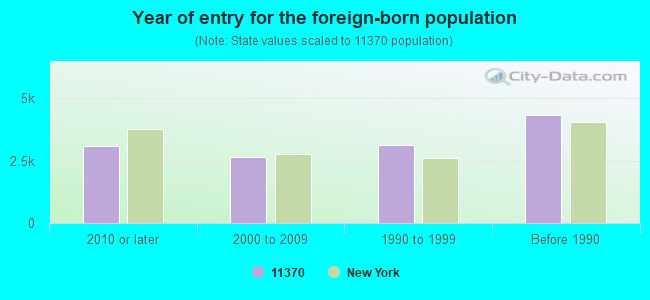
Year of entry for the foreign-born population
3,0722010 or later
2,6272000 to 2009
3,1271990 to 1999
4,327Before 1990
Facilities with environmental interests located in this zip code:
GEORGE MOCHAN DETENTION CENTER (15-15 EAST HAZEN STREET in EAST ELMHURST, NY)
(Integrated Compliance Information System) - ICIS-02-2003-1214, FORMAL ENFORCEMENT ACTION (Integrated Compliance Information System) - ICIS-02-1999-1048, FORMAL ENFORCEMENT ACTION Small Quantity Generators, between 100 kg and 1000 kg of hazardous waste/month (Resource Conservation and Recovery Act (tracking hazardous waste)) Business SIC classification: SPECIAL TRADE CONTRACTORS Organizations: NYC DEPT OF CORRECTIONS (CONTACT/OPERATOR)
Alternative names: NYC CORRECTIONAL INSTITUTION FOR WOMEN
HI-STYLE CLEANERS (75-39 31ST AVENUE in EAST ELMHURST, NY)
AIR MINOR (AIRS/AFS) STATE MASTER (New York facility tracking) - AIR PROGRAM Small Quantity Generators, between 100 kg and 1000 kg of hazardous waste/month (Resource Conservation and Recovery Act (tracking hazardous waste)) Business SIC classification: DRYCLEANING PLANTS, EXCEPT RUG CLEANING Business NAICS classification: DRYCLEANING AND LAUNDRY SERVICES (EXCEPT COIN-OPERATED). Organizations: HI STYLE CLEANERS (LEGALLY RESPONSIBLE PARTY)
Alternative names: HENRI HI STYLE CLEANERS INC
STATE MASTER (New York facility tracking) - AIR PROGRAM ENFORCEMENT/COMPLIANCE ACTIVITY (Integrated Compliance Information System) Organizations: GLOBE FUEL OIL CORPORATION (LEGALLY RESPONSIBLE PARTY)
HORIZONS ACAD ( in EAST ELMHURST, NY)
(National Center for Education Statistics) - STATE ID-347700010565 Organizations: NEW YORK CITY PUBLIC SCHOOLS (SCHOOL DISTRICT)
ISLAND ACAD ( in EAST ELMHURST, NY)
(National Center for Education Statistics) - STATE ID-347700010535 Organizations: NEW YORK CITY PUBLIC SCHOOLS (SCHOOL DISTRICT)
CORRECTIONAL INSTITUTE FOR MEN ( in EAST ELMHURST, NY)
(National Center for Education Statistics) - STATE ID-342400950003 Organizations: NEW YORK CITY PUBLIC SCHOOLS (SCHOOL DISTRICT)
CITYGAS CORP (83-10 ASTORIA BLVD in QUEENS, NY)
(Integrated Compliance Information System) - ICIS-02-2001-0004, FORMAL ENFORCEMENT ACTION Business SIC classification: GASOLINE SERVICE STATIONS
84TH STREET FORMAL WEAR (84-02 ASTORIA BLVD in EAST ELMHURST, NY)
AIR MINOR (AIRS/AFS) Small Quantity Generators, between 100 kg and 1000 kg of hazardous waste/month (Resource Conservation and Recovery Act (tracking hazardous waste)) - notification Business SIC classification: DRYCLEANING PLANTS, EXCEPT RUG CLEANING Organizations: PATRICK MURPHY (CONTACT/OWNER)
Alternative names: 84 STREET DRY CLEANERS
ASTORIA AUTO SVCE CTR-49-05 ASTORIA BLVD (49-05 ASTORIA BOULEVARD in EAST ELMHURST, NY)
AIR MINOR (AIRS/AFS) Conditionally Exempt Small Quantity Generators, less than 100 kg/month of hazardous waste (Resource Conservation and Recovery Act (tracking hazardous waste)) - notification Business SIC classification: GASOLINE SERVICE STATIONS Organizations: SUN CO INC (R&M) (CONTACT/OWNER)
Alternative names: SUNOCO SERVICE STATION
CON EDISON - MH 14981 (CALDWELL ST & 71 ST in EAST ELMHURST, NY)
Large Quantity Generators, more that 1000 kg of hazardous waste/month (Resource Conservation and Recovery Act (tracking hazardous waste)) Organizations: CONSOLIDATED EDISON COMPANY OF NY, INC. (CONTACT/OPERATOR)
HOME DEPOT USA INC HD1253 (73-01 25TH AVE in EAST ELMHURST, NY)
Conditionally Exempt Small Quantity Generators, less than 100 kg/month of hazardous waste (Resource Conservation and Recovery Act (tracking hazardous waste)) Alternative names: HOME DEPOT THE #1253
CONTROL DATA CORP (49-05 20TH AVE in EAST ELMHURST, NY)
(Resource Conservation and Recovery Act (tracking hazardous waste))
GETTY PETROLEUM CORP (76-19 21ST AVE in EAST ELMHURST, NY)
Small Quantity Generators, between 100 kg and 1000 kg of hazardous waste/month (Resource Conservation and Recovery Act (tracking hazardous waste)) - notification
Housing units lacking complete plumbing facilities: 5.7% Housing units lacking complete kitchen facilities: 6.3%
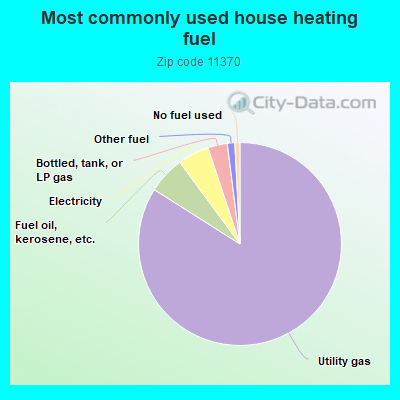
84.0%Utility gas
5.9%Fuel oil, kerosene, etc.
5.0%Electricity
3.1%Bottled, tank, or LP gas
1.2%Other fuel
0.8%No fuel used
Population in 1990: 23,910. Population change in the 1990s: +19,232 (+80.4%).
Place of birth for U.S.-born residents:
This state: 12,936
Northeast: 584
Midwest: 138
South: 439
West: 369
55% of the 11370 zip code residents lived in the same house 5 years ago. Out of people who lived in different houses, 43% lived in this county. Out of people who lived in different counties, 50% lived in New York.
85% of the 11370 zip code residents lived in the same house 1 year ago. Out of people who lived in different houses, 46% moved from this county. Out of people who lived in different houses, 48% moved from different county within same state. Out of people who lived in different houses, 3% moved from different state. Out of people who lived in different houses, 3% moved from abroad.
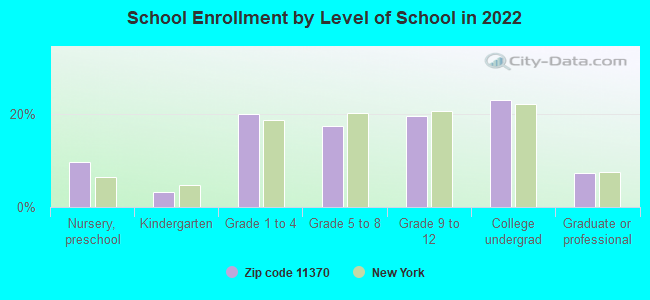
Private vs. public school enrollment:
Students in private schools in grades 1 to 8 (elementary and middle school): 174
Here:
8.8%
New York:
15.6%
Students in private schools in grades 9 to 12 (high school): 70
Here:
6.8%
New York:
15.0%
Students in private undergraduate colleges: 205
Here:
17.1%
New York:
39.2%
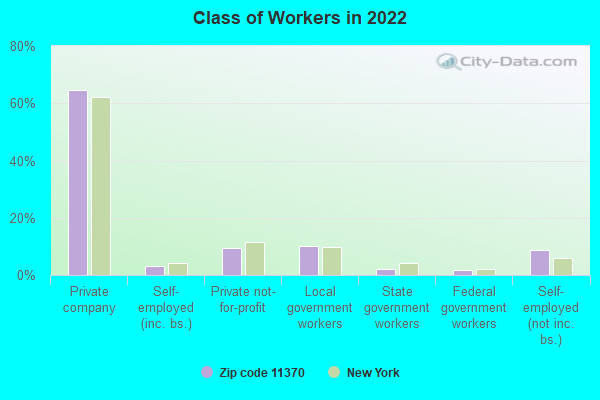
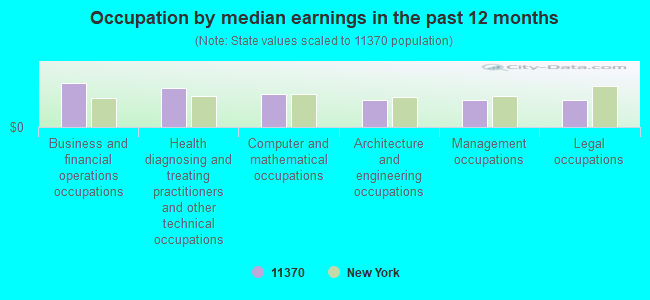
Occupation by median earnings in the past 12 months ($)
118,469Business and financial operations occupations
105,605Health diagnosing and treating practitioners and other technical occupations
88,093Computer and mathematical occupations
72,054Architecture and engineering occupations
71,561Management occupations
71,545Legal occupations
Top industries in this zip code by the number of employees in 2005:
Health Care and Social Assistance: Home Health Care Services (500-999 employees: 1 establishment)
Real Estate and Rental and Leasing: Passenger Car Rental (100-249: 1, 1-4: 4)
Other Services (except Public Administration): Other Personal and Household Goods Repair and Maintenance (100-249: 1, 1-4: 2)
2007 - 2018 National Fire Incident Reporting System (NFIRS) incidents
According to the data from the years 2007 - 2018 the average number of fire incidents per year is 53. The highest number of reported fires - 65 took place in 2008, and the least - 24 in 2007. The data has an increasing trend.
When looking into fire subcategories, the most reports belonged to: Structure Fires (62.0%), and Outside Fires (20.5%).
Fire incident types reported to NFIRS in Zip Code 11370

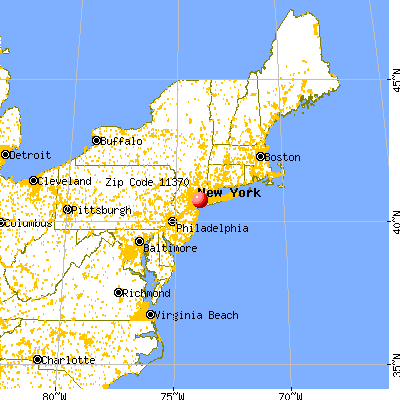


 Nearest zip codes: 11372, 11105, 11103, 11369, 11371, 11377.


 According to the data from the years 2007 - 2018 the average number of fire incidents per year is 53. The highest number of reported fires - 65 took place in 2008, and the least - 24 in 2007. The data has an increasing trend.
 When looking into fire subcategories, the most reports belonged to: Structure Fires (62.0%), and Outside Fires (20.5%).