Estimated zip code population in 2022: 37,519 Zip code population in 2010: 34,555 Zip code population in 2000: 34,539
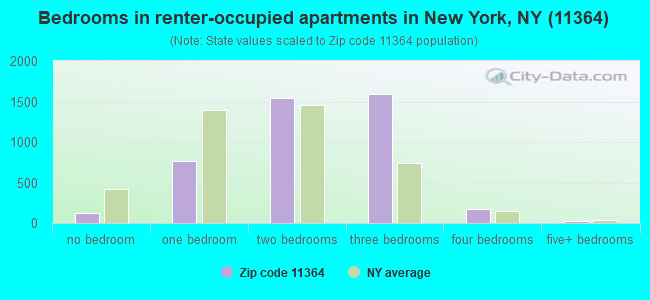
Houses and condos: 14,702 Renter-occupied apartments: 4,243
% of renters here:
30%
State:
46%
March 2022 cost of living index in zip code 11364: 151.3 (very high, U.S. average is 100)
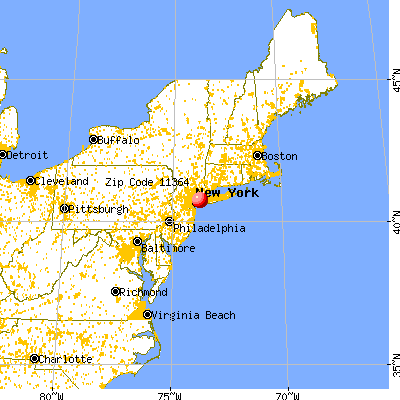
Land area: 2.5 sq. mi. Water area: 0.0 sq. mi.
Population density: 15,198 people per square mile
(very high).
OSM Map
General Map
Google Map
MSN Map
OSM Map
General Map
Google Map
MSN Map
OSM Map
General Map
Google Map
MSN Map
OSM Map
General Map
Google Map
MSN Map
Please wait while loading the map...
Real estate property taxes paid for housing units in 2022:
This zip code:
0.9% ($7,453)
New York:
1.5% ($6,180)
Median real estate property taxes paid for housing units with mortgages in 2022: $7,999 (0.9%) Median real estate property taxes paid for housing units with no mortgage in 2022: $6,762 (1.0%)
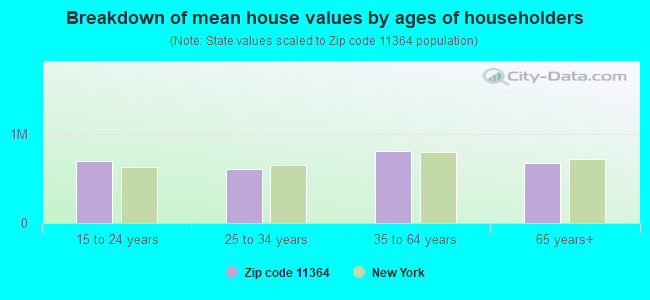
Estimated median house/condo value in 2022: $790,480
11364:
$790,480
New York:
$400,400
According to our research of New York and other state lists, there were 6 registered sex offenders living in 11364 zip code as of April 27, 2024. The ratio of all residents to sex offenders in zip code 11364 is 5,929 to 1. The ratio of registered sex offenders to all residents in this zip code is much lower than the state average.
Median resident age:
This zip code:
45.6 years
New York median age:
40.0 years
Average household size:
This zip code:
2.6 people
New York:
2.5 people
Averages for the 2020 tax year for zip code 11364, filed in 2021:
Average Adjusted Gross Income (AGI) in 2020: $69,465 (Individual Income Tax Returns)
Here:
$69,465
State:
$90,930
Salary/wage: $63,820 (reported on 76.9% of returns)
Here:
$63,820
State:
$72,104
(% of AGI for various income ranges: 1008.4% for AGIs below $25k, 3257.8% for AGIs $25k-50k, 6731.8% for AGIs $50k-75k, 9966.2% for AGIs $75k-100k, 18841.3% for AGIs $100k-200k, 78816.8% for AGIs over 200k)
Taxable interest for individuals: $1,724 (reported on 41.7% of returns)
This zip code:
$1,724
New York:
$3,075
(% of AGI for various income ranges: 36.5% for AGIs below $25k, 57.3% for AGIs $25k-50k, 75.9% for AGIs $50k-75k, 137.4% for AGIs $75k-100k, 233.2% for AGIs $100k-200k, 1210.0% for AGIs over 200k)
Ordinary dividends: $4,475 (reported on 28.0% of returns)
Here:
$4,475
State:
$11,095
(% of AGI for various income ranges: 38.1% for AGIs below $25k, 59.4% for AGIs $25k-50k, 128.2% for AGIs $50k-75k, 171.5% for AGIs $75k-100k, 464.8% for AGIs $100k-200k, 2829.6% for AGIs over 200k)
Net capital gain/loss in AGI: +$9,937 (reported on 27.1% of returns)
Here:
+$9,937
State:
+$44,925
(% of AGI for various income ranges: 6.1% for AGIs below $25k, 61.7% for AGIs $25k-50k, 140.2% for AGIs $50k-75k, 251.0% for AGIs $75k-100k, 662.6% for AGIs $100k-200k, 11221.4% for AGIs over 200k)
Profit/loss from business: +$10,953 (reported on 17.9% of returns)
Here:
+$10,953
State:
+$14,940
(% of AGI for various income ranges: 206.8% for AGIs below $25k, 255.0% for AGIs $25k-50k, 212.5% for AGIs $50k-75k, 197.9% for AGIs $75k-100k, 381.6% for AGIs $100k-200k, 3167.9% for AGIs over 200k)
Taxable individual retirement arrangement distribution: $16,587 (reported on 8.3% of returns)
11364:
$16,587
New York:
$19,609
(% of AGI for various income ranges: 62.3% for AGIs below $25k, 93.9% for AGIs $25k-50k, 196.8% for AGIs $50k-75k, 222.2% for AGIs $75k-100k, 449.4% for AGIs $100k-200k, 2387.9% for AGIs over 200k)
Self-employed (Keogh) retirement plans: $26,186 (reported on 0.4% of returns)
11364:
$26,186
New York:
$32,497
(% of AGI for various income ranges: 31.0% for AGIs $100k-200k, 462.1% for AGIs over 200k)
Total itemized deductions: $26,421 (reported on 12.4% of returns)
Here:
$26,421
State:
$39,326
(% of AGI for various income ranges: 75.9% for AGIs below $25k, 223.8% for AGIs $25k-50k, 465.3% for AGIs $50k-75k, 710.6% for AGIs $75k-100k, 1333.3% for AGIs $100k-200k, 4276.8% for AGIs over 200k)
Charity contributions: $4,842 (reported on 9.5% of returns)
Here:
$4,842
State:
$15,420
(% of AGI for various income ranges: 3.3% for AGIs below $25k, 18.3% for AGIs $25k-50k, 52.8% for AGIs $50k-75k, 84.9% for AGIs $75k-100k, 207.6% for AGIs $100k-200k, 853.6% for AGIs over 200k)
Taxes paid: $9,181 (reported on 12.4% of returns)
11364:
$9,181
State:
$9,183
(% of AGI for various income ranges: 20.6% for AGIs below $25k, 70.0% for AGIs $25k-50k, 174.8% for AGIs $50k-75k, 291.7% for AGIs $75k-100k, 481.6% for AGIs $100k-200k, 1246.8% for AGIs over 200k)
Earned income credit: $1,887 (reported on 15.7% of returns)
Here:
$1,887
State:
$2,138
(% of AGI for various income ranges: 83.4% for AGIs below $25k, 84.4% for AGIs $25k-50k, 0.5% for AGIs $50k-75k)
Percentage of individuals using paid preparers for their 2020 taxes: 94.8%
Here:
95%
State:
95%
(% for various income ranges: 93.2% for AGIs below $25k, 96.1% for AGIs $25k-50k, 95.3% for AGIs $50k-75k, 95.8% for AGIs $75k-100k, 95.3% for AGIs $100k-200k, 95.1% for AGIs over 200k)
Averages for the 2012 tax year for zip code 11364, filed in 2013:
Average Adjusted Gross Income (AGI) in 2012: $63,494 (Individual Income Tax Returns)
Here:
$63,494
State:
$77,088
Salary/wage: $60,466 (reported on 79.0% of returns)
Here:
$60,466
State:
$60,593
(% of AGI for various income ranges: 63.1% for AGIs below $25k, 76.3% for AGIs $25k-50k, 80.6% for AGIs $50k-75k, 79.8% for AGIs $75k-100k, 79.3% for AGIs $100k-200k, 62.9% for AGIs over 200k)
Taxable interest for individuals: $1,296 (reported on 51.1% of returns)
This zip code:
$1,296
New York:
$3,125
(% of AGI for various income ranges: 2.7% for AGIs below $25k, 1.2% for AGIs $25k-50k, 1.0% for AGIs $50k-75k, 0.9% for AGIs $75k-100k, 0.9% for AGIs $100k-200k, 0.8% for AGIs over 200k)
Ordinary dividends: $4,217 (reported on 28.6% of returns)
Here:
$4,217
State:
$10,299
(% of AGI for various income ranges: 2.9% for AGIs below $25k, 1.7% for AGIs $25k-50k, 1.6% for AGIs $50k-75k, 1.4% for AGIs $75k-100k, 1.6% for AGIs $100k-200k, 3.0% for AGIs over 200k)
Net capital gain/loss in AGI: +$4,203 (reported on 23.8% of returns)
Here:
+$4,203
State:
+$42,474
(% of AGI for various income ranges: 0.6% for AGIs $100k-200k, 7.7% for AGIs over 200k)
Profit/loss from business: +$14,529 (reported on 18.0% of returns)
Here:
+$14,529
State:
+$16,168
(% of AGI for various income ranges: 18.8% for AGIs below $25k, 6.3% for AGIs $25k-50k, 2.3% for AGIs $50k-75k, 2.0% for AGIs $75k-100k, 2.1% for AGIs $100k-200k, 4.8% for AGIs over 200k)
Taxable individual retirement arrangement distribution: $12,811 (reported on 10.1% of returns)
11364:
$12,811
New York:
$17,621
(% of AGI for various income ranges: 3.9% for AGIs below $25k, 2.6% for AGIs $25k-50k, 1.8% for AGIs $50k-75k, 1.8% for AGIs $75k-100k, 2.0% for AGIs $100k-200k, 1.5% for AGIs over 200k)
Self-employment retirement plans: $18,645 (reported on 0.6% of returns)
11364:
$18,645
New York:
$27,330
(% of AGI for various income ranges: 0.2% for AGIs $50k-75k, 0.2% for AGIs $100k-200k, 0.5% for AGIs over 200k)
Total itemized deductions: $24,294 (23% of AGI, reported on 45.9% of returns)
Here:
$24,294
State:
$34,985
Here:
23.4% of AGI
State:
21.3% of AGI
(% of AGI for various income ranges: 12.5% for AGIs below $25k, 14.8% for AGIs $25k-50k, 17.7% for AGIs $50k-75k, 19.1% for AGIs $75k-100k, 19.6% for AGIs $100k-200k, 15.9% for AGIs over 200k)
Charity contributions: $2,573 (reported on 38.3% of returns)
Here:
$2,573
State:
$5,572
(% of AGI for various income ranges: 0.6% for AGIs below $25k, 1.0% for AGIs $25k-50k, 1.7% for AGIs $50k-75k, 1.7% for AGIs $75k-100k, 1.8% for AGIs $100k-200k, 1.4% for AGIs over 200k)
Taxes paid: $12,184 (reported on 45.8% of returns)
11364:
$12,184
State:
$18,656
(% of AGI for various income ranges: 3.5% for AGIs below $25k, 5.1% for AGIs $25k-50k, 7.5% for AGIs $50k-75k, 9.4% for AGIs $75k-100k, 10.5% for AGIs $100k-200k, 10.4% for AGIs over 200k)
Earned income credit: $2,027 (reported on 15.4% of returns)
Here:
$2,027
State:
$2,230
(% of AGI for various income ranges: 5.8% for AGIs below $25k, 1.1% for AGIs $25k-50k)
Percentage of individuals using paid preparers for their 2012 taxes: 74.0%
Here:
74%
State:
66%
(% for various income ranges: 72.9% for AGIs below $25k, 73.8% for AGIs $25k-50k, 75.0% for AGIs $50k-75k, 73.3% for AGIs $75k-100k, 75.5% for AGIs $100k-200k, 75.4% for AGIs over 200k)
Averages for the 2004 tax year for zip code 11364, filed in 2005:
Average Adjusted Gross Income (AGI) in 2004: $55,386 (Individual Income Tax Returns)
Here:
$55,386
State:
$59,519
Salary/wage: $54,197 (reported on 78.1% of returns)
Here:
$54,197
State:
$50,673
(% of AGI for various income ranges: 102.9% for AGIs below $10k, 59.7% for AGIs $10k-25k, 78.9% for AGIs $25k-50k, 79.7% for AGIs $50k-75k, 82.4% for AGIs $75k-100k, 73.4% for AGIs over 100k)
Taxable interest for individuals: $1,848 (reported on 68.1% of returns)
This zip code:
$1,848
New York:
$2,377
(% of AGI for various income ranges: 14.4% for AGIs below $10k, 5.7% for AGIs $10k-25k, 2.7% for AGIs $25k-50k, 2.2% for AGIs $50k-75k, 1.7% for AGIs $75k-100k, 1.6% for AGIs over 100k)
Taxable dividends: $2,708 (reported on 36.0% of returns)
Here:
$2,708
State:
$5,394
(% of AGI for various income ranges: 10.2% for AGIs below $10k, 3.1% for AGIs $10k-25k, 1.6% for AGIs $25k-50k, 1.5% for AGIs $50k-75k, 1.4% for AGIs $75k-100k, 1.7% for AGIs over 100k)
Net capital gain/loss: +$3,952 (reported on 30.1% of returns)
Here:
+$3,952
State:
+$23,581
(% of AGI for various income ranges: -6.1% for AGIs below $10k, -0.4% for AGIs $10k-25k, 0.1% for AGIs $25k-50k, 0.3% for AGIs $50k-75k, 0.6% for AGIs $75k-100k, 4.9% for AGIs over 100k)
Profit/loss from business: +$13,156 (reported on 18.0% of returns)
Here:
+$13,156
State:
+$13,809
(% of AGI for various income ranges: 31.9% for AGIs below $10k, 16.0% for AGIs $10k-25k, 5.3% for AGIs $25k-50k, 2.7% for AGIs $50k-75k, 2.4% for AGIs $75k-100k, 3.1% for AGIs over 100k)
IRA payment deduction: $3,648 (reported on 5.8% of returns)
11364:
$3,648
New York:
$3,115
(% of AGI for various income ranges: 0.7% for AGIs below $10k, 0.7% for AGIs $10k-25k, 0.8% for AGIs $25k-50k, 0.4% for AGIs $50k-75k, 0.3% for AGIs $75k-100k, 0.2% for AGIs over 100k)
Self-employed pension: $16,779 (reported on 0.9% of returns)
Here:
$16,779
New York:
$19,016
(% of AGI for various income ranges: 0.1% for AGIs $25k-50k, 0.1% for AGIs $50k-75k, 0.2% for AGIs $75k-100k, 0.5% for AGIs over 100k)
Total itemized deductions: $20,442 (23% of AGI, reported on 49.1% of returns)
Here:
$20,442
State:
$25,864
Here:
23.3% of AGI
State:
21.9% of AGI
(% of AGI for various income ranges: 18.4% for AGIs below $10k, 13.7% for AGIs $10k-25k, 17.3% for AGIs $25k-50k, 20.4% for AGIs $50k-75k, 20.7% for AGIs $75k-100k, 17.0% for AGIs over 100k)
Charity contributions deductions: $2,568 (3% of AGI, reported on 44.7% of returns)
Here:
$2,568
State:
$4,439
Here:
2.8% of AGI
State:
3.6% of AGI
(% of AGI for various income ranges: 0.8% for AGIs below $10k, 1.3% for AGIs $10k-25k, 2.0% for AGIs $25k-50k, 2.5% for AGIs $50k-75k, 2.3% for AGIs $75k-100k, 2.0% for AGIs over 100k)
Total tax: $8,971 (reported on 80.3% of returns)
11364:
$8,971
State:
$11,730
(% of AGI for various income ranges: 6.5% for AGIs below $10k, 5.0% for AGIs $10k-25k, 7.3% for AGIs $25k-50k, 9.9% for AGIs $50k-75k, 10.9% for AGIs $75k-100k, 18.6% for AGIs over 100k)
Earned income credit: $1,573 (reported on 11.3% of returns)
Here:
$1,573
State:
$1,757
Percentage of individuals using paid preparers for their 2004 taxes: 71.6%
Here:
72%
State:
67%
(% for various income ranges: 66.4% for AGIs below $10k, 73.8% for AGIs $10k-25k, 71.6% for AGIs $25k-50k, 72.7% for AGIs $50k-75k, 72.0% for AGIs $75k-100k, 73.6% for AGIs over 100k)
Likely homosexual households (counted as self-reported same-sex unmarried-partner households)
Lesbian couples: 0.5% of all households
Gay men: 0.0% of all households
Household received Food Stamps/SNAP in the past 12 months: 1,074 Household did not receive Food Stamps/SNAP in the past 12 months: 12,912
Women who had a birth in the past 12 months: 332 (310 now married, 17 unmarried) Women who did not have a birth in the past 12 months: 7,026 (3,458 now married, 3,525 unmarried)
Housing units in zip code 11364 with a mortgage: 4,817 (426 second mortgage, 24 home equity loan, 377 both second mortgage and home equity loan) Houses without a mortgage: 134
Median monthly owner costs for units with a mortgage: $2,789 Median monthly owner costs for units without a mortgage: $1,033
Residents with income below the poverty level in 2022:
This zip code:
6.4%
Whole state:
14.3%
Residents with income below 50% of the poverty level in 2022:
This zip code:
2.8%
Whole state:
6.8%
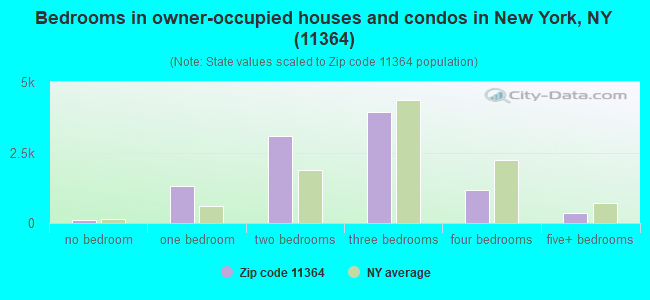
Median number of rooms in houses and condos:
Here:
5.0
State:
6.3
Median number of rooms in apartments:
Here:
4.4
State:
3.8
Notable locations in this zip code not listed on our city pages
Notable locations in zip code 11364: Windsor Park Branch Queens Borough Public Library (A), Fire Department New York Engine 326 Ladder 160 Battalion 53 (B), New York Ladder Company 160 (C), Kurt R Schmeller Library (D), Oakland Building (E), Robert F Kennedy Hall (F). Display/hide their locations on the map
Churches in zip code 11364 include: Armenian Church of the Holy Martyr (A), Yale Presbyterian Church (B), Saint Robert Bellarmine Roman Catholic Church (C), Colonial Church of Bayside (D), New Life Presbyterian Church (E), New Millineum United Methodist Church (F), Love of Christ Presbyterian Church (G), Korean Central Presbyterian Church (H), Glory Lutheran Church (I). Display/hide their locations on the map
Parks in zip code 11364 include: Saul Weprin Playground (1), Seven Gables Playground (2), Tall Oak Playground (3), Telephone Playground (4), Cunningham Park (5). Display/hide their locations on the map
5,724 married couples with children.
951 single-parent households (246 men, 705 women).
41.6% of residents of 11364 zip code speak English at home.
9.7% of residents speak Spanish at home (69% very well, 16% well, 11% not well, 4% not at all).
7.5% of residents speak other Indo-European language at home (60% very well, 24% well, 15% not well, 1% not at all).
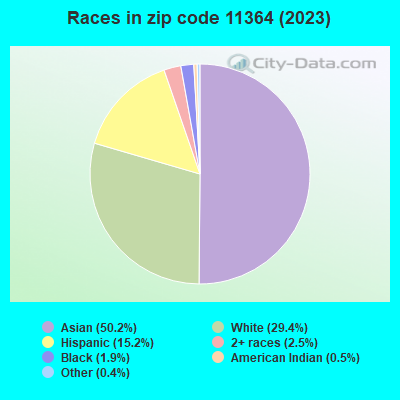
40.0% of residents speak Asian or Pacific Island language at home (40% very well, 29% well, 23% not well, 8% not at all).
1.9% of residents speak other language at home (88% very well, 10% well, 2% not well).
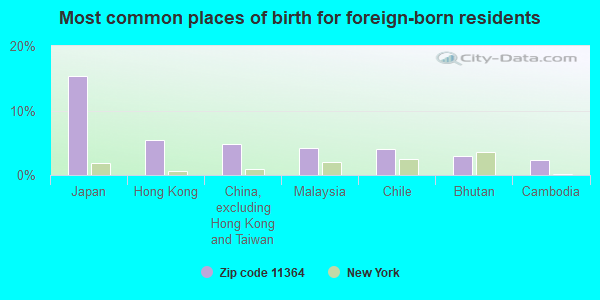
Foreign born population: 15,908 (42.4%) (71.1% of them are naturalized citizens)
This zip code:
42.4%
Whole state:
22.7%
15%Japan
5%Hong Kong
5%China, excluding Hong Kong and Taiwan
4%Malaysia
4%Chile
3%Bhutan
2%Cambodia
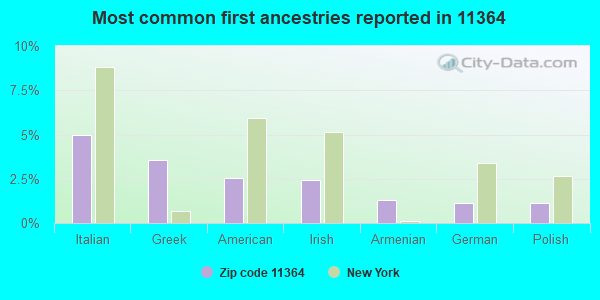
5%Italian
4%Greek
3%American
2%Irish
1%Armenian
1%German
1%Polish
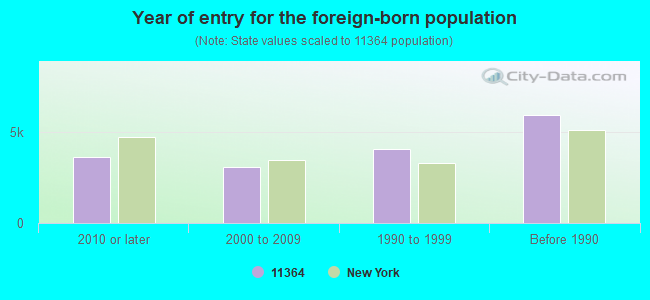
Year of entry for the foreign-born population
3,5922010 or later
3,0632000 to 2009
4,0371990 to 1999
5,918Before 1990
Public elementary/middle school in in zip code 11364 not listed on the city page:
Major facilities with environmental interests located in this zip code:
GOLDEN FRENCH CLEANERS (61-05 SPRINGFIELD BOULEVARD in FLUSHING, NY)
AIR MINOR (AIRS/AFS) STATE MASTER (New York facility tracking) - AIR PROGRAM Conditionally Exempt Small Quantity Generators, less than 100 kg/month of hazardous waste (Resource Conservation and Recovery Act (tracking hazardous waste)) - notification Business SIC classification: DRYCLEANING PLANTS, EXCEPT RUG CLEANING Business NAICS classification: DRYCLEANING AND LAUNDRY SERVICES (EXCEPT COIN-OPERATED). Organizations: MANDARIN REALTY CO (CONTACT/OWNER)
, GOLDEN CLEANERS/YOUNG DUGAN (LEGALLY RESPONSIBLE PARTY)
, PLUTO CLEANER CORP (LEGALLY RESPONSIBLE PARTY)
, HYONG SOK CORP (LEGALLY RESPONSIBLE PARTY)
, KYUNG CORPORATION (LEGALLY RESPONSIBLE PARTY)
I.S. 74 (61-15 OCEANIA STREET in FLUSHING, NY)
STATE MASTER (New York facility tracking) - AIR PROGRAM (Integrated Compliance Information System) - ICIS-02-1994-0052, FORMAL ENFORCEMENT ACTION Business SIC classification: WRECKING AND DEMOLITION WORK; ELEMENTARY AND SECONDARY SCHOOLS Business NAICS classification: ELEMENTARY AND SECONDARY SCHOOLS. Organizations: NYC DEPT OF EDUCATION (LEGALLY RESPONSIBLE PARTY)
Alternative names: NYC BD OF ED - INTERMEDIATE SCHOOL 74 Q
211-02/10 73RD AVENUE BUILDING (211-02/10 73 AVENUE in OAKLAND GARDENS, NY)
AIR MINOR (AIRS/AFS) STATE MASTER (New York facility tracking) - AIR PROGRAM Business SIC classification: OPERATORS OF APARTMENT BUILDINGS Business NAICS classification: LESSORS OF RESIDENTIAL BUILDINGS AND DWELLINGS. Organizations: WINDSOR PARK OWNERS CORP (LEGALLY RESPONSIBLE PARTY)
73-11/23 210 STREET BUILDING (73-11/23 210 STREET in OAKLAND GARDENS, NY)
AIR MINOR (AIRS/AFS) STATE MASTER (New York facility tracking) - AIR PROGRAM Business SIC classification: OPERATORS OF APARTMENT BUILDINGS Business NAICS classification: LESSORS OF RESIDENTIAL BUILDINGS AND DWELLINGS. Organizations: WINDSOR PARK OWNERS CORP (LEGALLY RESPONSIBLE PARTY)
75-05/15 210TH ST BLDG (75-05/15 210TH ST in QUEENS, NY)
AIR MINOR (AIRS/AFS) STATE MASTER (New York facility tracking) - AIR PROGRAM Business SIC classification: OPERATORS OF DWELLINGS OTHER THAN APARTMENT BUILDINGS Business NAICS classification: LESSORS OF RESIDENTIAL BUILDINGS AND DWELLINGS. Organizations: WINDSOR PARK OWNERS CORP (LEGALLY RESPONSIBLE PARTY)
Alternative names: 75-05/15 210 STREET BUILDING
75-26 BELL BOULEVARD BUILDING (75-26 BELL BOULEVARD in QUEENS, NY)
AIR MINOR (AIRS/AFS) STATE MASTER (New York facility tracking) - AIR PROGRAM Business SIC classification: OPERATORS OF DWELLINGS OTHER THAN APARTMENT BUILDINGS Business NAICS classification: LESSORS OF RESIDENTIAL BUILDINGS AND DWELLINGS. Organizations: WINDSOR PARK OWNERS CORP (LEGALLY RESPONSIBLE PARTY)
BENJAMIN CARDOZO HS ( in BAYSIDE, NY)
(National Center for Education Statistics) - STATE ID-347800010415 Organizations: NEW YORK CITY PUBLIC SCHOOLS (SCHOOL DISTRICT)
CON EDISON - MH 10078 (LITTLENECK PKWY AND 80 AVE in OAKLAND GARDENS, NY)
Large Quantity Generators, more that 1000 kg of hazardous waste/month (Resource Conservation and Recovery Act (tracking hazardous waste)) Organizations: CONSOLIDATED EDISON COMPANY OF NY, INC. (CONTACT/OPERATOR)
CON EDISON - MH 2659 (89 AVE. AND 161 ST. in OAKLAND GARDENS, NY)
Large Quantity Generators, more that 1000 kg of hazardous waste/month (Resource Conservation and Recovery Act (tracking hazardous waste)) Organizations: CONSOLIDATED EDISON COMPANY OF NY, INC. (CONTACT/OPERATOR)
CON EDISON - VS 8559 (152 MELBORNE AVE in OAKLAND GARDENS, NY)
Large Quantity Generators, more that 1000 kg of hazardous waste/month (Resource Conservation and Recovery Act (tracking hazardous waste)) Organizations: CONSOLIDATED EDISON COMPANY OF NY, INC. (CONTACT/OPERATOR)
CON ED - VS 7478 (S/S 48 AVE 38 C/O 216 ST in BAYSIDE, NY)
HAZARDOUS WASTE BIENNIAL REPORTER (Resource Conservation and Recovery Act (tracking hazardous waste)) (Resource Conservation and Recovery Act (tracking hazardous waste))
CON ED TM 6717 (73 AVE 150 W/O 213 ST in BAYSIDE, NY)
HAZARDOUS WASTE BIENNIAL REPORTER (Resource Conservation and Recovery Act (tracking hazardous waste)) (Resource Conservation and Recovery Act (tracking hazardous waste))
211-05 75 AVENUE BUILDING (211-05 75 AVENUE in BAYSIDE, NY)
AIR MINOR (AIRS/AFS) Business SIC classification: OPERATORS OF APARTMENT BUILDINGS
Housing units lacking complete plumbing facilities: 0.3% Housing units lacking complete kitchen facilities: 0.6%
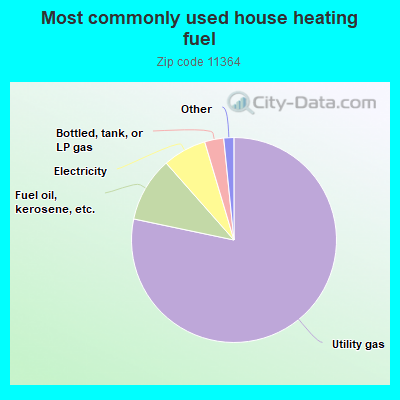
78.3%Utility gas
10.2%Fuel oil, kerosene, etc.
6.9%Electricity
3.0%Bottled, tank, or LP gas
0.9%No fuel used
0.6%Other fuel
Population in 1990: 32,080. Population change in the 1990s: +2,459 (+7.7%).
Place of birth for U.S.-born residents:
This state: 19,239
Northeast: 460
Midwest: 97
South: 186
West: 760
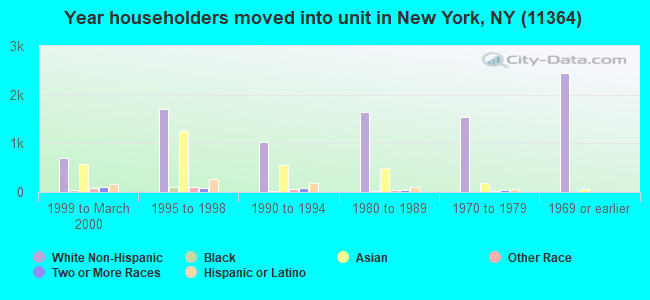
68% of the 11364 zip code residents lived in the same house 5 years ago. Out of people who lived in different houses, 73% lived in this county. Out of people who lived in different counties, 50% lived in New York.
93% of the 11364 zip code residents lived in the same house 1 year ago. Out of people who lived in different houses, 67% moved from this county. Out of people who lived in different houses, 13% moved from different county within same state. Out of people who lived in different houses, 8% moved from different state. Out of people who lived in different houses, 11% moved from abroad.
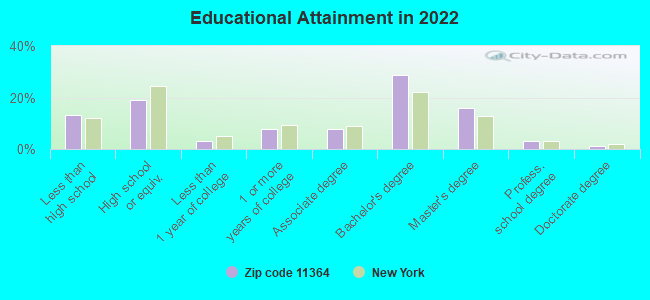
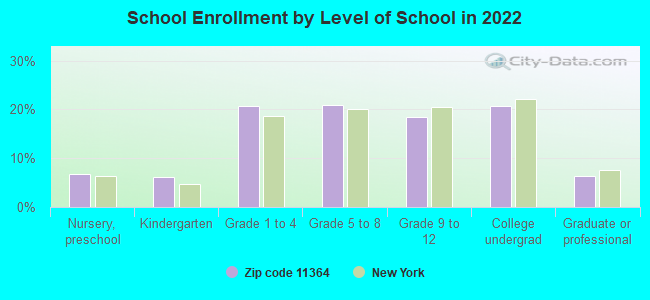
Private vs. public school enrollment:
Students in private schools in grades 1 to 8 (elementary and middle school): 230
Here:
6.4%
New York:
15.6%
Students in private schools in grades 9 to 12 (high school): 255
Here:
15.9%
New York:
15.0%
Students in private undergraduate colleges: 584
Here:
32.6%
New York:
39.2%
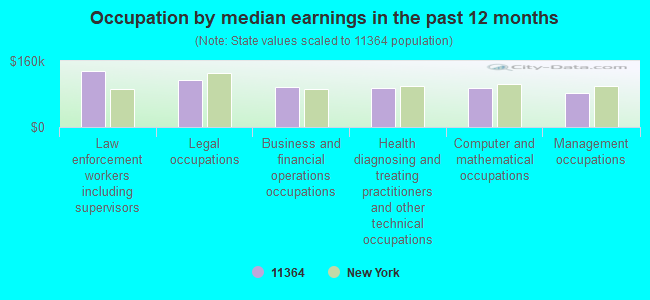
Occupation by median earnings in the past 12 months ($)
136,879Law enforcement workers including supervisors
114,508Legal occupations
96,993Business and financial operations occupations
93,866Health diagnosing and treating practitioners and other technical occupations
93,506Computer and mathematical occupations
82,238Management occupations
Companies with federal contracts located in this zip code:
SPREAD INFORMATION SCIENCES, I (48-46 CLEARVIEW EXPWY STE in OAKLAND GARDEN, NY; small business) : $4,450,737 in 203 contractsfrom 1999 to 2006
Contracts for Video Recording and Reproducing Equipment, ADPE System Configuration, ADP Input/Output and Storage Devices, ADP Components, and moreby NATIONAL ARCHIVES AND RECORDS ADMINISTRATION, Army, Navy, Defense Logistics Agency, and others Signed by year:2000: $674,454; 2001: $857,920; 2002: $277,069; 2003: $433,569; 2004: $428,765; 2005: $913,189; 2006: $639,504.
Biggest contracts:
$414,000 with NATIONAL ARCHIVES AND RECORDS ADMINISTRATION for Video Recording and Reproducing Equipment. Signed on 2000-09-15. Completion date: 2000-09-15.
$224,891 with Army for ADPE System Configuration. Signed on 2005-08-30. Completion date: 2005-09-28.
$157,374 with Navy for ADP Input/Output and Storage Devices. Signed on 2006-01-24. Completion date: 2006-04-30.
$105,182 with Army for ADPE System Configuration. Signed on 2002-09-27. Completion date: 2003-02-28.
ROBERT A. STARACE, PH.D (65-16B PL BAYSIDE in FLUSHING, NY; small business) : $606,321 in 34 contractsfrom 1999 to 2005
Contracts for Other Medical Services by SOCIAL SECURITY ADMINISTRATION Signed by year:2000: $78,000; 2001: $76,000; 2002: $109,665; 2003: $120,460; 2004: $79,402; 2005: $118,794; 2006: $0.
Biggest contracts:
$108,654 with SOCIAL SECURITY ADMINISTRATION for Other Medical Services. Signed on 2002-11-15. Completion date: 2002-05-15.
$36,671, same as above.Signed on 2003-12-01. Completion date: 2005-05-31.
$34,941, same as above.Signed on 2003-08-15. Completion date: 2002-05-15.
$34,689, same as above.Signed on 2004-05-28. Completion date: 2005-05-31.
Top industries in this zip code by the number of employees in 2005:
Other Services (except Public Administration): Civic and Social Organizations (100-249 employees: 1 establishment, 5-9 employees: 1 establishment)
Professional, Scientific, and Technical Services: Research and Development in the Physical, Engineering, and Life Sciences (100-249: 1, 1-4: 1)
Health Care and Social Assistance: Offices of Dentists (10-19: 4, 5-9: 9, 1-4: 11)
Other Services (except Public Administration): Religious Organizations (20-49: 2, 10-19: 1, 5-9: 5, 1-4: 8)
Other Services (except Public Administration): Other Similar Organizations (except Business, Professional, Labor, and Political Organizations) (20-49: 2, 10-19: 1, 5-9: 2, 1-4: 2)
People in group quarters in 2010:
47 people in group homes intended for adults
13 people in other noninstitutional facilities
5 people in group homes for juveniles (non-correctional)
5 people in nursing facilities/skilled-nursing facilities
People in group quarters in 2000:
29 people in religious group quarters
24 people in homes for the mentally retarded
10 people in homes for the physically handicapped
Fatal accident statistics in 2014:
Fatal accident count: 3
Vehicles involved in fatal accidents: 5
Fatal accidents caused by drunken drivers: 0
Fatalities: 3
Persons involved in fatal accidents: 5
Pedestrians involved in fatal accidents: 0
Fatal accident statistics in 2013:
Fatal accident count: 5
Vehicles involved in fatal accidents: 7
Fatal accidents caused by drunken drivers: 1
Fatalities: 5
Persons involved in fatal accidents: 7
Pedestrians involved in fatal accidents: 3
Home Mortgage Disclosure Act Aggregated Statistics For Year 2009 (Based on 9 full and 12 partial tracts)
A) FHA, FSA/RHS & VA Home Purchase Loans
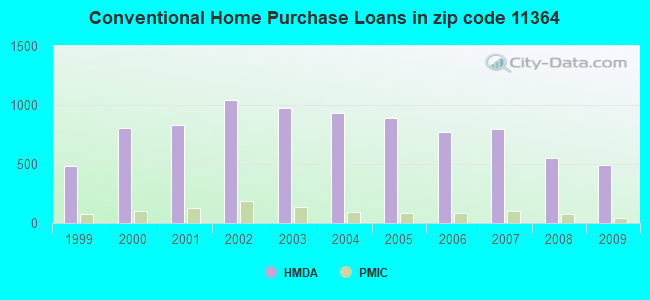
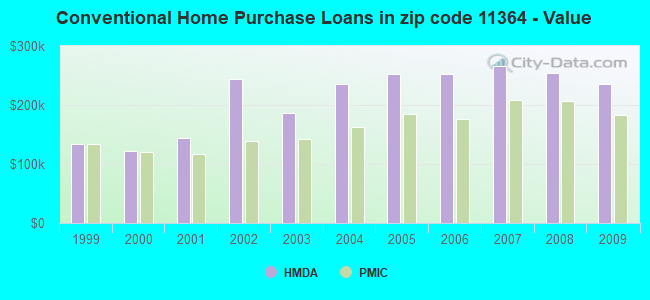
B) Conventional Home Purchase Loans
C) Refinancings
D) Home Improvement Loans
E) Loans on Dwellings For 5+ Families
F) Non-occupant Loans on < 5 Family Dwellings (A B C & D)
G) Loans On Manufactured Home Dwelling (A B C & D)
Number
Average Value
Number
Average Value
Number
Average Value
Number
Average Value
Number
Average Value
Number
Average Value
Number
Average Value
LOANS ORIGINATED
6
$474,152
489
$235,585
424
$235,914
21
$114,123
1
$3,000,000
19
$290,643
0
$0
APPLICATIONS APPROVED, NOT ACCEPTED
1
$522,000
39
$270,367
54
$283,109
3
$136,030
0
$0
4
$326,982
0
$0
APPLICATIONS DENIED
0
$0
87
$256,589
193
$281,329
15
$78,256
0
$0
14
$295,091
2
$99,850
APPLICATIONS WITHDRAWN
3
$458,240
33
$279,016
93
$302,324
4
$245,308
0
$0
4
$515,798
0
$0
FILES CLOSED FOR INCOMPLETENESS
1
$365,000
19
$195,129
40
$243,507
7
$153,667
0
$0
2
$269,000
0
$0
Aggregated Statistics For Year 2008 (Based on 9 full and 12 partial tracts)
A) FHA, FSA/RHS & VA Home Purchase Loans
B) Conventional Home Purchase Loans
C) Refinancings
D) Home Improvement Loans
E) Loans on Dwellings For 5+ Families
F) Non-occupant Loans on < 5 Family Dwellings (A B C & D)
G) Loans On Manufactured Home Dwelling (A B C & D)
Number
Average Value
Number
Average Value
Number
Average Value
Number
Average Value
Number
Average Value
Number
Average Value
Number
Average Value
LOANS ORIGINATED
6
$587,833
552
$254,522
179
$247,751
33
$146,510
3
$10,751,867
17
$317,906
0
$0
APPLICATIONS APPROVED, NOT ACCEPTED
0
$0
63
$290,680
59
$322,012
7
$74,239
0
$0
3
$405,103
0
$0
APPLICATIONS DENIED
3
$497,590
137
$302,573
124
$311,531
35
$81,979
0
$0
3
$95,317
1
$137,000
APPLICATIONS WITHDRAWN
1
$470,770
53
$313,490
66
$348,986
4
$133,485
0
$0
3
$433,690
0
$0
FILES CLOSED FOR INCOMPLETENESS
0
$0
24
$273,133
13
$243,851
2
$129,805
0
$0
0
$0
0
$0
Aggregated Statistics For Year 2007 (Based on 9 full and 8 partial tracts)
A) FHA, FSA/RHS & VA Home Purchase Loans
B) Conventional Home Purchase Loans
C) Refinancings
D) Home Improvement Loans
F) Non-occupant Loans on < 5 Family Dwellings (A B C & D)
Number
Average Value
Number
Average Value
Number
Average Value
Number
Average Value
Number
Average Value
LOANS ORIGINATED
2
$194,395
800
$266,566
270
$285,809
61
$141,428
24
$252,699
APPLICATIONS APPROVED, NOT ACCEPTED
0
$0
132
$324,449
74
$329,954
17
$82,938
5
$130,648
APPLICATIONS DENIED
0
$0
166
$332,704
141
$333,600
56
$118,052
21
$215,974
APPLICATIONS WITHDRAWN
0
$0
47
$274,529
72
$293,750
4
$371,182
5
$281,290
FILES CLOSED FOR INCOMPLETENESS
0
$0
23
$293,435
27
$422,307
7
$77,267
2
$154,765
Aggregated Statistics For Year 2006 (Based on 9 full and 10 partial tracts)
B) Conventional Home Purchase Loans
C) Refinancings
D) Home Improvement Loans
E) Loans on Dwellings For 5+ Families
F) Non-occupant Loans on < 5 Family Dwellings (A B C & D)
G) Loans On Manufactured Home Dwelling (A B C & D)
Number
Average Value
Number
Average Value
Number
Average Value
Number
Average Value
Number
Average Value
Number
Average Value
LOANS ORIGINATED
770
$252,131
393
$255,798
55
$114,119
0
$0
32
$338,212
0
$0
APPLICATIONS APPROVED, NOT ACCEPTED
100
$294,498
89
$302,457
35
$102,027
0
$0
6
$386,687
0
$0
APPLICATIONS DENIED
140
$301,673
192
$303,383
23
$130,467
0
$0
27
$450,393
1
$288,000
APPLICATIONS WITHDRAWN
84
$257,644
104
$312,634
4
$369,135
4
$479,880
4
$423,050
0
$0
FILES CLOSED FOR INCOMPLETENESS
19
$329,065
43
$288,460
3
$321,647
0
$0
2
$222,380
0
$0
Aggregated Statistics For Year 2005 (Based on 9 full and 12 partial tracts)
A) FHA, FSA/RHS & VA Home Purchase Loans
B) Conventional Home Purchase Loans
C) Refinancings
D) Home Improvement Loans
E) Loans on Dwellings For 5+ Families
F) Non-occupant Loans on < 5 Family Dwellings (A B C & D)
G) Loans On Manufactured Home Dwelling (A B C & D)
Number
Average Value
Number
Average Value
Number
Average Value
Number
Average Value
Number
Average Value
Number
Average Value
Number
Average Value
LOANS ORIGINATED
0
$0
893
$252,605
420
$239,162
54
$148,837
5
$18,896,744
47
$327,275
0
$0
APPLICATIONS APPROVED, NOT ACCEPTED
0
$0
129
$302,999
93
$286,730
15
$137,413
0
$0
11
$346,169
0
$0
APPLICATIONS DENIED
0
$0
138
$287,685
178
$258,282
39
$127,042
0
$0
22
$200,286
6
$216,418
APPLICATIONS WITHDRAWN
0
$0
68
$290,373
135
$246,568
24
$187,319
0
$0
9
$271,880
0
$0
FILES CLOSED FOR INCOMPLETENESS
1
$236,000
45
$262,862
92
$283,416
2
$99,850
0
$0
3
$312,120
0
$0
Aggregated Statistics For Year 2004 (Based on 9 full and 12 partial tracts)
A) FHA, FSA/RHS & VA Home Purchase Loans
B) Conventional Home Purchase Loans
C) Refinancings
D) Home Improvement Loans
E) Loans on Dwellings For 5+ Families
F) Non-occupant Loans on < 5 Family Dwellings (A B C & D)
G) Loans On Manufactured Home Dwelling (A B C & D)
Number
Average Value
Number
Average Value
Number
Average Value
Number
Average Value
Number
Average Value
Number
Average Value
Number
Average Value
LOANS ORIGINATED
1
$159,470
934
$235,369
492
$210,613
58
$97,016
1
$1,500,000
29
$303,131
0
$0
APPLICATIONS APPROVED, NOT ACCEPTED
0
$0
136
$285,808
113
$238,884
24
$108,969
0
$0
6
$217,755
0
$0
APPLICATIONS DENIED
4
$359,340
143
$286,875
207
$238,202
35
$114,175
0
$0
21
$250,550
2
$104,845
APPLICATIONS WITHDRAWN
0
$0
64
$268,214
136
$246,222
18
$126,151
0
$0
9
$298,131
0
$0
FILES CLOSED FOR INCOMPLETENESS
0
$0
33
$310,766
65
$272,311
11
$114,659
0
$0
4
$85,695
0
$0
Aggregated Statistics For Year 2003 (Based on 9 full and 12 partial tracts)
A) FHA, FSA/RHS & VA Home Purchase Loans
B) Conventional Home Purchase Loans
C) Refinancings
D) Home Improvement Loans
E) Loans on Dwellings For 5+ Families
F) Non-occupant Loans on < 5 Family Dwellings (A B C & D)
Number
Average Value
Number
Average Value
Number
Average Value
Number
Average Value
Number
Average Value
Number
Average Value
LOANS ORIGINATED
2
$310,700
973
$186,582
1,302
$173,990
23
$74,975
4
$7,394,588
53
$213,895
APPLICATIONS APPROVED, NOT ACCEPTED
0
$0
106
$206,278
241
$211,932
13
$108,323
2
$181,725
9
$202,544
APPLICATIONS DENIED
0
$0
162
$187,319
289
$205,404
39
$70,325
1
$12,000,000
20
$275,612
APPLICATIONS WITHDRAWN
2
$365,500
65
$225,305
189
$212,501
5
$46,000
0
$0
3
$275,047
FILES CLOSED FOR INCOMPLETENESS
0
$0
22
$179,125
61
$169,763
3
$182,300
0
$0
5
$192,684
Aggregated Statistics For Year 2002 (Based on 9 full and 12 partial tracts)
A) FHA, FSA/RHS & VA Home Purchase Loans
B) Conventional Home Purchase Loans
C) Refinancings
D) Home Improvement Loans
E) Loans on Dwellings For 5+ Families
F) Non-occupant Loans on < 5 Family Dwellings (A B C & D)
Number
Average Value
Number
Average Value
Number
Average Value
Number
Average Value
Number
Average Value
Number
Average Value
LOANS ORIGINATED
1
$60,400
1,040
$243,799
771
$166,364
42
$65,258
1
$1,150,000
51
$199,695
APPLICATIONS APPROVED, NOT ACCEPTED
0
$0
125
$226,369
144
$186,963
15
$57,320
0
$0
7
$173,096
APPLICATIONS DENIED
0
$0
100
$181,588
196
$191,926
27
$60,515
0
$0
16
$197,691
APPLICATIONS WITHDRAWN
0
$0
62
$184,106
170
$187,283
12
$28,620
0
$0
10
$283,916
FILES CLOSED FOR INCOMPLETENESS
0
$0
31
$179,538
76
$186,700
4
$77,768
0
$0
4
$257,900
Aggregated Statistics For Year 2001 (Based on 9 full and 12 partial tracts)
A) FHA, FSA/RHS & VA Home Purchase Loans
B) Conventional Home Purchase Loans
C) Refinancings
D) Home Improvement Loans
F) Non-occupant Loans on < 5 Family Dwellings (A B C & D)
Number
Average Value
Number
Average Value
Number
Average Value
Number
Average Value
Number
Average Value
LOANS ORIGINATED
3
$206,000
832
$143,245
532
$164,489
40
$72,834
29
$159,894
APPLICATIONS APPROVED, NOT ACCEPTED
0
$0
76
$160,521
117
$144,372
15
$104,145
4
$128,227
APPLICATIONS DENIED
0
$0
112
$138,843
200
$170,281
35
$48,533
8
$236,948
APPLICATIONS WITHDRAWN
0
$0
63
$171,070
176
$150,424
17
$311,765
2
$2,154,400
FILES CLOSED FOR INCOMPLETENESS
0
$0
30
$105,230
37
$152,315
7
$41,966
0
$0
Aggregated Statistics For Year 2000 (Based on 9 full and 12 partial tracts)
A) FHA, FSA/RHS & VA Home Purchase Loans
B) Conventional Home Purchase Loans
C) Refinancings
D) Home Improvement Loans
E) Loans on Dwellings For 5+ Families
F) Non-occupant Loans on < 5 Family Dwellings (A B C & D)
Number
Average Value
Number
Average Value
Number
Average Value
Number
Average Value
Number
Average Value
Number
Average Value
LOANS ORIGINATED
4
$202,095
809
$122,601
127
$122,412
36
$45,299
4
$1,567,305
20
$129,469
APPLICATIONS APPROVED, NOT ACCEPTED
0
$0
75
$161,811
50
$117,450
15
$60,073
0
$0
3
$49,667
APPLICATIONS DENIED
0
$0
120
$129,292
110
$111,362
54
$61,961
0
$0
8
$126,210
APPLICATIONS WITHDRAWN
1
$128,000
47
$156,019
125
$108,058
15
$50,828
0
$0
4
$67,092
FILES CLOSED FOR INCOMPLETENESS
0
$0
29
$98,632
22
$169,132
4
$92,250
0
$0
3
$38,997
Aggregated Statistics For Year 1999 (Based on 5 full and 10 partial tracts)
A) FHA, FSA/RHS & VA Home Purchase Loans
B) Conventional Home Purchase Loans
C) Refinancings
D) Home Improvement Loans
E) Loans on Dwellings For 5+ Families
F) Non-occupant Loans on < 5 Family Dwellings (A B C & D)
2007 - 2018 National Fire Incident Reporting System (NFIRS) incidents
According to the data from the years 2007 - 2018 the average number of fire incidents per year is 82. The highest number of reported fires - 130 took place in 2008, and the least - 65 in 2016. The data has a decreasing trend.
When looking into fire subcategories, the most reports belonged to: Structure Fires (62.5%), and Outside Fires (22.8%).
Fire incident types reported to NFIRS in Zip Code 11364


 Nearest zip codes: 11427, 11361, 11362, 11366, 11428, 11423.


 (Students: 543, Location: 218-12 HARTLAND AVE, Grades: PK-5)
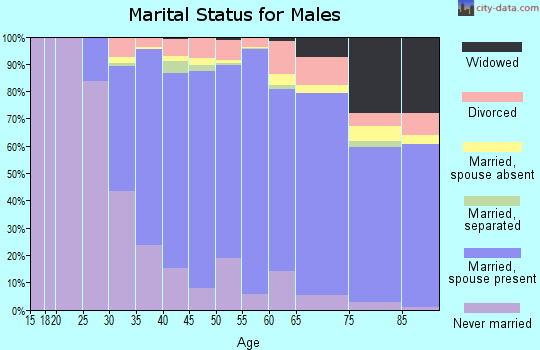


 According to the data from the years 2007 - 2018 the average number of fire incidents per year is 82. The highest number of reported fires - 130 took place in 2008, and the least - 65 in 2016. The data has a decreasing trend.
 When looking into fire subcategories, the most reports belonged to: Structure Fires (62.5%), and Outside Fires (22.8%).