Estimated zip code population in 2022: 37,653
Zip code population in 2010: 34,821
Zip code population in 2000: 28,984
Houses and condos: 15,250
Renter-occupied apartments: 5,943
% of renters here:
42%State:
46%
March 2022 cost of living index in zip code 11379: 153.3
(very high, U.S. average is 100)
Land area: 2.1
sq. mi.
Water area: 0.0
sq. mi.
Population density: 18,150 people per square mile (very high).
OSM Map
General Map
Google Map
MSN Map
OSM Map
General Map
Google Map
MSN Map
OSM Map
General Map
Google Map
MSN Map
OSM Map
General Map
Google Map
MSN Map
Please wait while loading the map...
Real estate property taxes paid for housing units in 2022:
This zip code:
0.7% ($6,574)New York:
1.5% ($6,180)
Median real estate property taxes paid for housing units with mortgages in 2022: $6,697 (0.7%)
Median real estate property taxes paid for housing units with no mortgage in 2022: $6,448 (0.7%)
Profiles of local businesses
Business Search - 14 Million verified businesses
Males: 18,713 Females: 18,940
For population 25 years and over in 11379:
High school or higher: 86.2%Bachelor's degree or higher: 37.1%Graduate or professional degree: 14.7%Unemployed: 3.6%Mean travel time to work (commute): 43.8 minutes
For population 15 years and over in 11379:
Never married: 30.3%Now married: 52.9%Separated: 1.6%Widowed: 7.6%Divorced: 7.6%
Zip code 11379 compared to state average:
Median house value above state average. Black race population percentage significantly below state average. Median age above state average. Foreign-born population percentage above state average. Length of stay since moving in significantly above state average. 23,184 61.6% White 8,296 22.0% Hispanic or Latino 4,613 12.3% Asian 711 1.9% Some other race 562 1.5% Two or more races 230 0.6% Black 55 0.1% American Indian
Data:
Median household income ($)
Median household income (% change since 2000)
Household income diversity
Ratio of average income to average house value (%)
Ratio of average income to average rent
Median household income ($) - White
Median household income ($) - Black or African American
Median household income ($) - Asian
Median household income ($) - Hispanic or Latino
Median household income ($) - American Indian and Alaska Native
Median household income ($) - Multirace
Median household income ($) - Other Race
Median household income for houses/condos with a mortgage ($)
Median household income for apartments without a mortgage ($)
Races - White alone (%)
Races - White alone (% change since 2000)
Races - Black alone (%)
Races - Black alone (% change since 2000)
Races - American Indian alone (%)
Races - American Indian alone (% change since 2000)
Races - Asian alone (%)
Races - Asian alone (% change since 2000)
Races - Hispanic (%)
Races - Hispanic (% change since 2000)
Races - Native Hawaiian and Other Pacific Islander alone (%)
Races - Native Hawaiian and Other Pacific Islander alone (% change since 2000)
Races - Two or more races (%)
Races - Two or more races (% change since 2000)
Races - Other race alone (%)
Races - Other race alone (% change since 2000)
Racial diversity
Unemployment (%)
Unemployment (% change since 2000)
Unemployment (%) - White
Unemployment (%) - Black or African American
Unemployment (%) - Asian
Unemployment (%) - Hispanic or Latino
Unemployment (%) - American Indian and Alaska Native
Unemployment (%) - Multirace
Unemployment (%) - Other Race
Population density (people per square mile)
Population - Males (%)
Population - Females (%)
Population - Males (%) - White
Population - Males (%) - Black or African American
Population - Males (%) - Asian
Population - Males (%) - Hispanic or Latino
Population - Males (%) - American Indian and Alaska Native
Population - Males (%) - Multirace
Population - Males (%) - Other Race
Population - Females (%) - White
Population - Females (%) - Black or African American
Population - Females (%) - Asian
Population - Females (%) - Hispanic or Latino
Population - Females (%) - American Indian and Alaska Native
Population - Females (%) - Multirace
Population - Females (%) - Other Race
Coronavirus confirmed cases (Apr 27, 2024)
Deaths caused by coronavirus (Apr 27, 2024)
Coronavirus confirmed cases (per 100k population) (Apr 27, 2024)
Deaths caused by coronavirus (per 100k population) (Apr 27, 2024)
Daily increase in number of cases (Apr 27, 2024)
Weekly increase in number of cases (Apr 27, 2024)
Cases doubled (in days) (Apr 27, 2024)
Hospitalized patients (Apr 18, 2022)
Negative test results (Apr 18, 2022)
Total test results (Apr 18, 2022)
COVID Vaccine doses distributed (per 100k population) (Sep 19, 2023)
COVID Vaccine doses administered (per 100k population) (Sep 19, 2023)
COVID Vaccine doses distributed (Sep 19, 2023)
COVID Vaccine doses administered (Sep 19, 2023)
Likely homosexual households (%)
Likely homosexual households (% change since 2000)
Likely homosexual households - Lesbian couples (%)
Likely homosexual households - Lesbian couples (% change since 2000)
Likely homosexual households - Gay men (%)
Likely homosexual households - Gay men (% change since 2000)
Cost of living index
Median gross rent ($)
Median contract rent ($)
Median monthly housing costs ($)
Median house or condo value ($)
Median house or condo value ($ change since 2000)
Mean house or condo value by units in structure - 1, detached ($)
Mean house or condo value by units in structure - 1, attached ($)
Mean house or condo value by units in structure - 2 ($)
Mean house or condo value by units in structure by units in structure - 3 or 4 ($)
Mean house or condo value by units in structure - 5 or more ($)
Mean house or condo value by units in structure - Boat, RV, van, etc. ($)
Mean house or condo value by units in structure - Mobile home ($)
Median house or condo value ($) - White
Median house or condo value ($) - Black or African American
Median house or condo value ($) - Asian
Median house or condo value ($) - Hispanic or Latino
Median house or condo value ($) - American Indian and Alaska Native
Median house or condo value ($) - Multirace
Median house or condo value ($) - Other Race
Median resident age
Resident age diversity
Median resident age - Males
Median resident age - Females
Median resident age - White
Median resident age - Black or African American
Median resident age - Asian
Median resident age - Hispanic or Latino
Median resident age - American Indian and Alaska Native
Median resident age - Multirace
Median resident age - Other Race
Median resident age - Males - White
Median resident age - Males - Black or African American
Median resident age - Males - Asian
Median resident age - Males - Hispanic or Latino
Median resident age - Males - American Indian and Alaska Native
Median resident age - Males - Multirace
Median resident age - Males - Other Race
Median resident age - Females - White
Median resident age - Females - Black or African American
Median resident age - Females - Asian
Median resident age - Females - Hispanic or Latino
Median resident age - Females - American Indian and Alaska Native
Median resident age - Females - Multirace
Median resident age - Females - Other Race
Commute - mean travel time to work (minutes)
Travel time to work - Less than 5 minutes (%)
Travel time to work - Less than 5 minutes (% change since 2000)
Travel time to work - 5 to 9 minutes (%)
Travel time to work - 5 to 9 minutes (% change since 2000)
Travel time to work - 10 to 19 minutes (%)
Travel time to work - 10 to 19 minutes (% change since 2000)
Travel time to work - 20 to 29 minutes (%)
Travel time to work - 20 to 29 minutes (% change since 2000)
Travel time to work - 30 to 39 minutes (%)
Travel time to work - 30 to 39 minutes (% change since 2000)
Travel time to work - 40 to 59 minutes (%)
Travel time to work - 40 to 59 minutes (% change since 2000)
Travel time to work - 60 to 89 minutes (%)
Travel time to work - 60 to 89 minutes (% change since 2000)
Travel time to work - 90 or more minutes (%)
Travel time to work - 90 or more minutes (% change since 2000)
Marital status - Never married (%)
Marital status - Now married (%)
Marital status - Separated (%)
Marital status - Widowed (%)
Marital status - Divorced (%)
Median family income ($)
Median family income (% change since 2000)
Median non-family income ($)
Median non-family income (% change since 2000)
Median per capita income ($)
Median per capita income (% change since 2000)
Median family income ($) - White
Median family income ($) - Black or African American
Median family income ($) - Asian
Median family income ($) - Hispanic or Latino
Median family income ($) - American Indian and Alaska Native
Median family income ($) - Multirace
Median family income ($) - Other Race
Median year house/condo built
Median year apartment built
Year house built - Built 2005 or later (%)
Year house built - Built 2000 to 2004 (%)
Year house built - Built 1990 to 1999 (%)
Year house built - Built 1980 to 1989 (%)
Year house built - Built 1970 to 1979 (%)
Year house built - Built 1960 to 1969 (%)
Year house built - Built 1950 to 1959 (%)
Year house built - Built 1940 to 1949 (%)
Year house built - Built 1939 or earlier (%)
Average household size
Household density (households per square mile)
Average household size - White
Average household size - Black or African American
Average household size - Asian
Average household size - Hispanic or Latino
Average household size - American Indian and Alaska Native
Average household size - Multirace
Average household size - Other Race
Occupied housing units (%)
Vacant housing units (%)
Owner occupied housing units (%)
Renter occupied housing units (%)
Vacancy status - For rent (%)
Vacancy status - For sale only (%)
Vacancy status - Rented or sold, not occupied (%)
Vacancy status - For seasonal, recreational, or occasional use (%)
Vacancy status - For migrant workers (%)
Vacancy status - Other vacant (%)
Residents with income below the poverty level (%)
Residents with income below 50% of the poverty level (%)
Children below poverty level (%)
Poor families by family type - Married-couple family (%)
Poor families by family type - Male, no wife present (%)
Poor families by family type - Female, no husband present (%)
Poverty status for native-born residents (%)
Poverty status for foreign-born residents (%)
Poverty among high school graduates not in families (%)
Poverty among people who did not graduate high school not in families (%)
Residents with income below the poverty level (%) - White
Residents with income below the poverty level (%) - Black or African American
Residents with income below the poverty level (%) - Asian
Residents with income below the poverty level (%) - Hispanic or Latino
Residents with income below the poverty level (%) - American Indian and Alaska Native
Residents with income below the poverty level (%) - Multirace
Residents with income below the poverty level (%) - Other Race
Air pollution - Air Quality Index (AQI)
Air pollution - CO
Air pollution - NO2
Air pollution - SO2
Air pollution - Ozone
Air pollution - PM10
Air pollution - PM25
Air pollution - Pb
Crime - Murders per 100,000 population
Crime - Rapes per 100,000 population
Crime - Robberies per 100,000 population
Crime - Assaults per 100,000 population
Crime - Burglaries per 100,000 population
Crime - Thefts per 100,000 population
Crime - Auto thefts per 100,000 population
Crime - Arson per 100,000 population
Crime - City-data.com crime index
Crime - Violent crime index
Crime - Property crime index
Crime - Murders per 100,000 population (5 year average)
Crime - Rapes per 100,000 population (5 year average)
Crime - Robberies per 100,000 population (5 year average)
Crime - Assaults per 100,000 population (5 year average)
Crime - Burglaries per 100,000 population (5 year average)
Crime - Thefts per 100,000 population (5 year average)
Crime - Auto thefts per 100,000 population (5 year average)
Crime - Arson per 100,000 population (5 year average)
Crime - City-data.com crime index (5 year average)
Crime - Violent crime index (5 year average)
Crime - Property crime index (5 year average)
1996 Presidential Elections Results (%) - Democratic Party (Clinton)
1996 Presidential Elections Results (%) - Republican Party (Dole)
1996 Presidential Elections Results (%) - Other
2000 Presidential Elections Results (%) - Democratic Party (Gore)
2000 Presidential Elections Results (%) - Republican Party (Bush)
2000 Presidential Elections Results (%) - Other
2004 Presidential Elections Results (%) - Democratic Party (Kerry)
2004 Presidential Elections Results (%) - Republican Party (Bush)
2004 Presidential Elections Results (%) - Other
2008 Presidential Elections Results (%) - Democratic Party (Obama)
2008 Presidential Elections Results (%) - Republican Party (McCain)
2008 Presidential Elections Results (%) - Other
2012 Presidential Elections Results (%) - Democratic Party (Obama)
2012 Presidential Elections Results (%) - Republican Party (Romney)
2012 Presidential Elections Results (%) - Other
2016 Presidential Elections Results (%) - Democratic Party (Clinton)
2016 Presidential Elections Results (%) - Republican Party (Trump)
2016 Presidential Elections Results (%) - Other
2020 Presidential Elections Results (%) - Democratic Party (Biden)
2020 Presidential Elections Results (%) - Republican Party (Trump)
2020 Presidential Elections Results (%) - Other
Ancestries Reported - Arab (%)
Ancestries Reported - Czech (%)
Ancestries Reported - Danish (%)
Ancestries Reported - Dutch (%)
Ancestries Reported - English (%)
Ancestries Reported - French (%)
Ancestries Reported - French Canadian (%)
Ancestries Reported - German (%)
Ancestries Reported - Greek (%)
Ancestries Reported - Hungarian (%)
Ancestries Reported - Irish (%)
Ancestries Reported - Italian (%)
Ancestries Reported - Lithuanian (%)
Ancestries Reported - Norwegian (%)
Ancestries Reported - Polish (%)
Ancestries Reported - Portuguese (%)
Ancestries Reported - Russian (%)
Ancestries Reported - Scotch-Irish (%)
Ancestries Reported - Scottish (%)
Ancestries Reported - Slovak (%)
Ancestries Reported - Subsaharan African (%)
Ancestries Reported - Swedish (%)
Ancestries Reported - Swiss (%)
Ancestries Reported - Ukrainian (%)
Ancestries Reported - United States (%)
Ancestries Reported - Welsh (%)
Ancestries Reported - West Indian (%)
Ancestries Reported - Other (%)
Educational Attainment - No schooling completed (%)
Educational Attainment - Less than high school (%)
Educational Attainment - High school or equivalent (%)
Educational Attainment - Less than 1 year of college (%)
Educational Attainment - 1 or more years of college (%)
Educational Attainment - Associate degree (%)
Educational Attainment - Bachelor's degree (%)
Educational Attainment - Master's degree (%)
Educational Attainment - Professional school degree (%)
Educational Attainment - Doctorate degree (%)
School Enrollment - Nursery, preschool (%)
School Enrollment - Kindergarten (%)
School Enrollment - Grade 1 to 4 (%)
School Enrollment - Grade 5 to 8 (%)
School Enrollment - Grade 9 to 12 (%)
School Enrollment - College undergrad (%)
School Enrollment - Graduate or professional (%)
School Enrollment - Not enrolled in school (%)
School enrollment - Public schools (%)
School enrollment - Private schools (%)
School enrollment - Not enrolled (%)
Median number of rooms in houses and condos
Median number of rooms in apartments
Housing units lacking complete plumbing facilities (%)
Housing units lacking complete kitchen facilities (%)
Density of houses
Urban houses (%)
Rural houses (%)
Households with people 60 years and over (%)
Households with people 65 years and over (%)
Households with people 75 years and over (%)
Households with one or more nonrelatives (%)
Households with no nonrelatives (%)
Population in households (%)
Family households (%)
Nonfamily households (%)
Population in families (%)
Family households with own children (%)
Median number of bedrooms in owner occupied houses
Mean number of bedrooms in owner occupied houses
Median number of bedrooms in renter occupied houses
Mean number of bedrooms in renter occupied houses
Median number of vehichles in owner occupied houses
Mean number of vehichles in owner occupied houses
Median number of vehichles in renter occupied houses
Mean number of vehichles in renter occupied houses
Mortgage status - with mortgage (%)
Mortgage status - with second mortgage (%)
Mortgage status - with home equity loan (%)
Mortgage status - with both second mortgage and home equity loan (%)
Mortgage status - without a mortgage (%)
Average family size
Average family size - White
Average family size - Black or African American
Average family size - Asian
Average family size - Hispanic or Latino
Average family size - American Indian and Alaska Native
Average family size - Multirace
Average family size - Other Race
Geographical mobility - Same house 1 year ago (%)
Geographical mobility - Moved within same county (%)
Geographical mobility - Moved from different county within same state (%)
Geographical mobility - Moved from different state (%)
Geographical mobility - Moved from abroad (%)
Place of birth - Born in state of residence (%)
Place of birth - Born in other state (%)
Place of birth - Native, outside of US (%)
Place of birth - Foreign born (%)
Housing units in structures - 1, detached (%)
Housing units in structures - 1, attached (%)
Housing units in structures - 2 (%)
Housing units in structures - 3 or 4 (%)
Housing units in structures - 5 to 9 (%)
Housing units in structures - 10 to 19 (%)
Housing units in structures - 20 to 49 (%)
Housing units in structures - 50 or more (%)
Housing units in structures - Mobile home (%)
Housing units in structures - Boat, RV, van, etc. (%)
House/condo owner moved in on average (years ago)
Renter moved in on average (years ago)
Year householder moved into unit - Moved in 1999 to March 2000 (%)
Year householder moved into unit - Moved in 1995 to 1998 (%)
Year householder moved into unit - Moved in 1990 to 1994 (%)
Year householder moved into unit - Moved in 1980 to 1989 (%)
Year householder moved into unit - Moved in 1970 to 1979 (%)
Year householder moved into unit - Moved in 1969 or earlier (%)
Means of transportation to work - Drove car alone (%)
Means of transportation to work - Carpooled (%)
Means of transportation to work - Public transportation (%)
Means of transportation to work - Bus or trolley bus (%)
Means of transportation to work - Streetcar or trolley car (%)
Means of transportation to work - Subway or elevated (%)
Means of transportation to work - Railroad (%)
Means of transportation to work - Ferryboat (%)
Means of transportation to work - Taxicab (%)
Means of transportation to work - Motorcycle (%)
Means of transportation to work - Bicycle (%)
Means of transportation to work - Walked (%)
Means of transportation to work - Other means (%)
Working at home (%)
Industry diversity
Most Common Industries - Agriculture, forestry, fishing and hunting, and mining (%)
Most Common Industries - Agriculture, forestry, fishing and hunting (%)
Most Common Industries - Mining, quarrying, and oil and gas extraction (%)
Most Common Industries - Construction (%)
Most Common Industries - Manufacturing (%)
Most Common Industries - Wholesale trade (%)
Most Common Industries - Retail trade (%)
Most Common Industries - Transportation and warehousing, and utilities (%)
Most Common Industries - Transportation and warehousing (%)
Most Common Industries - Utilities (%)
Most Common Industries - Information (%)
Most Common Industries - Finance and insurance, and real estate and rental and leasing (%)
Most Common Industries - Finance and insurance (%)
Most Common Industries - Real estate and rental and leasing (%)
Most Common Industries - Professional, scientific, and management, and administrative and waste management services (%)
Most Common Industries - Professional, scientific, and technical services (%)
Most Common Industries - Management of companies and enterprises (%)
Most Common Industries - Administrative and support and waste management services (%)
Most Common Industries - Educational services, and health care and social assistance (%)
Most Common Industries - Educational services (%)
Most Common Industries - Health care and social assistance (%)
Most Common Industries - Arts, entertainment, and recreation, and accommodation and food services (%)
Most Common Industries - Arts, entertainment, and recreation (%)
Most Common Industries - Accommodation and food services (%)
Most Common Industries - Other services, except public administration (%)
Most Common Industries - Public administration (%)
Occupation diversity
Most Common Occupations - Management, business, science, and arts occupations (%)
Most Common Occupations - Management, business, and financial occupations (%)
Most Common Occupations - Management occupations (%)
Most Common Occupations - Business and financial operations occupations (%)
Most Common Occupations - Computer, engineering, and science occupations (%)
Most Common Occupations - Computer and mathematical occupations (%)
Most Common Occupations - Architecture and engineering occupations (%)
Most Common Occupations - Life, physical, and social science occupations (%)
Most Common Occupations - Education, legal, community service, arts, and media occupations (%)
Most Common Occupations - Community and social service occupations (%)
Most Common Occupations - Legal occupations (%)
Most Common Occupations - Education, training, and library occupations (%)
Most Common Occupations - Arts, design, entertainment, sports, and media occupations (%)
Most Common Occupations - Healthcare practitioners and technical occupations (%)
Most Common Occupations - Health diagnosing and treating practitioners and other technical occupations (%)
Most Common Occupations - Health technologists and technicians (%)
Most Common Occupations - Service occupations (%)
Most Common Occupations - Healthcare support occupations (%)
Most Common Occupations - Protective service occupations (%)
Most Common Occupations - Fire fighting and prevention, and other protective service workers including supervisors (%)
Most Common Occupations - Law enforcement workers including supervisors (%)
Most Common Occupations - Food preparation and serving related occupations (%)
Most Common Occupations - Building and grounds cleaning and maintenance occupations (%)
Most Common Occupations - Personal care and service occupations (%)
Most Common Occupations - Sales and office occupations (%)
Most Common Occupations - Sales and related occupations (%)
Most Common Occupations - Office and administrative support occupations (%)
Most Common Occupations - Natural resources, construction, and maintenance occupations (%)
Most Common Occupations - Farming, fishing, and forestry occupations (%)
Most Common Occupations - Construction and extraction occupations (%)
Most Common Occupations - Installation, maintenance, and repair occupations (%)
Most Common Occupations - Production, transportation, and material moving occupations (%)
Most Common Occupations - Production occupations (%)
Most Common Occupations - Transportation occupations (%)
Most Common Occupations - Material moving occupations (%)
People in Group quarters - Institutionalized population (%)
People in Group quarters - Correctional institutions (%)
People in Group quarters - Federal prisons and detention centers (%)
People in Group quarters - Halfway houses (%)
People in Group quarters - Local jails and other confinement facilities (including police lockups) (%)
People in Group quarters - Military disciplinary barracks (%)
People in Group quarters - State prisons (%)
People in Group quarters - Other types of correctional institutions (%)
People in Group quarters - Nursing homes (%)
People in Group quarters - Hospitals/wards, hospices, and schools for the handicapped (%)
People in Group quarters - Hospitals/wards and hospices for chronically ill (%)
People in Group quarters - Hospices or homes for chronically ill (%)
People in Group quarters - Military hospitals or wards for chronically ill (%)
People in Group quarters - Other hospitals or wards for chronically ill (%)
People in Group quarters - Hospitals or wards for drug/alcohol abuse (%)
People in Group quarters - Mental (Psychiatric) hospitals or wards (%)
People in Group quarters - Schools, hospitals, or wards for the mentally retarded (%)
People in Group quarters - Schools, hospitals, or wards for the physically handicapped (%)
People in Group quarters - Institutions for the deaf (%)
People in Group quarters - Institutions for the blind (%)
People in Group quarters - Orthopedic wards and institutions for the physically handicapped (%)
People in Group quarters - Wards in general hospitals for patients who have no usual home elsewhere (%)
People in Group quarters - Wards in military hospitals for patients who have no usual home elsewhere (%)
People in Group quarters - Juvenile institutions (%)
People in Group quarters - Long-term care (%)
People in Group quarters - Homes for abused, dependent, and neglected children (%)
People in Group quarters - Residential treatment centers for emotionally disturbed children (%)
People in Group quarters - Training schools for juvenile delinquents (%)
People in Group quarters - Short-term care, detention or diagnostic centers for delinquent children (%)
People in Group quarters - Type of juvenile institution unknown (%)
People in Group quarters - Noninstitutionalized population (%)
People in Group quarters - College dormitories (includes college quarters off campus) (%)
People in Group quarters - Military quarters (%)
People in Group quarters - On base (%)
People in Group quarters - Barracks, unaccompanied personnel housing (UPH), (Enlisted/Officer), ;and similar group living quarters for military personnel (%)
People in Group quarters - Transient quarters for temporary residents (%)
People in Group quarters - Military ships (%)
People in Group quarters - Group homes (%)
People in Group quarters - Homes or halfway houses for drug/alcohol abuse (%)
People in Group quarters - Homes for the mentally ill (%)
People in Group quarters - Homes for the mentally retarded (%)
People in Group quarters - Homes for the physically handicapped (%)
People in Group quarters - Other group homes (%)
People in Group quarters - Religious group quarters (%)
People in Group quarters - Dormitories (%)
People in Group quarters - Agriculture workers' dormitories on farms (%)
People in Group quarters - Job Corps and vocational training facilities (%)
People in Group quarters - Other workers' dormitories (%)
People in Group quarters - Crews of maritime vessels (%)
People in Group quarters - Other nonhousehold living situations (%)
People in Group quarters - Other noninstitutional group quarters (%)
Residents speaking English at home (%)
Residents speaking English at home - Born in the United States (%)
Residents speaking English at home - Native, born elsewhere (%)
Residents speaking English at home - Foreign born (%)
Residents speaking Spanish at home (%)
Residents speaking Spanish at home - Born in the United States (%)
Residents speaking Spanish at home - Native, born elsewhere (%)
Residents speaking Spanish at home - Foreign born (%)
Residents speaking other language at home (%)
Residents speaking other language at home - Born in the United States (%)
Residents speaking other language at home - Native, born elsewhere (%)
Residents speaking other language at home - Foreign born (%)
Class of Workers - Employee of private company (%)
Class of Workers - Self-employed in own incorporated business (%)
Class of Workers - Private not-for-profit wage and salary workers (%)
Class of Workers - Local government workers (%)
Class of Workers - State government workers (%)
Class of Workers - Federal government workers (%)
Class of Workers - Self-employed workers in own not incorporated business and Unpaid family workers (%)
House heating fuel used in houses and condos - Utility gas (%)
House heating fuel used in houses and condos - Bottled, tank, or LP gas (%)
House heating fuel used in houses and condos - Electricity (%)
House heating fuel used in houses and condos - Fuel oil, kerosene, etc. (%)
House heating fuel used in houses and condos - Coal or coke (%)
House heating fuel used in houses and condos - Wood (%)
House heating fuel used in houses and condos - Solar energy (%)
House heating fuel used in houses and condos - Other fuel (%)
House heating fuel used in houses and condos - No fuel used (%)
House heating fuel used in apartments - Utility gas (%)
House heating fuel used in apartments - Bottled, tank, or LP gas (%)
House heating fuel used in apartments - Electricity (%)
House heating fuel used in apartments - Fuel oil, kerosene, etc. (%)
House heating fuel used in apartments - Coal or coke (%)
House heating fuel used in apartments - Wood (%)
House heating fuel used in apartments - Solar energy (%)
House heating fuel used in apartments - Other fuel (%)
House heating fuel used in apartments - No fuel used (%)
Armed forces status - In Armed Forces (%)
Armed forces status - Civilian (%)
Armed forces status - Civilian - Veteran (%)
Armed forces status - Civilian - Nonveteran (%)
Fatal accidents locations in years 2005-2021
Fatal accidents locations in 2005
Fatal accidents locations in 2006
Fatal accidents locations in 2007
Fatal accidents locations in 2008
Fatal accidents locations in 2009
Fatal accidents locations in 2010
Fatal accidents locations in 2011
Fatal accidents locations in 2012
Fatal accidents locations in 2013
Fatal accidents locations in 2014
Fatal accidents locations in 2015
Fatal accidents locations in 2016
Fatal accidents locations in 2017
Fatal accidents locations in 2018
Fatal accidents locations in 2019
Fatal accidents locations in 2020
Fatal accidents locations in 2021
Alcohol use - People drinking some alcohol every month (%)
Alcohol use - People not drinking at all (%)
Alcohol use - Average days/month drinking alcohol
Alcohol use - Average drinks/week
Alcohol use - Average days/year people drink much
Audiometry - Average condition of hearing (%)
Audiometry - People that can hear a whisper from across a quiet room (%)
Audiometry - People that can hear normal voice from across a quiet room (%)
Audiometry - Ears ringing, roaring, buzzing (%)
Audiometry - Had a job exposure to loud noise (%)
Audiometry - Had off-work exposure to loud noise (%)
Blood Pressure & Cholesterol - Has high blood pressure (%)
Blood Pressure & Cholesterol - Checking blood pressure at home (%)
Blood Pressure & Cholesterol - Frequently checking blood cholesterol (%)
Blood Pressure & Cholesterol - Has high cholesterol level (%)
Consumer Behavior - Money monthly spent on food at supermarket/grocery store
Consumer Behavior - Money monthly spent on food at other stores
Consumer Behavior - Money monthly spent on eating out
Consumer Behavior - Money monthly spent on carryout/delivered foods
Consumer Behavior - Income spent on food at supermarket/grocery store (%)
Consumer Behavior - Income spent on food at other stores (%)
Consumer Behavior - Income spent on eating out (%)
Consumer Behavior - Income spent on carryout/delivered foods (%)
Current Health Status - General health condition (%)
Current Health Status - Blood donors (%)
Current Health Status - Has blood ever tested for HIV virus (%)
Current Health Status - Left-handed people (%)
Dermatology - People using sunscreen (%)
Diabetes - Diabetics (%)
Diabetes - Had a blood test for high blood sugar (%)
Diabetes - People taking insulin (%)
Diet Behavior & Nutrition - Diet health (%)
Diet Behavior & Nutrition - Milk product consumption (# of products/month)
Diet Behavior & Nutrition - Meals not home prepared (#/week)
Diet Behavior & Nutrition - Meals from fast food or pizza place (#/week)
Diet Behavior & Nutrition - Ready-to-eat foods (#/month)
Diet Behavior & Nutrition - Frozen meals/pizza (#/month)
Drug Use - People that ever used marijuana or hashish (%)
Drug Use - Ever used hard drugs (%)
Drug Use - Ever used any form of cocaine (%)
Drug Use - Ever used heroin (%)
Drug Use - Ever used methamphetamine (%)
Health Insurance - People covered by health insurance (%)
Kidney Conditions-Urology - Avg. # of times urinating at night
Medical Conditions - People with asthma (%)
Medical Conditions - People with anemia (%)
Medical Conditions - People with psoriasis (%)
Medical Conditions - People with overweight (%)
Medical Conditions - Elderly people having difficulties in thinking or remembering (%)
Medical Conditions - People who ever received blood transfusion (%)
Medical Conditions - People having trouble seeing even with glass/contacts (%)
Medical Conditions - People with arthritis (%)
Medical Conditions - People with gout (%)
Medical Conditions - People with congestive heart failure (%)
Medical Conditions - People with coronary heart disease (%)
Medical Conditions - People with angina pectoris (%)
Medical Conditions - People who ever had heart attack (%)
Medical Conditions - People who ever had stroke (%)
Medical Conditions - People with emphysema (%)
Medical Conditions - People with thyroid problem (%)
Medical Conditions - People with chronic bronchitis (%)
Medical Conditions - People with any liver condition (%)
Medical Conditions - People who ever had cancer or malignancy (%)
Mental Health - People who have little interest in doing things (%)
Mental Health - People feeling down, depressed, or hopeless (%)
Mental Health - People who have trouble sleeping or sleeping too much (%)
Mental Health - People feeling tired or having little energy (%)
Mental Health - People with poor appetite or overeating (%)
Mental Health - People feeling bad about themself (%)
Mental Health - People who have trouble concentrating on things (%)
Mental Health - People moving or speaking slowly or too fast (%)
Mental Health - People having thoughts they would be better off dead (%)
Oral Health - Average years since last visit a dentist
Oral Health - People embarrassed because of mouth (%)
Oral Health - People with gum disease (%)
Oral Health - General health of teeth and gums (%)
Oral Health - Average days a week using dental floss/device
Oral Health - Average days a week using mouthwash for dental problem
Oral Health - Average number of teeth
Pesticide Use - Households using pesticides to control insects (%)
Pesticide Use - Households using pesticides to kill weeds (%)
Physical Activity - People doing vigorous-intensity work activities (%)
Physical Activity - People doing moderate-intensity work activities (%)
Physical Activity - People walking or bicycling (%)
Physical Activity - People doing vigorous-intensity recreational activities (%)
Physical Activity - People doing moderate-intensity recreational activities (%)
Physical Activity - Average hours a day doing sedentary activities
Physical Activity - Average hours a day watching TV or videos
Physical Activity - Average hours a day using computer
Physical Functioning - People having limitations keeping them from working (%)
Physical Functioning - People limited in amount of work they can do (%)
Physical Functioning - People that need special equipment to walk (%)
Physical Functioning - People experiencing confusion/memory problems (%)
Physical Functioning - People requiring special healthcare equipment (%)
Prescription Medications - Average number of prescription medicines taking
Preventive Aspirin Use - Adults 40+ taking low-dose aspirin (%)
Reproductive Health - Vaginal deliveries (%)
Reproductive Health - Cesarean deliveries (%)
Reproductive Health - Deliveries resulted in a live birth (%)
Reproductive Health - Pregnancies resulted in a delivery (%)
Reproductive Health - Women breastfeeding newborns (%)
Reproductive Health - Women that had a hysterectomy (%)
Reproductive Health - Women that had both ovaries removed (%)
Reproductive Health - Women that have ever taken birth control pills (%)
Reproductive Health - Women taking birth control pills (%)
Reproductive Health - Women that have ever used Depo-Provera or injectables (%)
Reproductive Health - Women that have ever used female hormones (%)
Sexual Behavior - People 18+ that ever had sex (vaginal, anal, or oral) (%)
Sexual Behavior - Males 18+ that ever had vaginal sex with a woman (%)
Sexual Behavior - Males 18+ that ever performed oral sex on a woman (%)
Sexual Behavior - Males 18+ that ever had anal sex with a woman (%)
Sexual Behavior - Males 18+ that ever had any sex with a man (%)
Sexual Behavior - Females 18+ that ever had vaginal sex with a man (%)
Sexual Behavior - Females 18+ that ever performed oral sex on a man (%)
Sexual Behavior - Females 18+ that ever had anal sex with a man (%)
Sexual Behavior - Females 18+ that ever had any kind of sex with a woman (%)
Sexual Behavior - Average age people first had sex
Sexual Behavior - Average number of female sex partners in lifetime (males 18+)
Sexual Behavior - Average number of female vaginal sex partners in lifetime (males 18+)
Sexual Behavior - Average age people first performed oral sex on a woman (18+)
Sexual Behavior - Average number of woman performed oral sex on in lifetime (18+)
Sexual Behavior - Average number of male sex partners in lifetime (males 18+)
Sexual Behavior - Average number of male anal sex partners in lifetime (males 18+)
Sexual Behavior - Average age people first performed oral sex on a man (18+)
Sexual Behavior - Average number of male oral sex partners in lifetime (18+)
Sexual Behavior - People using protection when performing oral sex (%)
Sexual Behavior - Average number of times people have vaginal or anal sex a year
Sexual Behavior - People having sex without condom (%)
Sexual Behavior - Average number of male sex partners in lifetime (females 18+)
Sexual Behavior - Average number of male vaginal sex partners in lifetime (females 18+)
Sexual Behavior - Average number of female sex partners in lifetime (females 18+)
Sexual Behavior - Circumcised males 18+ (%)
Sleep Disorders - Average hours sleeping at night
Sleep Disorders - People that has trouble sleeping (%)
Smoking-Cigarette Use - People smoking cigarettes (%)
Taste & Smell - People 40+ having problems with smell (%)
Taste & Smell - People 40+ having problems with taste (%)
Taste & Smell - People 40+ that ever had wisdom teeth removed (%)
Taste & Smell - People 40+ that ever had tonsils teeth removed (%)
Taste & Smell - People 40+ that ever had a loss of consciousness because of a head injury (%)
Taste & Smell - People 40+ that ever had a broken nose or other serious injury to face or skull (%)
Taste & Smell - People 40+ that ever had two or more sinus infections (%)
Weight - Average height (inches)
Weight - Average weight (pounds)
Weight - Average BMI
Weight - People that are obese (%)
Weight - People that ever were obese (%)
Weight - People trying to lose weight (%)
100%
urban population.
Estimated median house/condo value in 2022: $900,561
11379:
$900,561New York:
$400,400
According to our research of New York and other state lists, there were 4 registered sex offenders living in 11379 zip code as of April 26, 2024 . The ratio of all residents to sex offenders in zip code 11379 is 9,150 to 1.The ratio of registered sex offenders to all residents in this zip code is much lower than the state average.
Median resident age: This zip code:
45.7 yearsNew York median age:
40.0 years
Average household size: This zip code:
2.6 peopleNew York:
2.5 people
Averages for the 2020 tax year for zip code 11379, filed in 2021:
Average Adjusted Gross Income (AGI) in 2020: $70,558 (Individual Income Tax Returns) Here:
$70,558State:
$90,930
Salary/wage: $67,487 (reported on 76.8% of returns )Here:
$67,487State:
$72,104
(% of AGI for various income ranges: 936.6% for AGIs below $25k , 3329.3% for AGIs $25k-50k , 6861.8% for AGIs $50k-75k , 9948.7% for AGIs $75k-100k , 19065.0% for AGIs $100k-200k , 68293.1% for AGIs over 200k ) Taxable interest for individuals: $1,577 (reported on 41.4% of returns )This zip code:
$1,577New York:
$3,075
(% of AGI for various income ranges: 42.5% for AGIs below $25k , 51.9% for AGIs $25k-50k , 81.2% for AGIs $50k-75k , 138.1% for AGIs $75k-100k , 173.0% for AGIs $100k-200k , 834.4% for AGIs over 200k ) Ordinary dividends: $4,346 (reported on 21.4% of returns )(% of AGI for various income ranges: 32.0% for AGIs below $25k , 44.9% for AGIs $25k-50k , 89.4% for AGIs $50k-75k , 152.7% for AGIs $75k-100k , 309.1% for AGIs $100k-200k , 1711.9% for AGIs over 200k ) Net capital gain/loss in AGI: +$9,060 (reported on 20.2% of returns )Here:
+$9,060State:
+$44,925
(% of AGI for various income ranges: 13.6% for AGIs below $25k , 30.4% for AGIs $25k-50k , 86.6% for AGIs $50k-75k , 128.6% for AGIs $75k-100k , 397.0% for AGIs $100k-200k , 6824.7% for AGIs over 200k ) Profit/loss from business: +$9,515 (reported on 16.6% of returns )Here:
+$9,515State:
+$14,940
(% of AGI for various income ranges: 262.4% for AGIs below $25k , 212.6% for AGIs $25k-50k , 190.9% for AGIs $50k-75k , 165.3% for AGIs $75k-100k , 258.5% for AGIs $100k-200k , 1329.1% for AGIs over 200k ) Taxable individual retirement arrangement distribution: $15,605 (reported on 7.9% of returns )11379:
$15,605New York:
$19,609
(% of AGI for various income ranges: 66.5% for AGIs below $25k , 94.9% for AGIs $25k-50k , 161.8% for AGIs $50k-75k , 213.5% for AGIs $75k-100k , 392.7% for AGIs $100k-200k , 1481.2% for AGIs over 200k ) Self-employed (Keogh) retirement plans: $22,175 (reported on 0.2% of returns )11379:
$22,175New York:
$32,497
(% of AGI for various income ranges: 277.2% for AGIs over 200k ) Total itemized deductions: $27,316 (reported on 11.3% of returns )Here:
$27,316State:
$39,326
(% of AGI for various income ranges: 72.5% for AGIs below $25k , 152.2% for AGIs $25k-50k , 385.8% for AGIs $50k-75k , 586.0% for AGIs $75k-100k , 1216.5% for AGIs $100k-200k , 4046.2% for AGIs over 200k ) Charity contributions: $4,325 (reported on 9.3% of returns )(% of AGI for various income ranges: 4.3% for AGIs below $25k , 15.2% for AGIs $25k-50k , 35.3% for AGIs $50k-75k , 66.4% for AGIs $75k-100k , 158.5% for AGIs $100k-200k , 753.1% for AGIs over 200k ) Taxes paid: $9,084 (reported on 11.3% of returns )(% of AGI for various income ranges: 19.6% for AGIs below $25k , 47.9% for AGIs $25k-50k , 127.6% for AGIs $50k-75k , 210.5% for AGIs $75k-100k , 427.2% for AGIs $100k-200k , 1195.0% for AGIs over 200k ) Earned income credit: $1,779 (reported on 11.8% of returns )(% of AGI for various income ranges: 72.0% for AGIs below $25k , 55.8% for AGIs $25k-50k , 0.6% for AGIs $50k-75k ) Percentage of individuals using paid preparers for their 2020 taxes: 93.5%(% for various income ranges: 91.1% for AGIs below $25k , 93.7% for AGIs $25k-50k , 94.4% for AGIs $50k-75k , 94.4% for AGIs $75k-100k , 95.5% for AGIs $100k-200k , 94.8% for AGIs over 200k )
Averages for the 2012 tax year for zip code 11379, filed in 2013:
Average Adjusted Gross Income (AGI) in 2012: $60,798 (Individual Income Tax Returns) Here:
$60,798State:
$77,088
Salary/wage: $59,593 (reported on 78.6% of returns )Here:
$59,593State:
$60,593
(% of AGI for various income ranges: 58.3% for AGIs below $25k , 77.2% for AGIs $25k-50k , 80.3% for AGIs $50k-75k , 80.6% for AGIs $75k-100k , 82.4% for AGIs $100k-200k , 66.2% for AGIs over 200k ) Taxable interest for individuals: $1,210 (reported on 49.9% of returns )This zip code:
$1,210New York:
$3,125
(% of AGI for various income ranges: 2.5% for AGIs below $25k , 1.3% for AGIs $25k-50k , 0.9% for AGIs $50k-75k , 0.8% for AGIs $75k-100k , 0.8% for AGIs $100k-200k , 0.8% for AGIs over 200k ) Ordinary dividends: $3,220 (reported on 22.6% of returns )(% of AGI for various income ranges: 1.8% for AGIs below $25k , 1.2% for AGIs $25k-50k , 1.2% for AGIs $50k-75k , 1.0% for AGIs $75k-100k , 1.2% for AGIs $100k-200k , 1.2% for AGIs over 200k ) Net capital gain/loss in AGI: +$5,285 (reported on 17.4% of returns )Here:
+$5,285State:
+$42,474
(% of AGI for various income ranges: 0.2% for AGIs $50k-75k , 0.2% for AGIs $75k-100k , 0.7% for AGIs $100k-200k , 8.1% for AGIs over 200k ) Profit/loss from business: +$10,977 (reported on 15.0% of returns )Here:
+$10,977State:
+$16,168
(% of AGI for various income ranges: 15.6% for AGIs below $25k , 3.7% for AGIs $25k-50k , 1.8% for AGIs $50k-75k , 1.7% for AGIs $75k-100k , 1.2% for AGIs $100k-200k , 1.8% for AGIs over 200k ) Taxable individual retirement arrangement distribution: $11,641 (reported on 10.7% of returns )11379:
$11,641New York:
$17,621
(% of AGI for various income ranges: 3.9% for AGIs below $25k , 2.8% for AGIs $25k-50k , 2.0% for AGIs $50k-75k , 2.2% for AGIs $75k-100k , 1.5% for AGIs $100k-200k , 1.8% for AGIs over 200k ) Self-employment retirement plans: $10,667 (reported on 0.3% of returns )11379:
$10,667New York:
$27,330
Total itemized deductions: $24,119 (24% of AGI, reported on 42.0% of returns )Here:
$24,119State:
$34,985
Here:
23.9% of AGIState:
21.3% of AGI
(% of AGI for various income ranges: 9.3% for AGIs below $25k , 12.7% for AGIs $25k-50k , 14.9% for AGIs $50k-75k , 17.3% for AGIs $75k-100k , 19.0% for AGIs $100k-200k , 19.4% for AGIs over 200k ) Charity contributions: $2,310 (reported on 36.8% of returns )(% of AGI for various income ranges: 0.6% for AGIs below $25k , 1.2% for AGIs $25k-50k , 1.4% for AGIs $50k-75k , 1.5% for AGIs $75k-100k , 1.6% for AGIs $100k-200k , 1.2% for AGIs over 200k ) Taxes paid: $11,373 (reported on 41.9% of returns )11379:
$11,373State:
$18,656
(% of AGI for various income ranges: 2.5% for AGIs below $25k , 3.8% for AGIs $25k-50k , 6.1% for AGIs $50k-75k , 8.1% for AGIs $75k-100k , 10.0% for AGIs $100k-200k , 10.6% for AGIs over 200k ) Earned income credit: $1,828 (reported on 12.7% of returns )(% of AGI for various income ranges: 4.6% for AGIs below $25k , 0.7% for AGIs $25k-50k ) Percentage of individuals using paid preparers for their 2012 taxes: 73.3%(% for various income ranges: 70.2% for AGIs below $25k , 72.0% for AGIs $25k-50k , 73.4% for AGIs $50k-75k , 76.6% for AGIs $75k-100k , 78.8% for AGIs $100k-200k , 78.3% for AGIs over 200k )
Averages for the 2004 tax year for zip code 11379, filed in 2005:
Average Adjusted Gross Income (AGI) in 2004: $50,482 (Individual Income Tax Returns) Here:
$50,482State:
$59,519
Salary/wage: $49,884 (reported on 79.2% of returns )Here:
$49,884State:
$50,673
(% of AGI for various income ranges: 76.2% for AGIs below $10k , 62.4% for AGIs $10k-25k , 82.6% for AGIs $25k-50k , 83.0% for AGIs $50k-75k , 83.0% for AGIs $75k-100k , 73.9% for AGIs over 100k ) Taxable interest for individuals: $1,637 (reported on 65.7% of returns )This zip code:
$1,637New York:
$2,377
(% of AGI for various income ranges: 13.3% for AGIs below $10k , 5.2% for AGIs $10k-25k , 2.2% for AGIs $25k-50k , 2.2% for AGIs $50k-75k , 1.8% for AGIs $75k-100k , 1.2% for AGIs over 100k ) Taxable dividends: $2,207 (reported on 28.9% of returns )(% of AGI for various income ranges: 4.6% for AGIs below $10k , 2.2% for AGIs $10k-25k , 1.0% for AGIs $25k-50k , 1.0% for AGIs $50k-75k , 1.3% for AGIs $75k-100k , 1.2% for AGIs over 100k ) Net capital gain/loss: +$7,614 (reported on 22.4% of returns )Here:
+$7,614State:
+$23,581
(% of AGI for various income ranges: -1.4% for AGIs below $10k , -0.1% for AGIs $10k-25k , 0.2% for AGIs $25k-50k , 0.4% for AGIs $50k-75k , 0.7% for AGIs $75k-100k , 9.0% for AGIs over 100k ) Profit/loss from business: +$9,775 (reported on 12.9% of returns )Here:
+$9,775State:
+$13,809
(% of AGI for various income ranges: 22.9% for AGIs below $10k , 8.9% for AGIs $10k-25k , 2.5% for AGIs $25k-50k , 1.5% for AGIs $50k-75k , 1.4% for AGIs $75k-100k , 1.7% for AGIs over 100k ) IRA payment deduction: $3,393 (reported on 4.4% of returns )11379:
$3,393New York:
$3,115
(% of AGI for various income ranges: 0.3% for AGIs below $10k , 0.5% for AGIs $10k-25k , 0.5% for AGIs $25k-50k , 0.3% for AGIs $50k-75k , 0.2% for AGIs $75k-100k , 0.2% for AGIs over 100k ) Self-employed pension: $9,973 (reported on 0.5% of returns )Here:
$9,973New York:
$19,016
(% of AGI for various income ranges: 0.1% for AGIs $10k-25k , 0.0% for AGIs $50k-75k , 0.1% for AGIs $75k-100k , 0.2% for AGIs over 100k ) Total itemized deductions: $20,318 (25% of AGI, reported on 45.2% of returns )Here:
$20,318State:
$25,864
Here:
25.5% of AGIState:
21.9% of AGI
(% of AGI for various income ranges: 14.5% for AGIs below $10k , 12.7% for AGIs $10k-25k , 16.1% for AGIs $25k-50k , 18.4% for AGIs $50k-75k , 18.8% for AGIs $75k-100k , 20.1% for AGIs over 100k ) Charity contributions deductions: $2,412 (3% of AGI, reported on 42.6% of returns )Here:
3.0% of AGIState:
3.6% of AGI
(% of AGI for various income ranges: 0.7% for AGIs below $10k , 1.3% for AGIs $10k-25k , 2.0% for AGIs $25k-50k , 2.4% for AGIs $50k-75k , 2.3% for AGIs $75k-100k , 1.9% for AGIs over 100k ) Total tax: $6,935 (reported on 81.2% of returns )11379:
$6,935State:
$11,730
(% of AGI for various income ranges: 4.5% for AGIs below $10k , 4.4% for AGIs $10k-25k , 7.4% for AGIs $25k-50k , 9.8% for AGIs $50k-75k , 10.8% for AGIs $75k-100k , 15.7% for AGIs over 100k ) Earned income credit: $1,433 (reported on 9.4% of returns )Percentage of individuals using paid preparers for their 2004 taxes: 71.5%(% for various income ranges: 65.4% for AGIs below $10k , 71.5% for AGIs $10k-25k , 69.9% for AGIs $25k-50k , 73.6% for AGIs $50k-75k , 75.8% for AGIs $75k-100k , 77.1% for AGIs over 100k )
Estimated median household income in 2022: This zip code:
$87,489New York:
$79,557
Nearest zip codes: 11385 ,
11374 ,
11373 ,
11421 ,
11378 ,
11375 .
New York Zip Code Map
Percentage of family households: This zip code:
42.7%New York:
41.3%
Percentage of households with unmarried partners: This zip code:
5.3%New York:
42.3%
Likely homosexual households (counted as self-reported same-sex unmarried-partner households)
Lesbian couples: 0.0% of all households Gay men: 0.1% of all households
Household received Food Stamps/SNAP in the past 12 months: 1,509Household did not receive Food Stamps/SNAP in the past 12 months: 12,516
Women who had a birth in the past 12 months: 308 (230 now married , 77 unmarried) Women who did not have a birth in the past 12 months: 7,538 (3,412 now married , 4,093 unmarried)
Housing units in zip code 11379 with a mortgage: 3,993 (348
second mortgage , 6
home equity loan , 282
both second mortgage and home equity loan )
Houses without a mortgage: 123
Median monthly owner costs for units with a mortgage: $3,065
Median monthly owner costs for units without a mortgage: $1,044
Residents with income below the poverty level in 2022:
This zip code:
7.8%Whole state:
14.3%
Residents with income below 50% of the poverty level in 2022:
This zip code:
4.3%Whole state:
6.8%
Median number of rooms in houses and condos: Median number of rooms in apartments:
Year house built (houses)
16 2020 or later220 2010 to 2019327 2000 to 2009328 1990 to 1999545 1980 to 19891,261 1970 to 19792,232 1960 to 19693,331 1950 to 19592,353 1940 to 19494,405 1939 or earlier
Zip code 11379 household income distribution in 2022 678 Less than $10,000360 $10,000 to $14,999402 $15,000 to $19,999474 $20,000 to $24,999349 $25,000 to $29,999488 $30,000 to $34,999450 $35,000 to $39,999305 $40,000 to $44,999441 $45,000 to $49,999893 $50,000 to $59,9991,265 $60,000 to $74,9991,591 $75,000 to $99,9991,330 $100,000 to $124,9991,256 $125,000 to $149,9991,717 $150,000 to $199,9992,052 $200,000 or moreEstimate of home value of owner-occupied houses/condos in 2022 in zip code 11379 205 Less than $10,0006 $10,000 to $14,9997 $20,000 to $24,99947 $50,000 to $59,99910 $70,000 to $79,99925 $80,000 to $89,9999 $90,000 to $99,99955 $100,000 to $124,99968 $125,000 to $149,9999 $150,000 to $174,99919 $175,000 to $199,99976 $250,000 to $299,999256 $300,000 to $399,999187 $400,000 to $499,9991,242 $500,000 to $749,9994,659 $750,000 to $999,9991,354 $1,000,000 to $1,499,999220 $1,500,000 to $1,999,99987 $2,000,000 or moreRent paid by renters in 2022 in zip code 11379 50 $200 to $2494 $300 to $3496 $400 to $44916 $500 to $5498 $550 to $59947 $600 to $64995 $800 to $899112 $900 to $999590 $1,000 to $1,249579 $1,250 to $1,4992,512 $1,500 to $1,9991,079 $2,000 to $2,499364 $2,500 to $2,999126 $3,000 to $3,49921 $3,500 or more316 No cash rent
Median gross rent in 2022: $1,871.
Median price asked for vacant for-sale houses and condos in 2022: $799,094.
Estimated median house (or condo) value in 2022 for: White Non-Hispanic householders: $858,764Asian householders: $799,757Some other race householders: $829,260Two or more races householders: $878,082Hispanic or Latino householders: $898,453Estimated median house or condo value in 2022: $900,561
11379:
$900,561New York:
$400,400
Lower value quartile - upper value quartile: $778,155 - $1,002,581
Mean price in 2022: Detached houses: $915,544Here:
$915,544State:
$476,719
Townhouses or other attached units: $968,368Here:
$968,368State:
$699,270
In 2-unit structures: $1,292,553Here:
$1,292,553State:
$713,077
In 3-to-4-unit structures: $770,417Here:
$770,417State:
$764,568
In 5-or-more-unit structures: $567,433Here:
$567,433State:
$912,009
Housing units in structures:
One, detached: 1,557One, attached: 4,717Two: 4,9083 or 4: 2,0775 to 9: 20910 to 19: 42320 to 49: 65250 or more: 519Mobile homes: 60Boats, RVs, vans, etc.: 9Unemployment : 3.6%
Means of transportation to work in zip code 11379 40.7% 7,360 Drove a car alone6.9% 1,255 Carpooled9.5% 1,708 Bus or trolley bus25.2% 4,553 Streetcar or trolley car0.3% 62 Subway or elevated0.1% 17 Railroad0.2% 44 Taxi0.2% 29 Motorcycle0.4% 74 Bicycle3.0% 550 Walked1.9% 345 Other means10.1% 1,818 Worked at homeTravel time to work (commute) in zip code 11379 194 Less than 5 minutes288 5 to 9 minutes635 10 to 14 minutes956 15 to 19 minutes1,920 20 to 24 minutes520 25 to 29 minutes1,947 30 to 34 minutes411 35 to 39 minutes1,146 40 to 44 minutes2,532 45 to 59 minutes4,330 60 to 89 minutes1,179 90 or more minutes
Neighborhoods in zip code 11379: Percentage of zip code residents living and working in this county: 50.9%
Household type by relationship:
Households: 37,653
Male householders: 7,364 (1,696 living alone ), Female householders: 6,738 (1,782 living alone )7,387 spouses (7,338 opposite-sex spouses ), 901 unmarried partners , (837 opposite-sex unmarried partners ), 10,481 children (10,058 natural , 167 adopted , 257 stepchildren ), 604 grandchildren , 819 brothers or sisters , 1,030 parents , 47 foster children , 624 other relatives , 1,140 non-relatives In group quarters: 345 (-1 institutionalized population )
Size of family households: 3,814 2-persons , 2,425 3-persons , 2,095 4-persons , 901 5-persons , 252 6-persons , 182 7-or-more-persons
Size of nonfamily households: 3,480 1-person , 791 2-persons , 47 3-persons , 45 4-persons , 10 6-persons
5,021 married couples with children. single-parent households (465 men , 889 women ).
51.0% of residents of 11379 zip code speak English at home. of residents speak Spanish at home (62% very well, 24% well, 10% not well, 4% not at all ).of residents speak other Indo-European language at home (58% very well, 28% well, 12% not well, 2% not at all ).of residents speak Asian or Pacific Island language at home (54% very well, 23% well, 15% not well, 8% not at all ).of residents speak other language at home (63% very well, 11% well, 20% not well, 6% not at all ).
Foreign born population: 14,256 (37.9%)
(67.6%
of them are naturalized citizens )
This zip code:
37.9%Whole state:
22.7%
13% North Macedonia (Macedonia) 12% Chile 6% Ukraine 5% Greece 5% Ecuador 4% Colombia 3% Kazakhstan 18% Italian 13% Polish 6% Irish 3% American 3% Albanian 2% Romanian 2% German
Year of entry for the foreign-born population
2,845 2010 or later 3,766 2000 to 2009 3,756 1990 to 1999 4,564 Before 1990
Facilities with environmental interests located in this zip code:
ACOSTA'S FINE FRENCH DRY CLEANERS & LAUN (73-20 METROPOLITAN AVENUE in MIDDLE VILLAGE, NY)
AIR MINOR (AIRS/AFS) Conditionally Exempt Small Quantity Generators, less than 100 kg/month of hazardous waste (Resource Conservation and Recovery Act (tracking hazardous waste)) - notification Business SIC classification: DRYCLEANING PLANTS, EXCEPT RUG CLEANINGOrganizations: ACOSTAS DRY CLEANERS (CONTACT/OWNER)
Alternative names: ACOSTAS DRY CLEANERS, ACOSTA'S FINE FRENCH dry CLEANERS & laundry
58-21 - SPECIALIZED INDUSTRIAL SERVICES (58-21 78TH STREET in FLUSHING, NY)
FORMAL ENFORCEMENT ACTION (Integrated Compliance Information System) - ICIS-02-2005-1048, ENFORCEMENT/COMPLIANCE ACTIVITY
CON EDISON - MH 185A (58TH STREET AND RUST ST in MIDDLE VILLAGE, NY)
Large Quantity Generators, more that 1000 kg of hazardous waste/month (Resource Conservation and Recovery Act (tracking hazardous waste)) Organizations: CONSOLIDATED EDISON COMPANY OF NY, INC. (CONTACT/OPERATOR)
GRAFFEO INGRA SERVICE STATION (62-52 METROPOLITAN AVENUE in MIDDLE VILLAGE, NY)
AIR MINOR (AIRS/AFS) Business SIC classification: GASOLINE SERVICE STATIONSAlternative names: GRAFFEO-INGRA SVCE STA
ABCO REFRIGERATION (66-26 RENTAR PLZ in MIDDLE VILLAGE, NY)
Small Quantity Generators, between 100 kg and 1000 kg of hazardous waste/month (Resource Conservation and Recovery Act (tracking hazardous waste)) - notification Organizations: RENTAR DEVELOPMENT CORP (CONTACT/OWNER)
ARROW CONTAINERS INC (66-48 73RD PL in MIDDLE VILLAGE, NY)
TRANSPORTER (Resource Conservation and Recovery Act (tracking hazardous waste)) Organizations: CAROL ANN KRUZYNSKI (CONTACT/OWNER)
Housing units lacking complete plumbing facilities: 1.5%
Housing units lacking complete kitchen facilities: 3.3%
84.4% Utility gas 6.5% Fuel oil, kerosene, etc. 5.5% Electricity 2.2% Bottled, tank, or LP gas 0.9% Other fuel
Population in 1990: 28,981. Population change in the 1990s: +3 (+0.0%).
Place of birth for U.S.-born residents:
This state: 21,000Northeast: 487Midwest: 202South: 465West: 301
72% of the 11379 zip code residents lived in the same house 5 years ago.
Out of people who lived in different houses, 80% lived in this county.
Out of people who lived in different counties, 50% lived in New York.
93% of the 11379 zip code residents lived in the same house 1 year ago.
Out of people who lived in different houses, 76% moved from this county.
Out of people who lived in different houses, 14% moved from different county within same state.
Out of people who lived in different houses, 3% moved from different state.
Out of people who lived in different houses, 5% moved from abroad.
Private vs. public school enrollment:
Students in private schools in grades 1 to 8 (elementary and middle school): 368
Students in private schools in grades 9 to 12 (high school): 618
Students in private undergraduate colleges: 436
Occupation by median earnings in the past 12 months ($)
103,974 Legal occupations 93,636 Health diagnosing and treating practitioners and other technical occupations 91,133 Architecture and engineering occupations 88,774 Computer and mathematical occupations 83,215 Management occupations 74,953 Community and social service occupations
Companies with federal contracts located in this zip code:
POWER JAMB, LLC (6419 65TH STREET in MIDDLE VILLAGE, NY; small business) in 2 contracts from 2005 to 2006
$6,469 with Air Force for Training Aids. Signed on 2006-06-13. Completion date: 2006-07-13.
with Navy for Miscellaneous Items. Signed on 2005-09-21. Completion date: 2005-09-30.
Top industries in this zip code by the number of employees in 2005:
Educational Services: Elementary and Secondary Schools (250-499 employees: 1 establishment, 100-249 employees: 1 establishment, 20-49 employees: 2 establishments)Health Care and Social Assistance: Nursing Care Facilities (250-499: 1)Other Services (except Public Administration): Cemeteries and Crematories (100-249: 1, 20-49: 1, 10-19: 1)Accommodation and Food Services: Limited-Service Restaurants (20-49: 4, 5-9: 4, 1-4: 10)Other Services (except Public Administration): Religious Organizations (50-99: 1, 20-49: 1, 5-9: 1, 1-4: 5)
People in group quarters in 2010:
340 people in nursing facilities/skilled-nursing facilities
9 people in other noninstitutional facilities
People in group quarters in 2000:
539 people in nursing homes
19 people in religious group quarters
3 people in other nonhousehold living situations
Fatal accident statistics in 2014:
Fatal accident count: 1Vehicles involved in fatal accidents: 1Fatal accidents caused by drunken drivers: 0Fatalities: 1Persons involved in fatal accidents: 1Pedestrians involved in fatal accidents: 1
Fatal accident statistics in 2011:
Fatal accident count: 1Vehicles involved in fatal accidents: 1Fatal accidents caused by drunken drivers: 0Fatalities: 1Persons involved in fatal accidents: 1Pedestrians involved in fatal accidents: 1
Home Mortgage Disclosure Act Aggregated Statistics For Year 2009(Based on 13 full and 12 partial tracts) A) FHA, FSA/RHS & VA B) Conventional C) Refinancings D) Home Improvement Loans E) Loans on Dwellings For 5+ Families F) Non-occupant Loans on G) Loans On Manufactured Number Average Value Number Average Value Number Average Value Number Average Value Number Average Value Number Average Value Number Average Value
LOANS ORIGINATED 49 $443,966 184 $354,712 266 $298,737 31 $148,216 1 $267,160 21 $365,104 2 $401,905 APPLICATIONS APPROVED, NOT ACCEPTED 4 $513,633 30 $349,804 44 $306,732 1 $18,000 0 $0 3 $336,260 0 $0 APPLICATIONS DENIED 23 $498,033 51 $377,801 213 $357,076 39 $129,784 0 $0 27 $327,761 0 $0 APPLICATIONS WITHDRAWN 14 $469,443 16 $398,492 90 $345,002 13 $130,472 0 $0 9 $361,149 0 $0 FILES CLOSED FOR INCOMPLETENESS 4 $548,120 14 $380,523 32 $302,954 4 $158,360 0 $0 0 $0 0 $0
Aggregated Statistics For Year 2008(Based on 13 full and 12 partial tracts) A) FHA, FSA/RHS & VA B) Conventional C) Refinancings D) Home Improvement Loans E) Loans on Dwellings For 5+ Families F) Non-occupant Loans on G) Loans On Manufactured Number Average Value Number Average Value Number Average Value Number Average Value Number Average Value Number Average Value Number Average Value
LOANS ORIGINATED 19 $515,348 192 $379,784 181 $283,181 67 $92,693 3 $338,847 24 $396,943 2 $388,855 APPLICATIONS APPROVED, NOT ACCEPTED 0 $0 29 $380,510 66 $345,258 22 $90,159 0 $0 5 $244,364 0 $0 APPLICATIONS DENIED 6 $503,957 80 $394,226 124 $351,252 63 $114,087 4 $1,353,898 22 $198,642 1 $25,000 APPLICATIONS WITHDRAWN 3 $587,260 15 $489,949 70 $353,528 8 $132,651 2 $7,266,100 8 $393,865 0 $0 FILES CLOSED FOR INCOMPLETENESS 0 $0 14 $485,584 21 $293,210 6 $138,645 0 $0 3 $361,017 0 $0
Aggregated Statistics For Year 2007(Based on 13 full and 12 partial tracts) A) FHA, FSA/RHS & VA B) Conventional C) Refinancings D) Home Improvement Loans E) Loans on Dwellings For 5+ Families F) Non-occupant Loans on G) Loans On Manufactured Number Average Value Number Average Value Number Average Value Number Average Value Number Average Value Number Average Value Number Average Value
LOANS ORIGINATED 1 $305,000 422 $338,394 335 $310,692 77 $140,962 9 $1,152,777 49 $343,350 0 $0 APPLICATIONS APPROVED, NOT ACCEPTED 0 $0 53 $314,707 106 $304,460 28 $127,642 0 $0 5 $373,778 0 $0 APPLICATIONS DENIED 0 $0 176 $337,237 216 $373,166 60 $133,720 0 $0 26 $409,604 4 $129,637 APPLICATIONS WITHDRAWN 0 $0 40 $344,166 95 $340,618 32 $214,277 2 $652,750 7 $460,113 0 $0 FILES CLOSED FOR INCOMPLETENESS 0 $0 17 $441,956 34 $321,931 4 $50,670 0 $0 3 $500,730 0 $0
Aggregated Statistics For Year 2006(Based on 13 full and 12 partial tracts) A) FHA, FSA/RHS & VA B) Conventional C) Refinancings D) Home Improvement Loans E) Loans on Dwellings For 5+ Families F) Non-occupant Loans on G) Loans On Manufactured Number Average Value Number Average Value Number Average Value Number Average Value Number Average Value Number Average Value Number Average Value
LOANS ORIGINATED 2 $367,910 505 $339,176 432 $297,100 88 $128,932 7 $515,210 51 $369,178 0 $0 APPLICATIONS APPROVED, NOT ACCEPTED 0 $0 112 $311,311 105 $294,356 19 $102,575 0 $0 12 $312,458 3 $211,597 APPLICATIONS DENIED 0 $0 217 $343,943 253 $311,055 109 $117,160 0 $0 27 $212,377 3 $99,350 APPLICATIONS WITHDRAWN 0 $0 72 $283,749 145 $311,052 16 $167,077 3 $687,047 13 $312,113 0 $0 FILES CLOSED FOR INCOMPLETENESS 0 $0 35 $338,441 48 $356,693 2 $100,000 0 $0 2 $331,160 0 $0
Aggregated Statistics For Year 2005(Based on 13 full and 12 partial tracts) A) FHA, FSA/RHS & VA B) Conventional C) Refinancings D) Home Improvement Loans E) Loans on Dwellings For 5+ Families F) Non-occupant Loans on G) Loans On Manufactured Number Average Value Number Average Value Number Average Value Number Average Value Number Average Value Number Average Value Number Average Value
LOANS ORIGINATED 1 $389,000 504 $335,393 427 $303,978 87 $120,868 5 $1,082,630 60 $338,045 1 $280,520 APPLICATIONS APPROVED, NOT ACCEPTED 0 $0 82 $366,703 92 $288,473 13 $127,931 0 $0 8 $353,772 0 $0 APPLICATIONS DENIED 0 $0 141 $360,691 214 $318,996 73 $157,458 1 $1,500,000 27 $360,963 1 $280,520 APPLICATIONS WITHDRAWN 1 $289,000 109 $322,243 203 $271,800 31 $166,709 1 $1,875,000 19 $321,797 0 $0 FILES CLOSED FOR INCOMPLETENESS 0 $0 40 $312,357 137 $325,572 14 $176,043 0 $0 7 $277,056 0 $0
Aggregated Statistics For Year 2004(Based on 13 full and 12 partial tracts) B) Conventional C) Refinancings D) Home Improvement Loans E) Loans on Dwellings For 5+ Families F) Non-occupant Loans on Number Average Value Number Average Value Number Average Value Number Average Value Number Average Value
LOANS ORIGINATED 449 $316,521 552 $253,268 73 $113,481 10 $428,878 63 $288,244 APPLICATIONS APPROVED, NOT ACCEPTED 70 $349,783 130 $246,477 18 $66,033 0 $0 20 $387,762 APPLICATIONS DENIED 78 $347,816 266 $287,652 76 $90,248 6 $520,658 17 $329,608 APPLICATIONS WITHDRAWN 62 $305,576 169 $230,659 13 $98,780 5 $340,568 9 $267,246 FILES CLOSED FOR INCOMPLETENESS 12 $335,679 36 $283,629 16 $141,274 0 $0 3 $164,577
Aggregated Statistics For Year 2003(Based on 13 full and 12 partial tracts) A) FHA, FSA/RHS & VA B) Conventional C) Refinancings D) Home Improvement Loans E) Loans on Dwellings For 5+ Families F) Non-occupant Loans on Number Average Value Number Average Value Number Average Value Number Average Value Number Average Value Number Average Value
LOANS ORIGINATED 16 $295,000 440 $285,016 1,236 $214,727 40 $58,783 11 $313,913 87 $234,251 APPLICATIONS APPROVED, NOT ACCEPTED 0 $0 62 $301,317 198 $217,002 13 $64,526 1 $654,540 15 $294,592 APPLICATIONS DENIED 3 $372,030 78 $333,124 353 $242,500 54 $71,968 3 $427,457 26 $229,219 APPLICATIONS WITHDRAWN 2 $164,085 36 $318,941 223 $214,299 13 $43,790 0 $0 15 $259,191 FILES CLOSED FOR INCOMPLETENESS 0 $0 16 $359,248 44 $267,707 4 $66,345 0 $0 2 $294,000
Aggregated Statistics For Year 2002(Based on 13 full and 10 partial tracts) A) FHA, FSA/RHS & VA B) Conventional C) Refinancings D) Home Improvement Loans E) Loans on Dwellings For 5+ Families F) Non-occupant Loans on Number Average Value Number Average Value Number Average Value Number Average Value Number Average Value Number Average Value
LOANS ORIGINATED 7 $265,369 372 $246,749 663 $196,270 50 $61,758 3 $460,850 56 $207,313 APPLICATIONS APPROVED, NOT ACCEPTED 0 $0 34 $264,036 123 $165,074 21 $64,677 0 $0 6 $114,490 APPLICATIONS DENIED 1 $283,000 44 $248,685 191 $179,344 39 $63,269 0 $0 11 $234,217 APPLICATIONS WITHDRAWN 0 $0 32 $229,613 142 $187,003 14 $40,181 0 $0 1 $253,800 FILES CLOSED FOR INCOMPLETENESS 0 $0 9 $289,039 39 $228,685 3 $22,533 1 $223,080 1 $54,000
Aggregated Statistics For Year 2001(Based on 13 full and 10 partial tracts) A) FHA, FSA/RHS & VA B) Conventional C) Refinancings D) Home Improvement Loans E) Loans on Dwellings For 5+ Families F) Non-occupant Loans on Number Average Value Number Average Value Number Average Value Number Average Value Number Average Value Number Average Value
LOANS ORIGINATED 10 $284,194 384 $221,818 382 $181,436 42 $56,293 2 $228,600 17 $200,149 APPLICATIONS APPROVED, NOT ACCEPTED 0 $0 52 $241,609 82 $171,645 15 $66,838 0 $0 5 $181,816 APPLICATIONS DENIED 3 $233,333 59 $248,024 123 $152,947 38 $56,244 3 $413,330 15 $231,153 APPLICATIONS WITHDRAWN 0 $0 26 $265,265 155 $165,733 34 $54,299 0 $0 10 $188,934 FILES CLOSED FOR INCOMPLETENESS 0 $0 9 $201,479 22 $114,611 5 $65,322 0 $0 1 $160,000
Aggregated Statistics For Year 2000(Based on 13 full and 10 partial tracts) A) FHA, FSA/RHS & VA B) Conventional C) Refinancings D) Home Improvement Loans E) Loans on Dwellings For 5+ Families F) Non-occupant Loans on Number Average Value Number Average Value Number Average Value Number Average Value Number Average Value Number Average Value
LOANS ORIGINATED 13 $224,549 328 $200,881 156 $124,163 49 $42,170 9 $1,064,317 17 $105,479 APPLICATIONS APPROVED, NOT ACCEPTED 2 $153,000 35 $230,451 49 $115,878 29 $33,311 0 $0 2 $59,960 APPLICATIONS DENIED 3 $232,580 51 $219,647 97 $118,539 33 $63,658 1 $247,120 4 $197,058 APPLICATIONS WITHDRAWN 5 $189,108 23 $170,534 112 $74,922 16 $47,569 0 $0 7 $79,166 FILES CLOSED FOR INCOMPLETENESS 0 $0 11 $235,725 8 $130,259 3 $103,563 0 $0 1 $208,000
Aggregated Statistics For Year 1999(Based on 9 full and 12 partial tracts) A) FHA, FSA/RHS & VA B) Conventional C) Refinancings D) Home Improvement Loans E) Loans on Dwellings For 5+ Families F) Non-occupant Loans on Number Average Value Number Average Value Number Average Value Number Average Value Number Average Value Number Average Value
LOANS ORIGINATED 12 $192,287 239 $180,667 173 $132,283 31 $36,125 7 $264,919 13 $144,086 APPLICATIONS APPROVED, NOT ACCEPTED 0 $0 21 $181,100 53 $125,881 10 $23,083 0 $0 0 $0 APPLICATIONS DENIED 4 $206,115 40 $166,519 80 $111,394 30 $24,524 1 $121,190 6 $121,513 APPLICATIONS WITHDRAWN 1 $196,770 20 $161,913 75 $101,563 11 $40,254 0 $0 1 $100,000 FILES CLOSED FOR INCOMPLETENESS 1 $161,450 5 $225,834 16 $156,636 0 $0 0 $0 3 $117,797
Private Mortgage Insurance Companies Aggregated Statistics For Year 2009(Based on 10 full and 8 partial tracts) A) Conventional B) Refinancings C) Non-occupant Loans on Number Average Value Number Average Value Number Average Value
LOANS ORIGINATED 9 $370,107 3 $553,203 0 $0 APPLICATIONS APPROVED, NOT ACCEPTED 1 $410,000 3 $391,450 0 $0 APPLICATIONS DENIED 11 $333,440 0 $0 0 $0 APPLICATIONS WITHDRAWN 0 $0 0 $0 0 $0 FILES CLOSED FOR INCOMPLETENESS 1 $266,000 0 $0 1 $266,000
Aggregated Statistics For Year 2008(Based on 12 full and 10 partial tracts) A) Conventional B) Refinancings C) Non-occupant Loans on Number Average Value Number Average Value Number Average Value
LOANS ORIGINATED 26 $408,877 4 $470,728 0 $0 APPLICATIONS APPROVED, NOT ACCEPTED 12 $435,231 2 $138,545 3 $545,760 APPLICATIONS DENIED 8 $414,478 2 $520,605 2 $266,000 APPLICATIONS WITHDRAWN 4 $508,982 1 $544,000 0 $0 FILES CLOSED FOR INCOMPLETENESS 1 $805,490 0 $0 1 $805,490
Aggregated Statistics For Year 2007(Based on 8 full and 8 partial tracts) A) Conventional B) Refinancings C) Non-occupant Loans on Number Average Value Number Average Value Number Average Value
LOANS ORIGINATED 15 $491,543 11 $527,127 1 $783,000 APPLICATIONS APPROVED, NOT ACCEPTED 3 $573,247 0 $0 0 $0 APPLICATIONS DENIED 0 $0 0 $0 0 $0 APPLICATIONS WITHDRAWN 1 $95,000 0 $0 0 $0 FILES CLOSED FOR INCOMPLETENESS 0 $0 0 $0 0 $0
Aggregated Statistics For Year 2006(Based on 6 full and 12 partial tracts) A) Conventional B) Refinancings Number Average Value Number Average Value
LOANS ORIGINATED 18 $411,035 2 $410,155 APPLICATIONS APPROVED, NOT ACCEPTED 5 $483,752 0 $0 APPLICATIONS DENIED 0 $0 0 $0 APPLICATIONS WITHDRAWN 0 $0 0 $0 FILES CLOSED FOR INCOMPLETENESS 0 $0 0 $0
Aggregated Statistics For Year 2005(Based on 7 full and 10 partial tracts) A) Conventional B) Refinancings C) Non-occupant Loans on Number Average Value Number Average Value Number Average Value
LOANS ORIGINATED 21 $365,641 4 $550,950 2 $344,090 APPLICATIONS APPROVED, NOT ACCEPTED 5 $441,166 0 $0 0 $0 APPLICATIONS DENIED 0 $0 0 $0 0 $0 APPLICATIONS WITHDRAWN 5 $343,782 0 $0 0 $0 FILES CLOSED FOR INCOMPLETENESS 0 $0 0 $0 0 $0
Aggregated Statistics For Year 2004(Based on 8 full and 10 partial tracts) A) Conventional B) Refinancings Number Average Value Number Average Value
LOANS ORIGINATED 32 $390,346 8 $353,212 APPLICATIONS APPROVED, NOT ACCEPTED 17 $301,946 2 $374,740 APPLICATIONS DENIED 1 $504,930 0 $0 APPLICATIONS WITHDRAWN 4 $354,692 0 $0 FILES CLOSED FOR INCOMPLETENESS 0 $0 0 $0
Aggregated Statistics For Year 2003(Based on 12 full and 12 partial tracts) A) Conventional B) Refinancings C) Non-occupant Loans on Number Average Value Number Average Value Number Average Value
LOANS ORIGINATED 46 $328,843 19 $314,008 1 $462,190 APPLICATIONS APPROVED, NOT ACCEPTED 27 $357,677 17 $278,425 2 $379,525 APPLICATIONS DENIED 2 $281,850 0 $0 0 $0 APPLICATIONS WITHDRAWN 2 $399,000 0 $0 0 $0 FILES CLOSED FOR INCOMPLETENESS 0 $0 0 $0 0 $0
Aggregated Statistics For Year 2002(Based on 13 full and 10 partial tracts) A) Conventional B) Refinancings C) Non-occupant Loans on Number Average Value Number Average Value Number Average Value
LOANS ORIGINATED 88 $286,204 15 $259,217 0 $0 APPLICATIONS APPROVED, NOT ACCEPTED 21 $284,478 8 $280,364 0 $0 APPLICATIONS DENIED 2 $131,615 0 $0 0 $0 APPLICATIONS WITHDRAWN 3 $241,443 2 $265,760 2 $191,160 FILES CLOSED FOR INCOMPLETENESS 0 $0 0 $0 0 $0
Aggregated Statistics For Year 2001(Based on 13 full and 10 partial tracts) A) Conventional B) Refinancings C) Non-occupant Loans on Number Average Value Number Average Value Number Average Value
LOANS ORIGINATED 84 $282,916 10 $236,359 0 $0 APPLICATIONS APPROVED, NOT ACCEPTED 21 $242,211 9 $290,252 1 $253,000 APPLICATIONS DENIED 2 $233,685 0 $0 0 $0 APPLICATIONS WITHDRAWN 3 $257,633 2 $129,120 0 $0 FILES CLOSED FOR INCOMPLETENESS 2 $384,730 0 $0 0 $0
Aggregated Statistics For Year 2000(Based on 13 full and 10 partial tracts) A) Conventional B) Refinancings C) Non-occupant Loans on Number Average Value Number Average Value Number Average Value
LOANS ORIGINATED 79 $231,635 0 $0 1 $208,000 APPLICATIONS APPROVED, NOT ACCEPTED 18 $250,426 1 $323,260 0 $0 APPLICATIONS DENIED 4 $217,732 0 $0 0 $0 APPLICATIONS WITHDRAWN 3 $242,203 0 $0 0 $0 FILES CLOSED FOR INCOMPLETENESS 2 $229,500 0 $0 0 $0
Aggregated Statistics For Year 1999(Based on 9 full and 12 partial tracts) A) Conventional B) Refinancings C) Non-occupant Loans on Number Average Value Number Average Value Number Average Value
LOANS ORIGINATED 89 $210,501 16 $191,702 1 $139,710 APPLICATIONS APPROVED, NOT ACCEPTED 12 $195,273 4 $201,000 0 $0 APPLICATIONS DENIED 7 $212,714 0 $0 0 $0 APPLICATIONS WITHDRAWN 0 $0 0 $0 0 $0 FILES CLOSED FOR INCOMPLETENESS 2 $178,930 0 $0 0 $0
2007 - 2018 National Fire Incident Reporting System (NFIRS) incidents See full 2006 National Fire Incident Reporting System statistics for zip code 11379, New York
Most common first names in zip code 11379 among deceased individuals Name Count Lived (average)
John 486 75.0 years Mary 439 81.2 years Joseph 416 75.7 years Anna 320 82.5 years William 256 74.8 years Frank 252 75.3 years Margaret 208 80.7 years Charles 208 74.5 years Rose 186 83.4 years Helen 179 80.0 years
Most common last names in zip code 11379 among deceased individuals Last name Count Lived (average)
Smith 38 76.0 years Miller 34 78.9 years Martin 27 75.6 years Meyer 26 76.7 years Russo 24 79.6 years Schneider 23 79.8 years Marino 23 77.0 years Schmidt 22 74.1 years Muller 22 80.4 years Bauer 20 79.0 years
Businesses in zip code 11379
Name Count Name Count
AT&T 1 Pizza Hut 1 Advance Auto Parts 1 RadioShack 1 Arby's 1 Raymour & Flanigan 1 Baskin-Robbins 2 Sears 1 Blockbuster 1 Subway 2 CVS 1 The Room Place 2 Curves 1 Toys"R"Us 1 Dunkin Donuts 2 True Value 2 Fashion Bug 1 Verizon Wireless 1 FedEx 1 Walgreens 1 KFC 1 Wendy's 1 Kmart 1
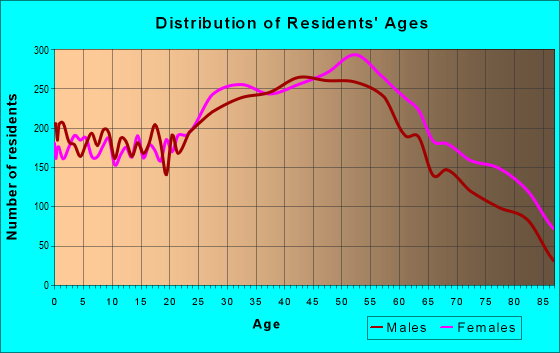
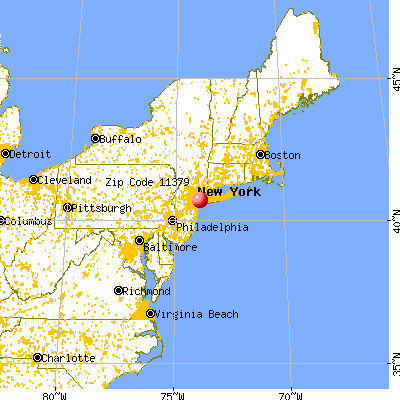


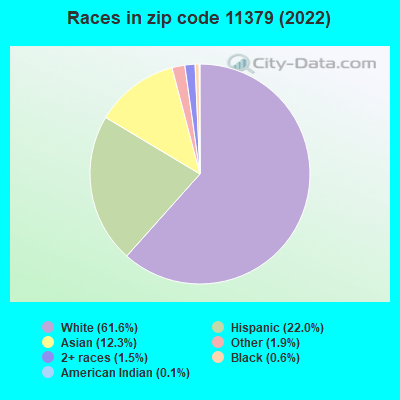


 Nearest zip codes: 11385, 11374, 11373, 11421, 11378, 11375.
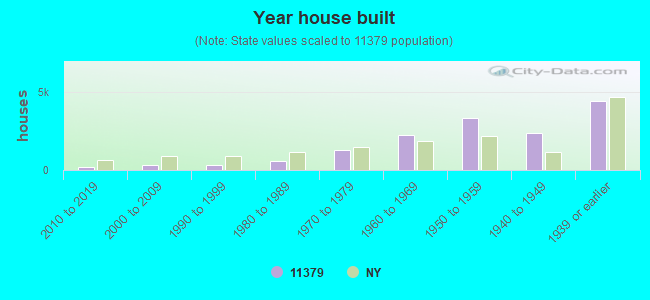
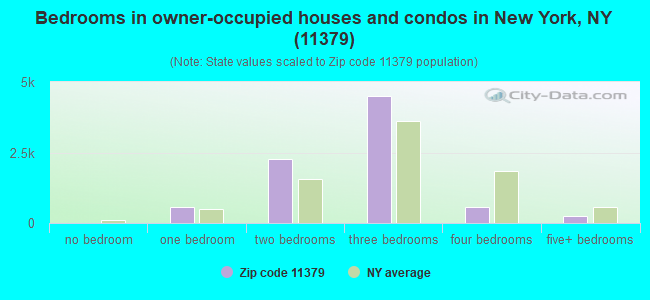
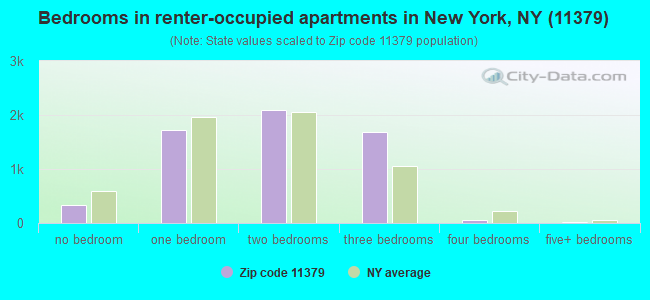
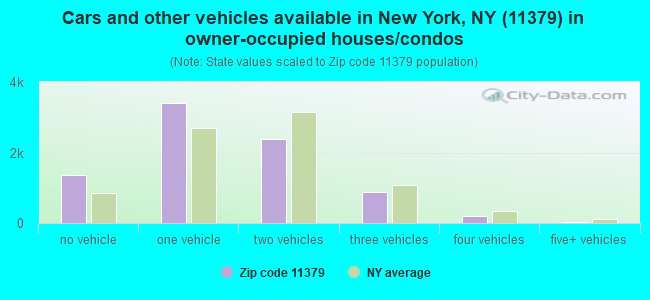
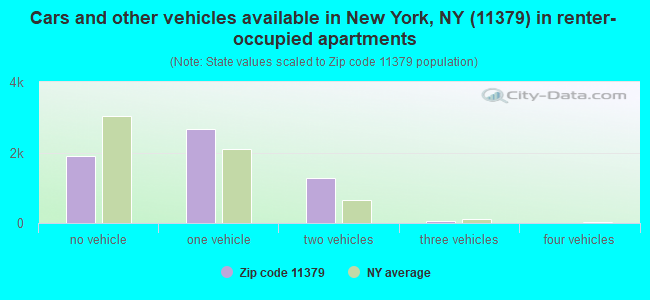


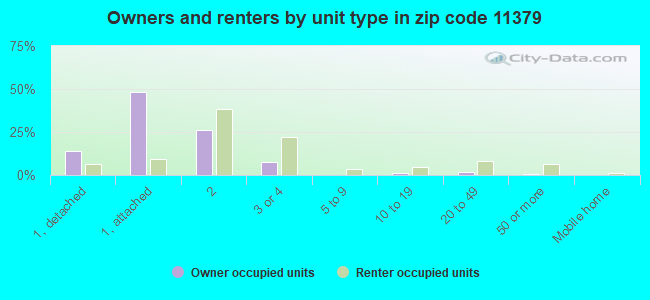
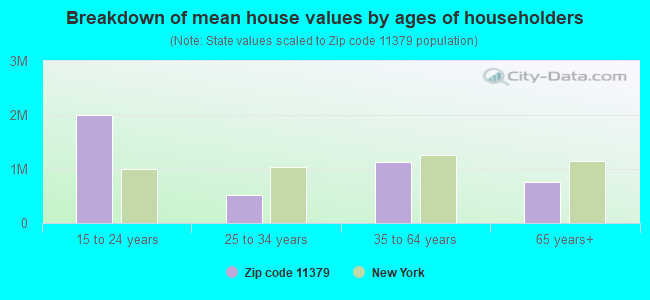


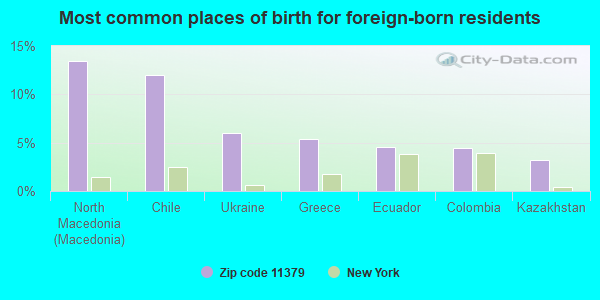
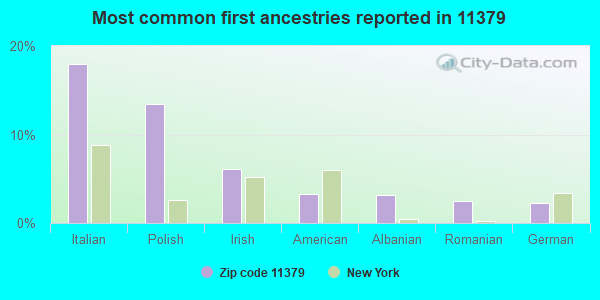
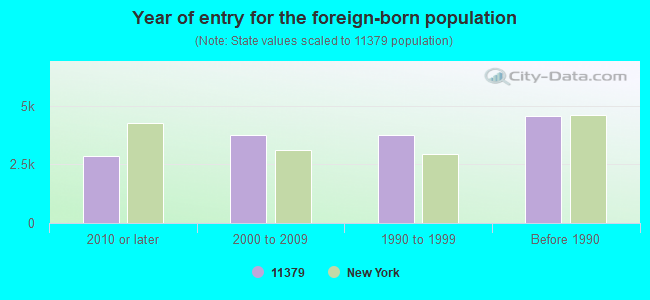


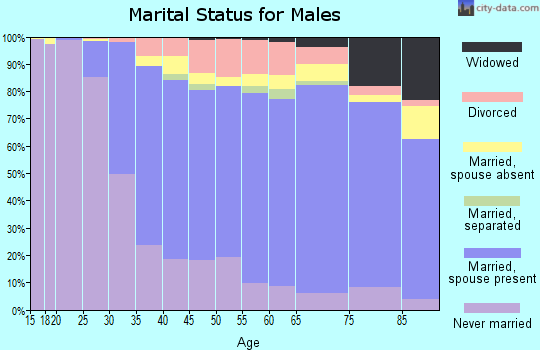
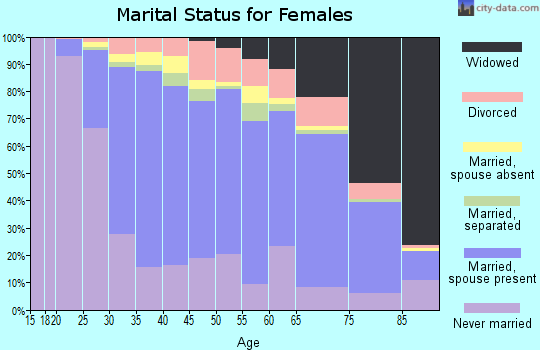
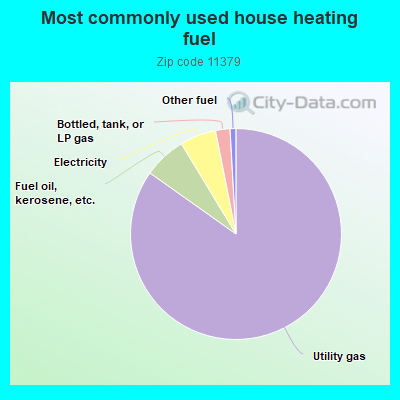
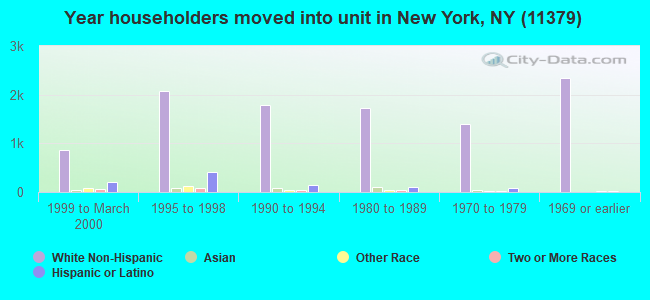
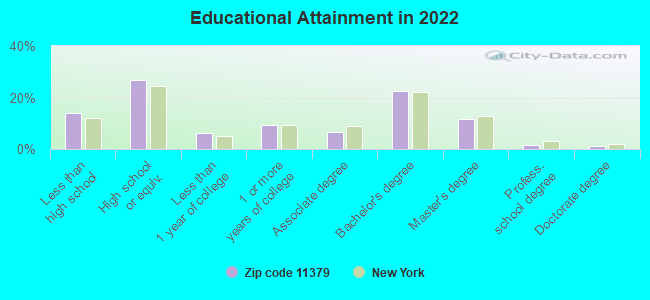
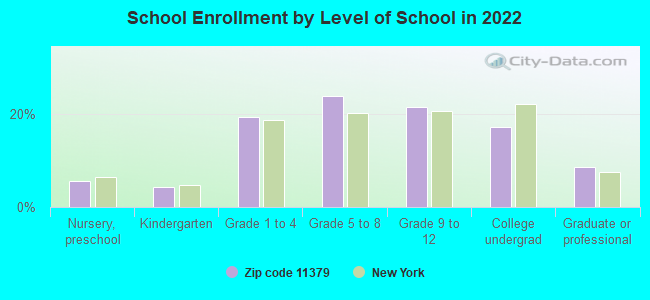
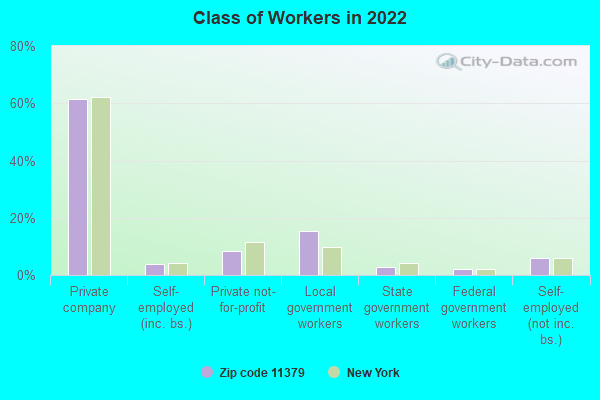
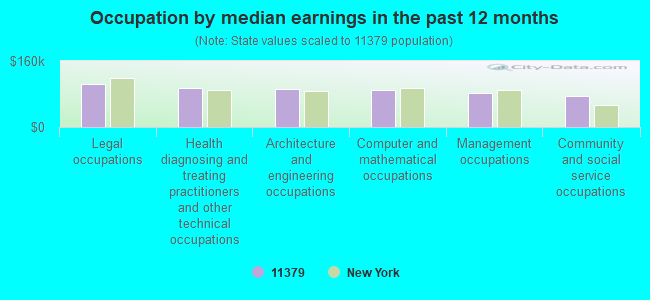
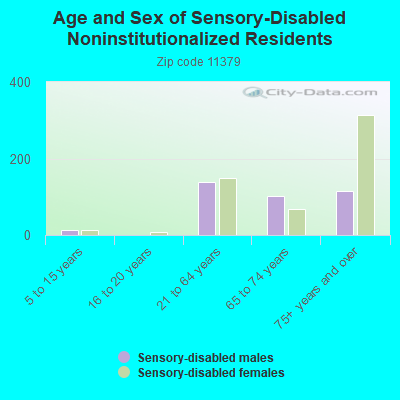
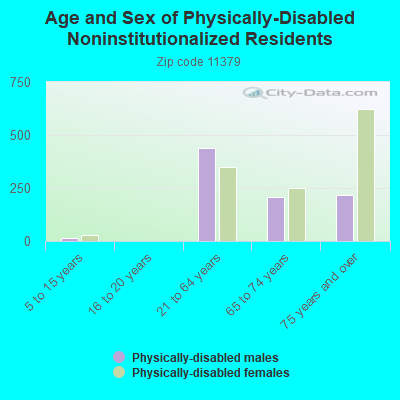
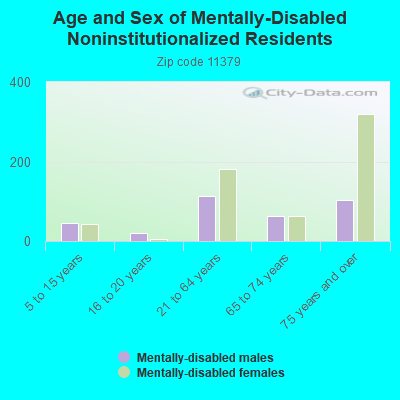
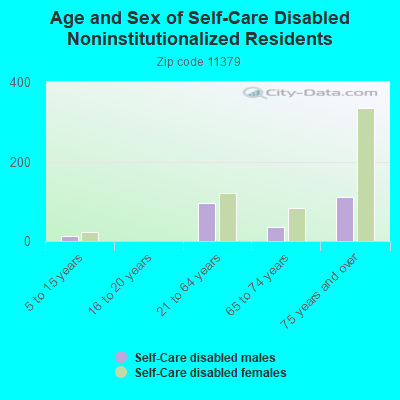
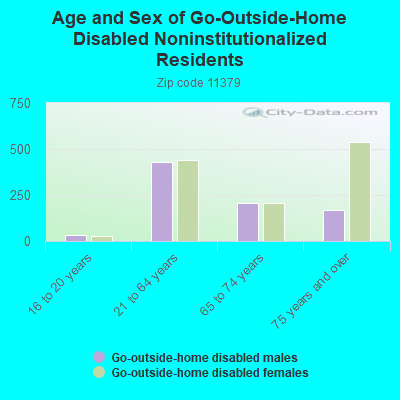
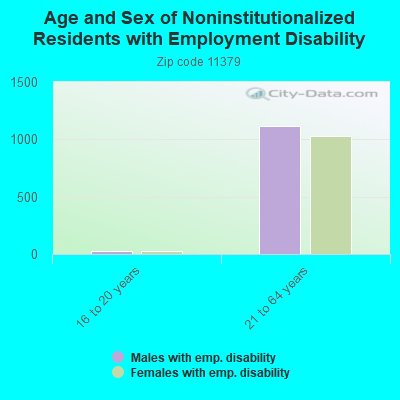
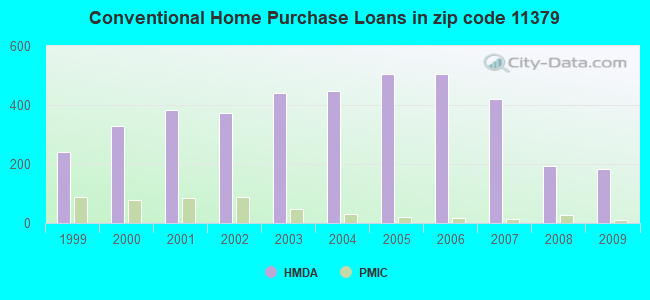
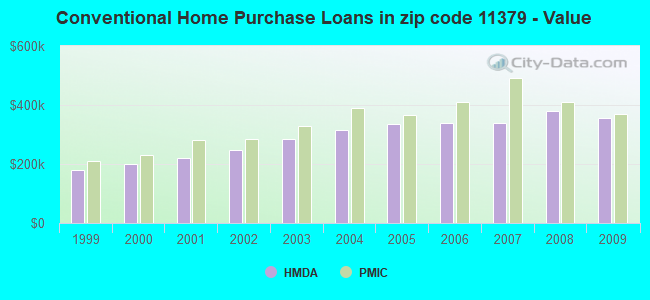
 According to the data from the years 2007 - 2018 the average number of fire incidents per year is 64. The highest number of reported fires - 73 took place in 2009, and the least - 49 in 2007. The data has an increasing trend.
 When looking into fire subcategories, the most reports belonged to: Structure Fires (63.0%), and Outside Fires (23.3%).