Estimated zip code population in 2022: 46,480 Zip code population in 2010: 43,600 Zip code population in 2000: 44,189
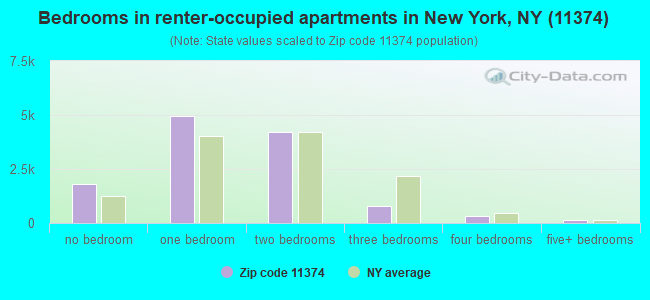
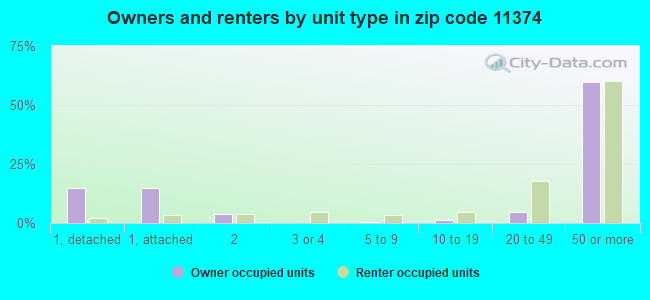
Houses and condos: 21,521 Renter-occupied apartments: 12,158
% of renters here:
60%
State:
46%
March 2022 cost of living index in zip code 11374: 147.0 (very high, U.S. average is 100)
Land area: 0.9 sq. mi. Water area: 0.0 sq. mi.
Population density: 49,541 people per square mile
(very high).
OSM Map
General Map
Google Map
MSN Map
OSM Map
General Map
Google Map
MSN Map
OSM Map
General Map
Google Map
MSN Map
OSM Map
General Map
Google Map
MSN Map
Please wait while loading the map...
Real estate property taxes paid for housing units in 2022:
This zip code:
1.1% ($5,333)
New York:
1.5% ($6,180)
Median real estate property taxes paid for housing units with mortgages in 2022: $5,763 (1.1%) Median real estate property taxes paid for housing units with no mortgage in 2022: $4,881 (1.0%)
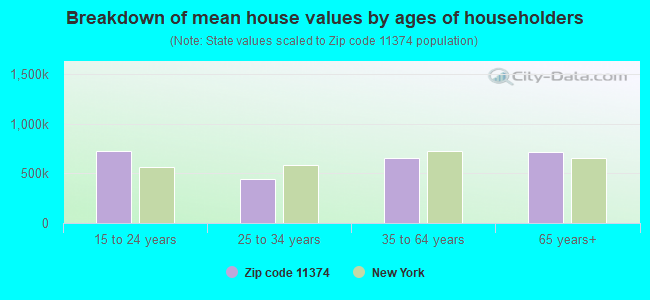
Estimated median house/condo value in 2022: $501,621
11374:
$501,621
New York:
$400,400
According to our research of New York and other state lists, there were 7 registered sex offenders living in 11374 zip code as of April 27, 2024. The ratio of all residents to sex offenders in zip code 11374 is 6,254 to 1. The ratio of registered sex offenders to all residents in this zip code is much lower than the state average.
Median resident age:
This zip code:
42.1 years
New York median age:
40.0 years
Average household size:
This zip code:
2.3 people
New York:
2.5 people
Averages for the 2020 tax year for zip code 11374, filed in 2021:
Average Adjusted Gross Income (AGI) in 2020: $66,407 (Individual Income Tax Returns)
Here:
$66,407
State:
$90,930
Salary/wage: $65,054 (reported on 76.5% of returns)
Here:
$65,054
State:
$72,104
(% of AGI for various income ranges: 925.0% for AGIs below $25k, 3485.1% for AGIs $25k-50k, 7011.4% for AGIs $50k-75k, 10897.9% for AGIs $75k-100k, 20018.3% for AGIs $100k-200k, 73195.0% for AGIs over 200k)
Taxable interest for individuals: $2,163 (reported on 34.5% of returns)
This zip code:
$2,163
New York:
$3,075
(% of AGI for various income ranges: 37.6% for AGIs below $25k, 41.5% for AGIs $25k-50k, 62.1% for AGIs $50k-75k, 109.9% for AGIs $75k-100k, 244.4% for AGIs $100k-200k, 1824.7% for AGIs over 200k)
Ordinary dividends: $4,283 (reported on 20.8% of returns)
Here:
$4,283
State:
$11,095
(% of AGI for various income ranges: 31.8% for AGIs below $25k, 45.4% for AGIs $25k-50k, 83.1% for AGIs $50k-75k, 142.1% for AGIs $75k-100k, 338.7% for AGIs $100k-200k, 2004.4% for AGIs over 200k)
Net capital gain/loss in AGI: +$11,386 (reported on 21.1% of returns)
Here:
+$11,386
State:
+$44,925
(% of AGI for various income ranges: 6.8% for AGIs below $25k, 53.6% for AGIs $25k-50k, 92.9% for AGIs $50k-75k, 205.2% for AGIs $75k-100k, 514.1% for AGIs $100k-200k, 11411.5% for AGIs over 200k)
Profit/loss from business: +$9,780 (reported on 20.9% of returns)
Here:
+$9,780
State:
+$14,940
(% of AGI for various income ranges: 313.4% for AGIs below $25k, 270.7% for AGIs $25k-50k, 187.9% for AGIs $50k-75k, 242.1% for AGIs $75k-100k, 427.8% for AGIs $100k-200k, 2201.2% for AGIs over 200k)
Taxable individual retirement arrangement distribution: $14,289 (reported on 6.3% of returns)
11374:
$14,289
New York:
$19,609
(% of AGI for various income ranges: 64.1% for AGIs below $25k, 72.0% for AGIs $25k-50k, 133.3% for AGIs $50k-75k, 188.9% for AGIs $75k-100k, 312.9% for AGIs $100k-200k, 852.4% for AGIs over 200k)
Self-employed (Keogh) retirement plans: $22,767 (reported on 0.4% of returns)
11374:
$22,767
New York:
$32,497
(% of AGI for various income ranges: 5.6% for AGIs $25k-50k, 28.9% for AGIs $100k-200k, 369.1% for AGIs over 200k)
Total itemized deductions: $29,476 (reported on 8.4% of returns)
Here:
$29,476
State:
$39,326
(% of AGI for various income ranges: 49.2% for AGIs below $25k, 110.3% for AGIs $25k-50k, 250.4% for AGIs $50k-75k, 506.1% for AGIs $75k-100k, 986.5% for AGIs $100k-200k, 5271.2% for AGIs over 200k)
Charity contributions: $7,205 (reported on 6.7% of returns)
Here:
$7,205
State:
$15,420
(% of AGI for various income ranges: 1.9% for AGIs below $25k, 14.1% for AGIs $25k-50k, 41.9% for AGIs $50k-75k, 65.6% for AGIs $75k-100k, 183.6% for AGIs $100k-200k, 1459.4% for AGIs over 200k)
Taxes paid: $8,982 (reported on 8.4% of returns)
11374:
$8,982
State:
$9,183
(% of AGI for various income ranges: 11.8% for AGIs below $25k, 32.8% for AGIs $25k-50k, 87.5% for AGIs $50k-75k, 198.3% for AGIs $75k-100k, 364.6% for AGIs $100k-200k, 977.1% for AGIs over 200k)
Earned income credit: $1,789 (reported on 13.9% of returns)
Here:
$1,789
State:
$2,138
(% of AGI for various income ranges: 78.2% for AGIs below $25k, 66.3% for AGIs $25k-50k, 1.2% for AGIs $50k-75k)
Percentage of individuals using paid preparers for their 2020 taxes: 93.2%
Here:
93%
State:
95%
(% for various income ranges: 90.6% for AGIs below $25k, 94.4% for AGIs $25k-50k, 94.7% for AGIs $50k-75k, 93.7% for AGIs $75k-100k, 95.1% for AGIs $100k-200k, 94.2% for AGIs over 200k)
Averages for the 2012 tax year for zip code 11374, filed in 2013:
Average Adjusted Gross Income (AGI) in 2012: $54,199 (Individual Income Tax Returns)
Here:
$54,199
State:
$77,088
Salary/wage: $54,053 (reported on 78.9% of returns)
Here:
$54,053
State:
$60,593
(% of AGI for various income ranges: 62.2% for AGIs below $25k, 82.5% for AGIs $25k-50k, 85.9% for AGIs $50k-75k, 85.0% for AGIs $75k-100k, 84.1% for AGIs $100k-200k, 58.0% for AGIs over 200k)
Taxable interest for individuals: $1,787 (reported on 42.2% of returns)
This zip code:
$1,787
New York:
$3,125
(% of AGI for various income ranges: 2.1% for AGIs below $25k, 0.9% for AGIs $25k-50k, 0.8% for AGIs $50k-75k, 0.9% for AGIs $75k-100k, 0.8% for AGIs $100k-200k, 3.8% for AGIs over 200k)
Ordinary dividends: $4,246 (reported on 19.3% of returns)
Here:
$4,246
State:
$10,299
(% of AGI for various income ranges: 1.8% for AGIs below $25k, 1.1% for AGIs $25k-50k, 1.2% for AGIs $50k-75k, 1.3% for AGIs $75k-100k, 1.3% for AGIs $100k-200k, 2.7% for AGIs over 200k)
Net capital gain/loss in AGI: +$8,166 (reported on 16.8% of returns)
Here:
+$8,166
State:
+$42,474
(% of AGI for various income ranges: 0.2% for AGIs $75k-100k, 0.9% for AGIs $100k-200k, 15.4% for AGIs over 200k)
Profit/loss from business: +$11,157 (reported on 21.1% of returns)
Here:
+$11,157
State:
+$16,168
(% of AGI for various income ranges: 22.2% for AGIs below $25k, 5.0% for AGIs $25k-50k, 2.2% for AGIs $50k-75k, 2.0% for AGIs $75k-100k, 2.1% for AGIs $100k-200k, 3.5% for AGIs over 200k)
Taxable individual retirement arrangement distribution: $12,641 (reported on 7.8% of returns)
11374:
$12,641
New York:
$17,621
(% of AGI for various income ranges: 3.6% for AGIs below $25k, 2.0% for AGIs $25k-50k, 1.5% for AGIs $50k-75k, 1.3% for AGIs $75k-100k, 1.5% for AGIs $100k-200k, 2.3% for AGIs over 200k)
Self-employment retirement plans: $18,233 (reported on 0.4% of returns)
11374:
$18,233
New York:
$27,330
Total itemized deductions: $21,947 (22% of AGI, reported on 35.6% of returns)
Here:
$21,947
State:
$34,985
Here:
22.4% of AGI
State:
21.3% of AGI
(% of AGI for various income ranges: 7.5% for AGIs below $25k, 10.1% for AGIs $25k-50k, 13.1% for AGIs $50k-75k, 15.3% for AGIs $75k-100k, 17.0% for AGIs $100k-200k, 18.5% for AGIs over 200k)
Charity contributions: $2,575 (reported on 29.0% of returns)
Here:
$2,575
State:
$5,572
(% of AGI for various income ranges: 0.5% for AGIs below $25k, 1.0% for AGIs $25k-50k, 1.5% for AGIs $50k-75k, 1.5% for AGIs $75k-100k, 1.5% for AGIs $100k-200k, 1.7% for AGIs over 200k)
Taxes paid: $10,780 (reported on 35.5% of returns)
11374:
$10,780
State:
$18,656
(% of AGI for various income ranges: 1.8% for AGIs below $25k, 3.3% for AGIs $25k-50k, 5.4% for AGIs $50k-75k, 7.7% for AGIs $75k-100k, 9.5% for AGIs $100k-200k, 10.7% for AGIs over 200k)
Earned income credit: $1,817 (reported on 18.6% of returns)
Here:
$1,817
State:
$2,230
(% of AGI for various income ranges: 6.2% for AGIs below $25k, 0.9% for AGIs $25k-50k)
Percentage of individuals using paid preparers for their 2012 taxes: 67.6%
Here:
68%
State:
66%
(% for various income ranges: 66.9% for AGIs below $25k, 67.8% for AGIs $25k-50k, 67.0% for AGIs $50k-75k, 67.3% for AGIs $75k-100k, 70.5% for AGIs $100k-200k, 72.0% for AGIs over 200k)
Averages for the 2004 tax year for zip code 11374, filed in 2005:
Average Adjusted Gross Income (AGI) in 2004: $43,672 (Individual Income Tax Returns)
Here:
$43,672
State:
$59,519
Salary/wage: $44,218 (reported on 77.9% of returns)
Here:
$44,218
State:
$50,673
(% of AGI for various income ranges: 83.5% for AGIs below $10k, 65.2% for AGIs $10k-25k, 85.8% for AGIs $25k-50k, 84.8% for AGIs $50k-75k, 83.5% for AGIs $75k-100k, 70.4% for AGIs over 100k)
Taxable interest for individuals: $2,418 (reported on 58.4% of returns)
This zip code:
$2,418
New York:
$2,377
(% of AGI for various income ranges: 12.0% for AGIs below $10k, 4.2% for AGIs $10k-25k, 2.0% for AGIs $25k-50k, 1.9% for AGIs $50k-75k, 2.0% for AGIs $75k-100k, 5.2% for AGIs over 100k)
Taxable dividends: $3,120 (reported on 25.9% of returns)
Here:
$3,120
State:
$5,394
(% of AGI for various income ranges: 7.3% for AGIs below $10k, 2.4% for AGIs $10k-25k, 1.3% for AGIs $25k-50k, 1.4% for AGIs $50k-75k, 1.6% for AGIs $75k-100k, 2.3% for AGIs over 100k)
Net capital gain/loss: +$5,502 (reported on 22.1% of returns)
Here:
+$5,502
State:
+$23,581
(% of AGI for various income ranges: -4.5% for AGIs below $10k, -0.3% for AGIs $10k-25k, -0.2% for AGIs $25k-50k, 0.5% for AGIs $50k-75k, 0.8% for AGIs $75k-100k, 9.1% for AGIs over 100k)
Profit/loss from business: +$9,317 (reported on 20.9% of returns)
Here:
+$9,317
State:
+$13,809
(% of AGI for various income ranges: 33.5% for AGIs below $10k, 16.0% for AGIs $10k-25k, 4.0% for AGIs $25k-50k, 2.2% for AGIs $50k-75k, 1.5% for AGIs $75k-100k, 3.3% for AGIs over 100k)
IRA payment deduction: $3,347 (reported on 5.6% of returns)
11374:
$3,347
New York:
$3,115
(% of AGI for various income ranges: 0.7% for AGIs below $10k, 0.6% for AGIs $10k-25k, 0.7% for AGIs $25k-50k, 0.5% for AGIs $50k-75k, 0.4% for AGIs $75k-100k, 0.2% for AGIs over 100k)
Self-employed pension: $10,152 (reported on 0.7% of returns)
Here:
$10,152
New York:
$19,016
(% of AGI for various income ranges: 0.1% for AGIs $10k-25k, 0.1% for AGIs $25k-50k, 0.1% for AGIs $50k-75k, 0.1% for AGIs $75k-100k, 0.3% for AGIs over 100k)
Total itemized deductions: $18,421 (25% of AGI, reported on 38.1% of returns)
Here:
$18,421
State:
$25,864
Here:
24.9% of AGI
State:
21.9% of AGI
(% of AGI for various income ranges: 16.6% for AGIs below $10k, 12.5% for AGIs $10k-25k, 13.9% for AGIs $25k-50k, 16.0% for AGIs $50k-75k, 16.9% for AGIs $75k-100k, 18.4% for AGIs over 100k)
Charity contributions deductions: $3,018 (4% of AGI, reported on 33.9% of returns)
Here:
$3,018
State:
$4,439
Here:
3.9% of AGI
State:
3.6% of AGI
(% of AGI for various income ranges: 0.8% for AGIs below $10k, 1.1% for AGIs $10k-25k, 1.8% for AGIs $25k-50k, 2.1% for AGIs $50k-75k, 2.2% for AGIs $75k-100k, 3.4% for AGIs over 100k)
Total tax: $6,262 (reported on 79.5% of returns)
11374:
$6,262
State:
$11,730
(% of AGI for various income ranges: 7.2% for AGIs below $10k, 5.2% for AGIs $10k-25k, 7.5% for AGIs $25k-50k, 10.6% for AGIs $50k-75k, 12.0% for AGIs $75k-100k, 16.6% for AGIs over 100k)
Earned income credit: $1,458 (reported on 15.2% of returns)
Here:
$1,458
State:
$1,757
Percentage of individuals using paid preparers for their 2004 taxes: 67.6%
Here:
68%
State:
67%
(% for various income ranges: 64.3% for AGIs below $10k, 69.5% for AGIs $10k-25k, 67.2% for AGIs $25k-50k, 68.2% for AGIs $50k-75k, 67.6% for AGIs $75k-100k, 70.1% for AGIs over 100k)
Likely homosexual households (counted as self-reported same-sex unmarried-partner households)
Lesbian couples: 0.1% of all households
Gay men: 0.2% of all households
Household received Food Stamps/SNAP in the past 12 months: 3,417 Household did not receive Food Stamps/SNAP in the past 12 months: 16,839
Women who had a birth in the past 12 months: 696 (576 now married, 115 unmarried) Women who did not have a birth in the past 12 months: 10,272 (4,478 now married, 5,757 unmarried)
Housing units in zip code 11374 with a mortgage: 3,587 (241 second mortgage, 22 home equity loan, 184 both second mortgage and home equity loan) Houses without a mortgage: 163
Median monthly owner costs for units with a mortgage: $1,881 Median monthly owner costs for units without a mortgage: $769
Residents with income below the poverty level in 2022:
This zip code:
12.1%
Whole state:
14.3%
Residents with income below 50% of the poverty level in 2022:
This zip code:
6.7%
Whole state:
6.8%
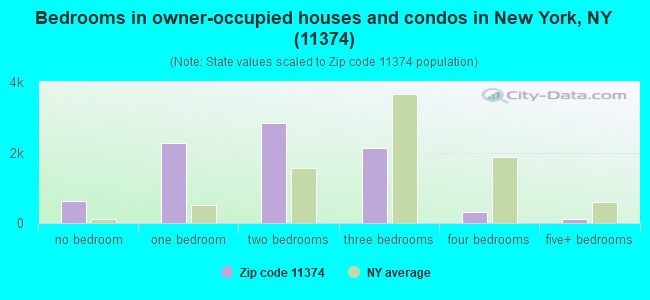
Median number of rooms in houses and condos:
Here:
3.9
State:
6.3
Median number of rooms in apartments:
Here:
3.3
State:
3.8
Notable locations in this zip code not listed on our city pages
Parks in zip code 11374 include: Horace Harding Playground (1), Real Good Park (2), Annadale Playground (3), Plaza Sixtyseven (4), Mount Playground (5), Fleetwood Triangle (6). Display/hide their locations on the map
6,208 married couples with children.
1,330 single-parent households (506 men, 824 women).
27.4% of residents of 11374 zip code speak English at home.
17.2% of residents speak Spanish at home (60% very well, 23% well, 14% not well, 3% not at all).
29.5% of residents speak other Indo-European language at home (59% very well, 21% well, 16% not well, 4% not at all).
22.3% of residents speak Asian or Pacific Island language at home (48% very well, 29% well, 18% not well, 5% not at all).
3.9% of residents speak other language at home (72% very well, 26% well, 1% not well).
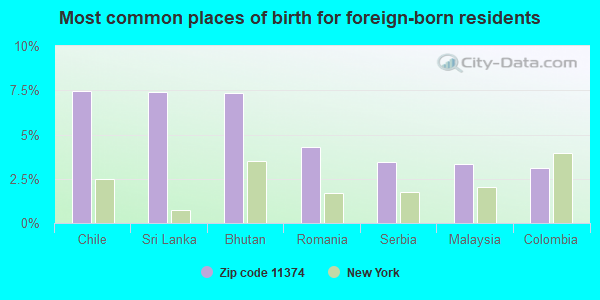
Foreign born population: 25,811 (55.5%) (63.8% of them are naturalized citizens)
This zip code:
55.5%
Whole state:
22.7%
7%Chile
7%Sri Lanka
7%Bhutan
4%Romania
3%Serbia
3%Malaysia
3%Colombia
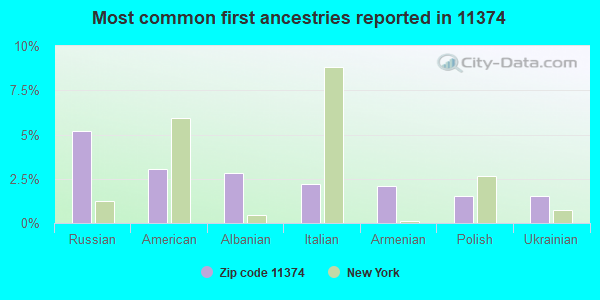
5%Russian
3%American
3%Albanian
2%Italian
2%Armenian
2%Polish
2%Ukrainian
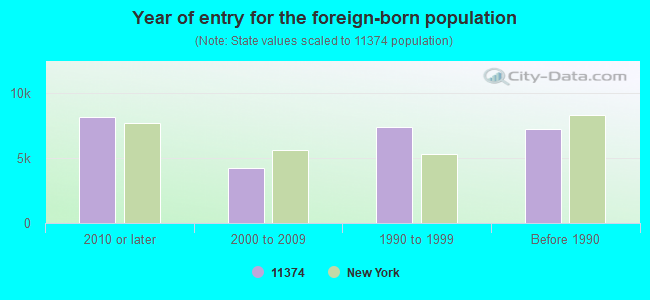
Year of entry for the foreign-born population
8,1162010 or later
4,2062000 to 2009
7,3431990 to 1999
7,227Before 1990
Major facilities with environmental interests located in this zip code:
ALVA FRENCH CLEANERS (97-16 63RD ROAD in REGO PARK, NY)
AIR MINOR (AIRS/AFS) STATE MASTER (New York facility tracking) - AIR PROGRAM, HAZARDOUS WASTE PROGRAM (Resource Conservation and Recovery Act (tracking hazardous waste)) Business SIC classification: DRYCLEANING PLANTS, EXCEPT RUG CLEANING Business NAICS classification: DRYCLEANING AND LAUNDRY SERVICES (EXCEPT COIN-OPERATED). Organizations: SHERWIN ENTERPRISES INC (LEGALLY RESPONSIBLE PARTY)
, SUNG H ENTERPRISES INC (LEGALLY RESPONSIBLE PARTY)
HOSPITAL MEDICAL CENTER QUEENS AIDS CENTER (97-45 QUEENS BOULEVARD in FLUSHING, NY)
(Integrated Compliance Information System) - ICIS-02-2005-0807, ENFORCEMENT/COMPLIANCE ACTIVITY FORMAL ENFORCEMENT ACTION (Integrated Compliance Information System) - ICIS-02-2005-0807, ENFORCEMENT/COMPLIANCE ACTIVITY
HAMPTON HOUSE (93-10 QUEENS BLVD in QUEENS, NY)
AIR MINOR (AIRS/AFS) STATE MASTER (New York facility tracking) - AIR PROGRAM Business SIC classification: OPERATORS OF APARTMENT BUILDINGS; TOP, BODY, AND UPHOLSTERY REPAIR SHOPS AND PAINT SHOPS Organizations: HAMPTON HOUSE LLC (AIR PERMITTING FACILITY OWNER CONTACT)
83-19 141ST ST BUILDING (83-19 141ST ST in REGO PARK, NY)
AIR MINOR (AIRS/AFS) STATE MASTER (New York facility tracking) - AIR PROGRAM, AIR FACILITY REGISTRATION Business SIC classification: OPERATORS OF APARTMENT BUILDINGS Organizations: KALED MANAGEMENT CORP
62-60 99TH STREET APARTMENTS (62-60 99TH STREET in FLUSHING, NY)
AIR SYNTHETIC MINOR (AIRS/AFS) STATE MASTER (New York facility tracking) - AIR PROGRAM Business SIC classification: OPERATORS OF APARTMENT BUILDINGS Business NAICS classification: LESSORS OF RESIDENTIAL BUILDINGS AND DWELLINGS. Organizations: KELMAR HOLDING CO (LEGALLY RESPONSIBLE PARTY)
Alternative names: 62-60 99 STREET
98-30 67 AVE LLC (98-30 67TH AVE in REGO PARK, NY)
AIR SYNTHETIC MINOR (AIRS/AFS) STATE MASTER (New York facility tracking) - AIR PROGRAM Business SIC classification: OPERATORS OF APARTMENT BUILDINGS Business NAICS classification: LESSORS OF RESIDENTIAL BUILDINGS AND DWELLINGS. Organizations: NATHAN KATZ REALTY LLC (LEGALLY RESPONSIBLE PARTY)
Alternative names: MAYFAIR APARTMENTS
CON ED - MH 693 (N/W/C 110 ST & 66 RD in REGO PARK, NY)
HAZARDOUS WASTE BIENNIAL REPORTER (Resource Conservation and Recovery Act (tracking hazardous waste)) (Resource Conservation and Recovery Act (tracking hazardous waste)) Alternative names: CON ED - M/H 693
ANITA TERRACE OWNERS (99-05 63RD DRIVE in REGO PARK, NY)
(Integrated Compliance Information System) - ICIS-02-2004-1007, FORMAL ENFORCEMENT ACTION
ANDRE FRENCH CLEANERS (97-07 64TH AVE in REGO PARK, NY)
AIR MINOR (AIRS/AFS) (Resource Conservation and Recovery Act (tracking hazardous waste)) Business SIC classification: DRYCLEANING PLANTS, EXCEPT RUG CLEANING Alternative names: ANDRE DRY CLEANERS
GETTY PETROLEUM CORPORATION (75-41 YELLOWSTONE BOULEVARD in REGO PARK, NY)
AIR MINOR (AIRS/AFS) Small Quantity Generators, between 100 kg and 1000 kg of hazardous waste/month (Resource Conservation and Recovery Act (tracking hazardous waste)) - notification Business SIC classification: GASOLINE SERVICE STATIONS Alternative names: GETTY-75/41 YELLOWSTONE BLVD
CON EDISON - VS VS-5030 (62 DRIVE N & E. 108TH ST. in REGO PARK, NY)
Large Quantity Generators, more that 1000 kg of hazardous waste/month (Resource Conservation and Recovery Act (tracking hazardous waste)) Organizations: CONSOLIDATED EDISON COMPANY OF NY, INC. (CONTACT/OPERATOR)
CON ED - V 5893 (S/S 71 RD 191' W/O 112 ST in REGO PARK, NY)
HAZARDOUS WASTE BIENNIAL REPORTER (Resource Conservation and Recovery Act (tracking hazardous waste)) (Resource Conservation and Recovery Act (tracking hazardous waste))
CON ED - V 7615 (W/S 99TH ST 550 N/O H H EXPWY in REGO PARK, NY)
HAZARDOUS WASTE BIENNIAL REPORTER (Resource Conservation and Recovery Act (tracking hazardous waste)) (Resource Conservation and Recovery Act (tracking hazardous waste))
Housing units lacking complete plumbing facilities: 0.1% Housing units lacking complete kitchen facilities: 0.4%
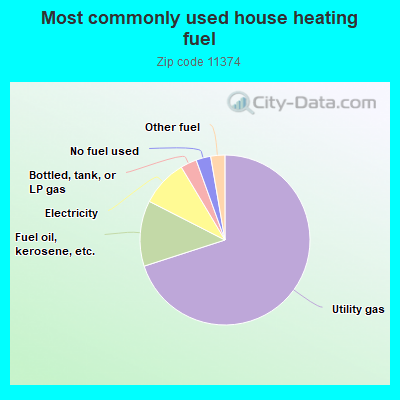
70.1%Utility gas
12.5%Fuel oil, kerosene, etc.
8.9%Electricity
3.1%Bottled, tank, or LP gas
2.8%No fuel used
2.7%Other fuel
Population in 1990: 40,024. Population change in the 1990s: +4,165 (+10.4%).
Place of birth for U.S.-born residents:
This state: 17,327
Northeast: 678
Midwest: 434
South: 826
West: 468
68% of the 11374 zip code residents lived in the same house 5 years ago. Out of people who lived in different houses, 69% lived in this county. Out of people who lived in different counties, 50% lived in New York.
90% of the 11374 zip code residents lived in the same house 1 year ago. Out of people who lived in different houses, 60% moved from this county. Out of people who lived in different houses, 18% moved from different county within same state. Out of people who lived in different houses, 15% moved from different state. Out of people who lived in different houses, 6% moved from abroad.
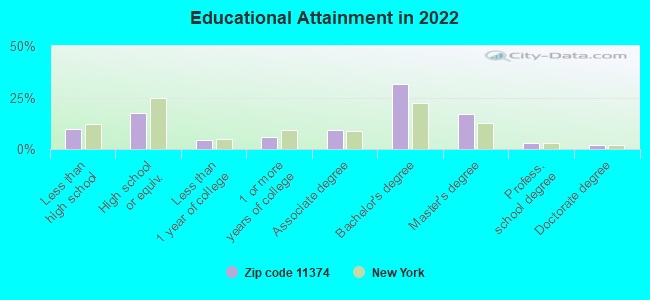
Private vs. public school enrollment:
Students in private schools in grades 1 to 8 (elementary and middle school): 374
Here:
11.6%
New York:
15.6%
Students in private schools in grades 9 to 12 (high school): 97
Here:
5.0%
New York:
15.0%
Students in private undergraduate colleges: 505
Here:
27.4%
New York:
39.2%
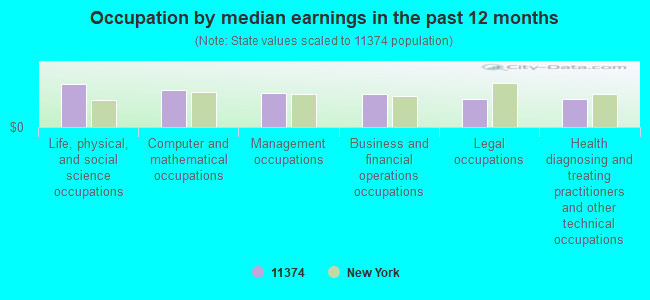
Occupation by median earnings in the past 12 months ($)
128,515Life, physical, and social science occupations
111,648Computer and mathematical occupations
101,118Management occupations
99,838Business and financial operations occupations
85,565Legal occupations
85,364Health diagnosing and treating practitioners and other technical occupations
Companies with federal contracts located in this zip code:
GLOBAL AIR INC (9951 62ND RD in REGO PARK, NY; small business) : $260,835 in 25 contractsfrom 2001 to 2006
Contracts for Miscellaneous Items, Electrical and Electronic assemblies, Boards, Cards, and Associated Hardware, Passenger Motor Vehicles, Miscellaneous Aircraft Accessories and Components, and moreby Army Signed by year:2000: $0; 2001: $29,825; 2002: $0; 2003: $21,300; 2004: $122,870; 2005: $61,850; 2006: $24,990.
Biggest contracts:
$29,825 with Army for Miscellaneous Items. Signed on 2001-02-12. Completion date: 2001-06-30.
$25,632 with Army for Electrical and Electronic assemblies, Boards, Cards, and Associated Hardware. Signed on 2004-12-29. Completion date: 2005-05-03.
$25,632, same as above.Signed on 2004-12-29. Completion date: 2005-05-03.
$24,990 with Army for Passenger Motor Vehicles. Signed on 2006-04-10. Completion date: 2006-05-30.
P.E.P RESEARCH INC. (98-01 67TH AVE in REGO PARK, NY; small business)
$89,000 with Army for Other Management Support Services. Signed on 2000-04-13. Completion date: 2001-09-30.
cyrus irani, md (64-11 99th in REGO PARK, NY; small business)
$1,450 with Bureau of Prisoners/Federal Prison System for Health Services -- Basic Research (R&D). Signed on 2005-04-05. Completion date: 2005-06-30.
Top industries in this zip code by the number of employees in 2005:
2007 - 2018 National Fire Incident Reporting System (NFIRS) incidents
According to the data from the years 2007 - 2018 the average number of fire incidents per year is 110. The highest number of reported fires - 143 took place in 2016, and the least - 86 in 2018. The data has a decreasing trend.
When looking into fire subcategories, the most reports belonged to: Structure Fires (70.7%), and Outside Fires (21.5%).
Fire incident types reported to NFIRS in Zip Code 11374

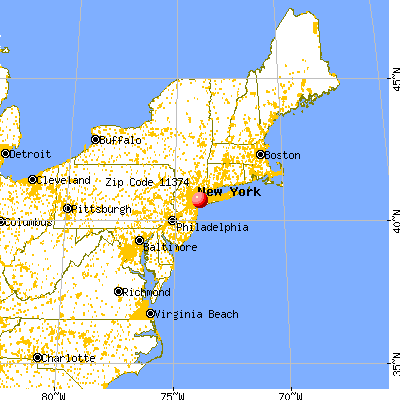


 Nearest zip codes: 11375, 11379, 11373, 11368, 11421, 11372.


 According to the data from the years 2007 - 2018 the average number of fire incidents per year is 110. The highest number of reported fires - 143 took place in 2016, and the least - 86 in 2018. The data has a decreasing trend.
 When looking into fire subcategories, the most reports belonged to: Structure Fires (70.7%), and Outside Fires (21.5%).