Estimated zip code population in 2022: 74,018 Zip code population in 2010: 68,733 Zip code population in 2000: 70,204
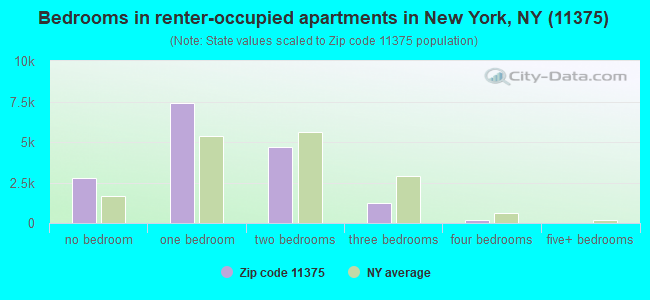
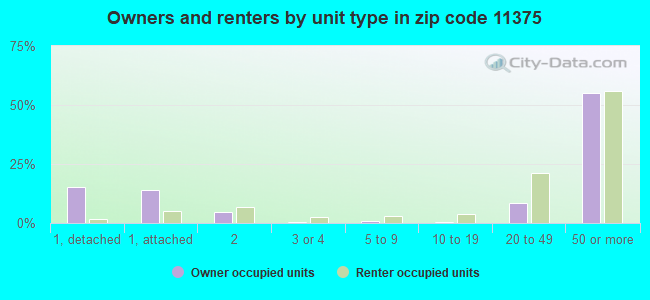
Houses and condos: 35,605 Renter-occupied apartments: 16,133
% of renters here:
47%
State:
46%
March 2022 cost of living index in zip code 11375: 146.9 (very high, U.S. average is 100)
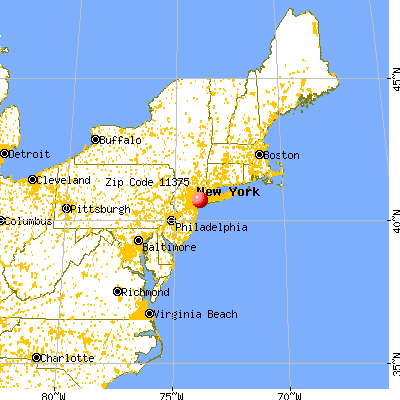
Land area: 2.0 sq. mi. Water area: 0.0 sq. mi.
Population density: 37,380 people per square mile
(very high).
OSM Map
General Map
Google Map
MSN Map
OSM Map
General Map
Google Map
MSN Map
OSM Map
General Map
Google Map
MSN Map
OSM Map
General Map
Google Map
MSN Map
Please wait while loading the map...
Real estate property taxes paid for housing units in 2022:
This zip code:
0.9% ($5,497)
New York:
1.5% ($6,180)
Median real estate property taxes paid for housing units with mortgages in 2022: $5,360 (0.9%) Median real estate property taxes paid for housing units with no mortgage in 2022: $5,680 (1.0%)
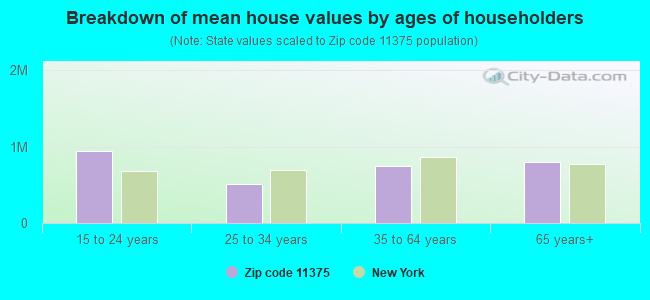
Estimated median house/condo value in 2022: $583,139
11375:
$583,139
New York:
$400,400
According to our research of New York and other state lists, there were 6 registered sex offenders living in 11375 zip code as of April 27, 2024. The ratio of all residents to sex offenders in zip code 11375 is 12,030 to 1. The ratio of registered sex offenders to all residents in this zip code is much lower than the state average.
Median resident age:
This zip code:
45.5 years
New York median age:
40.0 years
Average household size:
This zip code:
2.2 people
New York:
2.5 people
Averages for the 2020 tax year for zip code 11375, filed in 2021:
Average Adjusted Gross Income (AGI) in 2020: $102,730 (Individual Income Tax Returns)
Here:
$102,730
State:
$90,930
Salary/wage: $96,930 (reported on 76.4% of returns)
Here:
$96,930
State:
$72,104
(% of AGI for various income ranges: 935.9% for AGIs below $25k, 3371.3% for AGIs $25k-50k, 6914.6% for AGIs $50k-75k, 10500.9% for AGIs $75k-100k, 20135.0% for AGIs $100k-200k, 99529.9% for AGIs over 200k)
Taxable interest for individuals: $2,604 (reported on 47.8% of returns)
This zip code:
$2,604
New York:
$3,075
(% of AGI for various income ranges: 63.3% for AGIs below $25k, 78.6% for AGIs $25k-50k, 104.0% for AGIs $50k-75k, 174.7% for AGIs $75k-100k, 273.2% for AGIs $100k-200k, 1673.8% for AGIs over 200k)
Ordinary dividends: $6,915 (reported on 34.3% of returns)
Here:
$6,915
State:
$11,095
(% of AGI for various income ranges: 66.5% for AGIs below $25k, 111.3% for AGIs $25k-50k, 175.1% for AGIs $50k-75k, 260.6% for AGIs $75k-100k, 543.3% for AGIs $100k-200k, 3710.1% for AGIs over 200k)
Net capital gain/loss in AGI: +$15,037 (reported on 32.6% of returns)
Here:
+$15,037
State:
+$44,925
(% of AGI for various income ranges: 22.6% for AGIs below $25k, 75.9% for AGIs $25k-50k, 167.3% for AGIs $50k-75k, 219.8% for AGIs $75k-100k, 763.8% for AGIs $100k-200k, 11344.2% for AGIs over 200k)
Profit/loss from business: +$16,410 (reported on 19.2% of returns)
Here:
+$16,410
State:
+$14,940
(% of AGI for various income ranges: 279.3% for AGIs below $25k, 291.1% for AGIs $25k-50k, 289.3% for AGIs $50k-75k, 287.2% for AGIs $75k-100k, 570.9% for AGIs $100k-200k, 4108.5% for AGIs over 200k)
Taxable individual retirement arrangement distribution: $18,068 (reported on 9.2% of returns)
11375:
$18,068
New York:
$19,609
(% of AGI for various income ranges: 102.9% for AGIs below $25k, 142.5% for AGIs $25k-50k, 194.6% for AGIs $50k-75k, 293.3% for AGIs $75k-100k, 480.2% for AGIs $100k-200k, 1308.1% for AGIs over 200k)
Self-employed (Keogh) retirement plans: $28,307 (reported on 1.2% of returns)
11375:
$28,307
New York:
$32,497
(% of AGI for various income ranges: 4.6% for AGIs below $25k, 15.1% for AGIs $50k-75k, 15.0% for AGIs $75k-100k, 40.8% for AGIs $100k-200k, 786.2% for AGIs over 200k)
Total itemized deductions: $29,002 (reported on 15.7% of returns)
Here:
$29,002
State:
$39,326
(% of AGI for various income ranges: 116.6% for AGIs below $25k, 202.5% for AGIs $25k-50k, 394.8% for AGIs $50k-75k, 700.4% for AGIs $75k-100k, 1287.5% for AGIs $100k-200k, 5708.0% for AGIs over 200k)
Charity contributions: $6,867 (reported on 13.2% of returns)
Here:
$6,867
State:
$15,420
(% of AGI for various income ranges: 6.0% for AGIs below $25k, 19.7% for AGIs $25k-50k, 47.9% for AGIs $50k-75k, 93.4% for AGIs $75k-100k, 208.0% for AGIs $100k-200k, 1655.8% for AGIs over 200k)
Taxes paid: $9,121 (reported on 15.7% of returns)
11375:
$9,121
State:
$9,183
(% of AGI for various income ranges: 25.5% for AGIs below $25k, 55.4% for AGIs $25k-50k, 137.5% for AGIs $50k-75k, 285.2% for AGIs $75k-100k, 478.5% for AGIs $100k-200k, 1394.0% for AGIs over 200k)
Earned income credit: $1,604 (reported on 8.8% of returns)
Here:
$1,604
State:
$2,138
(% of AGI for various income ranges: 62.3% for AGIs below $25k, 52.0% for AGIs $25k-50k, 0.6% for AGIs $50k-75k)
Percentage of individuals using paid preparers for their 2020 taxes: 93.4%
Here:
93%
State:
95%
(% for various income ranges: 91.0% for AGIs below $25k, 93.6% for AGIs $25k-50k, 93.8% for AGIs $50k-75k, 93.3% for AGIs $75k-100k, 94.3% for AGIs $100k-200k, 95.9% for AGIs over 200k)
Averages for the 2012 tax year for zip code 11375, filed in 2013:
Average Adjusted Gross Income (AGI) in 2012: $82,173 (Individual Income Tax Returns)
Here:
$82,173
State:
$77,088
Salary/wage: $76,927 (reported on 77.9% of returns)
Here:
$76,927
State:
$60,593
(% of AGI for various income ranges: 58.6% for AGIs below $25k, 76.0% for AGIs $25k-50k, 80.5% for AGIs $50k-75k, 79.5% for AGIs $75k-100k, 79.5% for AGIs $100k-200k, 62.1% for AGIs over 200k)
Taxable interest for individuals: $2,034 (reported on 54.7% of returns)
This zip code:
$2,034
New York:
$3,125
(% of AGI for various income ranges: 3.3% for AGIs below $25k, 1.5% for AGIs $25k-50k, 1.2% for AGIs $50k-75k, 1.1% for AGIs $75k-100k, 1.1% for AGIs $100k-200k, 1.5% for AGIs over 200k)
Ordinary dividends: $5,970 (reported on 32.6% of returns)
Here:
$5,970
State:
$10,299
(% of AGI for various income ranges: 4.3% for AGIs below $25k, 2.1% for AGIs $25k-50k, 2.0% for AGIs $50k-75k, 1.8% for AGIs $75k-100k, 2.1% for AGIs $100k-200k, 2.8% for AGIs over 200k)
Net capital gain/loss in AGI: +$10,701 (reported on 28.1% of returns)
Here:
+$10,701
State:
+$42,474
(% of AGI for various income ranges: 0.2% for AGIs $50k-75k, 0.4% for AGIs $75k-100k, 0.9% for AGIs $100k-200k, 10.4% for AGIs over 200k)
Profit/loss from business: +$16,589 (reported on 19.7% of returns)
Here:
+$16,589
State:
+$16,168
(% of AGI for various income ranges: 19.5% for AGIs below $25k, 6.4% for AGIs $25k-50k, 3.0% for AGIs $50k-75k, 2.7% for AGIs $75k-100k, 2.9% for AGIs $100k-200k, 3.3% for AGIs over 200k)
Taxable individual retirement arrangement distribution: $17,089 (reported on 11.8% of returns)
11375:
$17,089
New York:
$17,621
(% of AGI for various income ranges: 5.5% for AGIs below $25k, 3.0% for AGIs $25k-50k, 2.2% for AGIs $50k-75k, 2.2% for AGIs $75k-100k, 2.2% for AGIs $100k-200k, 2.4% for AGIs over 200k)
Self-employment retirement plans: $23,775 (reported on 1.4% of returns)
11375:
$23,775
New York:
$27,330
(% of AGI for various income ranges: 0.2% for AGIs below $25k, 0.1% for AGIs $25k-50k, 0.2% for AGIs $50k-75k, 0.2% for AGIs $75k-100k, 0.3% for AGIs $100k-200k, 0.8% for AGIs over 200k)
Total itemized deductions: $26,533 (20% of AGI, reported on 49.9% of returns)
Here:
$26,533
State:
$34,985
Here:
20.4% of AGI
State:
21.3% of AGI
(% of AGI for various income ranges: 14.7% for AGIs below $25k, 12.8% for AGIs $25k-50k, 14.8% for AGIs $50k-75k, 16.7% for AGIs $75k-100k, 17.2% for AGIs $100k-200k, 16.4% for AGIs over 200k)
Charity contributions: $2,944 (reported on 41.4% of returns)
Here:
$2,944
State:
$5,572
(% of AGI for various income ranges: 0.8% for AGIs below $25k, 1.2% for AGIs $25k-50k, 1.5% for AGIs $50k-75k, 1.6% for AGIs $75k-100k, 1.5% for AGIs $100k-200k, 1.5% for AGIs over 200k)
Taxes paid: $14,888 (reported on 49.6% of returns)
11375:
$14,888
State:
$18,656
(% of AGI for various income ranges: 3.9% for AGIs below $25k, 4.3% for AGIs $25k-50k, 6.4% for AGIs $50k-75k, 8.3% for AGIs $75k-100k, 9.7% for AGIs $100k-200k, 11.5% for AGIs over 200k)
Earned income credit: $1,799 (reported on 10.9% of returns)
Here:
$1,799
State:
$2,230
(% of AGI for various income ranges: 4.8% for AGIs below $25k, 0.6% for AGIs $25k-50k)
Percentage of individuals using paid preparers for their 2012 taxes: 68.1%
Here:
68%
State:
66%
(% for various income ranges: 67.1% for AGIs below $25k, 67.8% for AGIs $25k-50k, 66.3% for AGIs $50k-75k, 69.2% for AGIs $75k-100k, 68.7% for AGIs $100k-200k, 73.8% for AGIs over 200k)
Averages for the 2004 tax year for zip code 11375, filed in 2005:
Average Adjusted Gross Income (AGI) in 2004: $63,239 (Individual Income Tax Returns)
Here:
$63,239
State:
$59,519
Salary/wage: $60,352 (reported on 76.5% of returns)
Here:
$60,352
State:
$50,673
(% of AGI for various income ranges: 150.7% for AGIs below $10k, 60.2% for AGIs $10k-25k, 80.8% for AGIs $25k-50k, 81.7% for AGIs $50k-75k, 80.5% for AGIs $75k-100k, 66.3% for AGIs over 100k)
Taxable interest for individuals: $2,689 (reported on 68.5% of returns)
This zip code:
$2,689
New York:
$2,377
(% of AGI for various income ranges: 30.1% for AGIs below $10k, 6.7% for AGIs $10k-25k, 2.9% for AGIs $25k-50k, 2.2% for AGIs $50k-75k, 2.3% for AGIs $75k-100k, 2.7% for AGIs over 100k)
Taxable dividends: $4,128 (reported on 38.1% of returns)
Here:
$4,128
State:
$5,394
(% of AGI for various income ranges: 20.2% for AGIs below $10k, 4.7% for AGIs $10k-25k, 2.1% for AGIs $25k-50k, 1.8% for AGIs $50k-75k, 1.9% for AGIs $75k-100k, 2.6% for AGIs over 100k)
Net capital gain/loss: +$8,308 (reported on 33.2% of returns)
Here:
+$8,308
State:
+$23,581
(% of AGI for various income ranges: -11.7% for AGIs below $10k, -0.4% for AGIs $10k-25k, -0.1% for AGIs $25k-50k, 0.4% for AGIs $50k-75k, 0.8% for AGIs $75k-100k, 8.5% for AGIs over 100k)
Profit/loss from business: +$14,115 (reported on 19.0% of returns)
Here:
+$14,115
State:
+$13,809
(% of AGI for various income ranges: 49.8% for AGIs below $10k, 13.4% for AGIs $10k-25k, 4.1% for AGIs $25k-50k, 2.8% for AGIs $50k-75k, 2.8% for AGIs $75k-100k, 3.9% for AGIs over 100k)
IRA payment deduction: $3,381 (reported on 5.7% of returns)
11375:
$3,381
New York:
$3,115
(% of AGI for various income ranges: 1.0% for AGIs below $10k, 0.7% for AGIs $10k-25k, 0.7% for AGIs $25k-50k, 0.4% for AGIs $50k-75k, 0.3% for AGIs $75k-100k, 0.1% for AGIs over 100k)
Self-employed pension: $16,046 (reported on 1.7% of returns)
Here:
$16,046
New York:
$19,016
(% of AGI for various income ranges: 0.2% for AGIs $10k-25k, 0.2% for AGIs $25k-50k, 0.2% for AGIs $50k-75k, 0.3% for AGIs $75k-100k, 0.6% for AGIs over 100k)
Total itemized deductions: $21,802 (22% of AGI, reported on 49.7% of returns)
Here:
$21,802
State:
$25,864
Here:
21.7% of AGI
State:
21.9% of AGI
(% of AGI for various income ranges: 41.6% for AGIs below $10k, 15.1% for AGIs $10k-25k, 15.4% for AGIs $25k-50k, 17.5% for AGIs $50k-75k, 17.9% for AGIs $75k-100k, 17.2% for AGIs over 100k)
Charity contributions deductions: $3,014 (3% of AGI, reported on 45.2% of returns)
Here:
$3,014
State:
$4,439
Here:
2.9% of AGI
State:
3.6% of AGI
(% of AGI for various income ranges: 2.1% for AGIs below $10k, 1.4% for AGIs $10k-25k, 1.9% for AGIs $25k-50k, 2.2% for AGIs $50k-75k, 2.2% for AGIs $75k-100k, 2.2% for AGIs over 100k)
Total tax: $11,202 (reported on 83.5% of returns)
11375:
$11,202
State:
$11,730
(% of AGI for various income ranges: 11.9% for AGIs below $10k, 5.1% for AGIs $10k-25k, 8.1% for AGIs $25k-50k, 11.2% for AGIs $50k-75k, 12.8% for AGIs $75k-100k, 19.3% for AGIs over 100k)
Earned income credit: $1,358 (reported on 8.8% of returns)
Here:
$1,358
State:
$1,757
Percentage of individuals using paid preparers for their 2004 taxes: 67.8%
Here:
68%
State:
67%
(% for various income ranges: 64.7% for AGIs below $10k, 68.6% for AGIs $10k-25k, 66.8% for AGIs $25k-50k, 68.1% for AGIs $50k-75k, 67.6% for AGIs $75k-100k, 71.7% for AGIs over 100k)
Likely homosexual households (counted as self-reported same-sex unmarried-partner households)
Lesbian couples: 0.1% of all households
Gay men: 0.2% of all households
Household received Food Stamps/SNAP in the past 12 months: 2,482 Household did not receive Food Stamps/SNAP in the past 12 months: 31,215
Women who had a birth in the past 12 months: 743 (654 now married, 81 unmarried) Women who did not have a birth in the past 12 months: 14,933 (7,594 now married, 7,234 unmarried)
Housing units in zip code 11375 with a mortgage: 8,512 (499 second mortgage, 44 home equity loan, 403 both second mortgage and home equity loan) Houses without a mortgage: 57
Median monthly owner costs for units with a mortgage: $2,236 Median monthly owner costs for units without a mortgage: $971
Residents with income below the poverty level in 2022:
This zip code:
7.2%
Whole state:
14.3%
Residents with income below 50% of the poverty level in 2022:
This zip code:
2.8%
Whole state:
6.8%
Median number of rooms in houses and condos:
Here:
4.2
State:
6.3
Median number of rooms in apartments:
Here:
3.4
State:
3.8
Notable locations in this zip code not listed on our city pages
Notable locations in zip code 11375: Forest Hills Stadium (A), Forest Hills Station (B), Forest Hills Tower (C), Forest Hills Branch Queens Borough Public Library (D), Fire Department New York Engine 305 Ladder 151 (E), New York Ladder Company 151 (F). Display/hide their locations on the map
Churches in zip code 11375 include: Dov Revel Synagogue (A), Saint Luke's Episcopal Church (B), Reform Temple of Forest Hills (C), Our Lady Queen of Martyrs Church (D), Forest Hills Jewish Center (E), First Presbyterian Church (F), Congregation Ahavath Sholom (G), Iglesia Ni Christo (H), Havurat Yisrael Synagogue (I). Display/hide their locations on the map
Parks in zip code 11375 include: Playground Sixty-Two (1), Federoff Triangle (2), Arthur Katzman Playground (3), Yellowstone Municipal Park (4), MacDonald Park (5), Russell Sage Playground (6), Pebblestone Triangle (7), Willow Lake Playground (8), Ehrenreich-Austin Playground (9). Display/hide their locations on the map
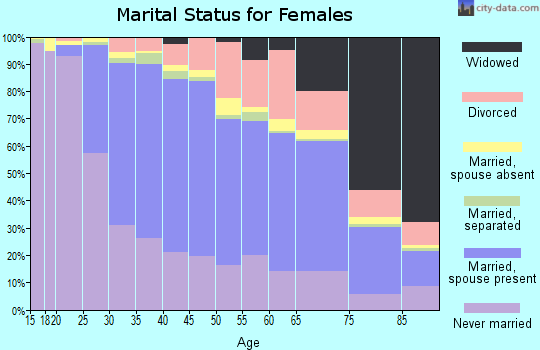
10,523 married couples with children.
1,730 single-parent households (456 men, 1,274 women).
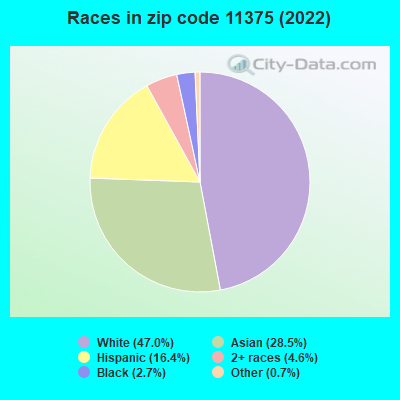
46.2% of residents of 11375 zip code speak English at home.
12.8% of residents speak Spanish at home (71% very well, 19% well, 9% not well, 1% not at all).
19.4% of residents speak other Indo-European language at home (62% very well, 23% well, 11% not well, 5% not at all).
19.2% of residents speak Asian or Pacific Island language at home (53% very well, 28% well, 13% not well, 7% not at all).
2.8% of residents speak other language at home (74% very well, 17% well, 3% not well, 6% not at all).
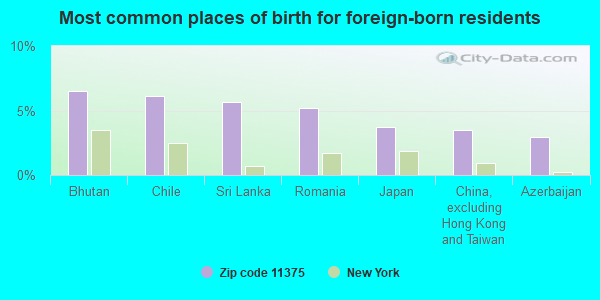
Foreign born population: 31,988 (43.2%) (69.9% of them are naturalized citizens)
This zip code:
43.2%
Whole state:
22.7%
7%Bhutan
6%Chile
6%Sri Lanka
5%Romania
4%Japan
4%China, excluding Hong Kong and Taiwan
3%Azerbaijan
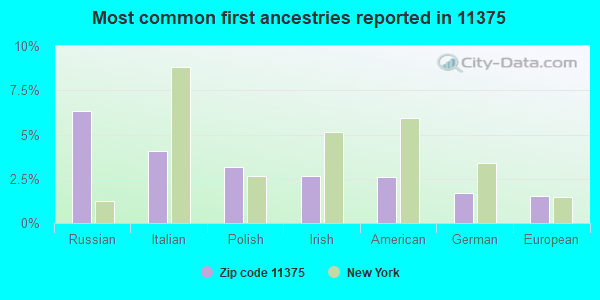
6%Russian
4%Italian
3%Polish
3%Irish
3%American
2%German
2%European
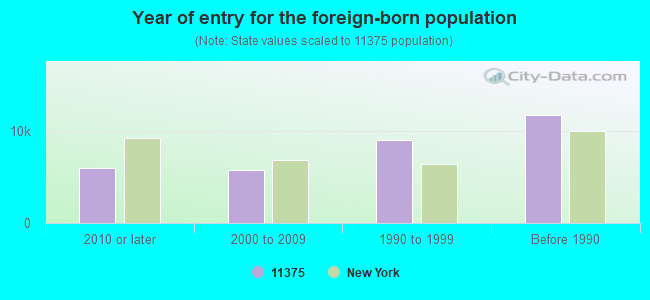
Year of entry for the foreign-born population
5,9452010 or later
5,7862000 to 2009
9,0141990 to 1999
11,733Before 1990
Private elementary/middle school in in this zip code not listed on the city page:
Major facilities with environmental interests located in this zip code:
ABAX INC - PUBLIC SCHOOL 196 QUEENS (71-25 113TH ST in FOREST HILLS, NY)
STATE MASTER (New York facility tracking) - AIR PROGRAM (Integrated Compliance Information System) - ICIS-02-1994-0052, FORMAL ENFORCEMENT ACTION Small Quantity Generators, between 100 kg and 1000 kg of hazardous waste/month (Resource Conservation and Recovery Act (tracking hazardous waste)) - notification Business SIC classification: WRECKING AND DEMOLITION WORK; ELEMENTARY AND SECONDARY SCHOOLS Business NAICS classification: ELEMENTARY AND SECONDARY SCHOOLS. Organizations: NYC DESIGN & CONSTRUCTION FOR BD OF ED (CONTACT/OWNER)
, NYC DEPT OF EDUCATION (LEGALLY RESPONSIBLE PARTY)
Alternative names: 71-25 113TH STREET SCHOOL - P.S. 196
GOOD NEIGHBOR CLEANERS (102-30 QUEENS BLVD in FOREST HILLS, NY)
AIR MINOR (AIRS/AFS) STATE MASTER (New York facility tracking) - AIR PROGRAM Conditionally Exempt Small Quantity Generators, less than 100 kg/month of hazardous waste (Resource Conservation and Recovery Act (tracking hazardous waste)) - notification Business SIC classification: DRYCLEANING PLANTS, EXCEPT RUG CLEANING Business NAICS classification: DRYCLEANING AND LAUNDRY SERVICES (EXCEPT COIN-OPERATED). Organizations: KWEENZ INC (CONTACT/OWNER)
, LEES CLEANERS (LEGALLY RESPONSIBLE PARTY)
ALPHA OMEGA CLEANERS (101-11A QUEENS BOULEVARD in FOREST HILLS, NY)
AIR MINOR (AIRS/AFS) STATE MASTER (New York facility tracking) - AIR PROGRAM, HAZARDOUS WASTE PROGRAM Conditionally Exempt Small Quantity Generators, less than 100 kg/month of hazardous waste (Resource Conservation and Recovery Act (tracking hazardous waste)) - notification Business SIC classification: DRYCLEANING PLANTS, EXCEPT RUG CLEANING Business NAICS classification: DRYCLEANING AND LAUNDRY SERVICES (EXCEPT COIN-OPERATED). Organizations: HFDH ENTERPRISES INC (LEGALLY RESPONSIBLE PARTY)
, ALPHA OMEGA CLEANERS CORP (LEGALLY RESPONSIBLE PARTY)
ASH-BY CLEANERS INC (101-04 METROPOLITAN AVENUE in FLUSHING, NY)
AIR MINOR (AIRS/AFS) STATE MASTER (New York facility tracking) - AIR PROGRAM, HAZARDOUS WASTE PROGRAM (Resource Conservation and Recovery Act (tracking hazardous waste)) Business SIC classification: DRYCLEANING PLANTS, EXCEPT RUG CLEANING Business NAICS classification: DRYCLEANING AND LAUNDRY SERVICES (EXCEPT COIN-OPERATED). Alternative names: ASH BAY CLEANERS, ASH-BY INC
HOWARD FRENCH CLEANERS (112-14 QUEENS BLVD in FOREST HILLS, NY)
AIR MINOR (AIRS/AFS) STATE MASTER (New York facility tracking) - AIR PROGRAM, HAZARDOUS WASTE PROGRAM (Resource Conservation and Recovery Act (tracking hazardous waste)) Business SIC classification: DRYCLEANING PLANTS, EXCEPT RUG CLEANING Business NAICS classification: DRYCLEANING AND LAUNDRY SERVICES (EXCEPT COIN-OPERATED).
CHEY S KAPRI CLEANERS (102-03 QUEENS BOULEVARD in FOREST HILLS, NY)
AIR MINOR (AIRS/AFS) STATE MASTER (New York facility tracking) - AIR PROGRAM Conditionally Exempt Small Quantity Generators, less than 100 kg/month of hazardous waste (Resource Conservation and Recovery Act (tracking hazardous waste)) - notification Business SIC classification: DRYCLEANING PLANTS, EXCEPT RUG CLEANING Business NAICS classification: DRYCLEANING AND LAUNDRY SERVICES (EXCEPT COIN-OPERATED). Organizations: CHEYS KAPRI CLEANERS (CONTACT/OWNER)
Alternative names: CHEY'S KAPRI CLEANERS, KAPRI DRY CLEANERS
105-37 65TH AVE BUILDING (105-37 65TH AVE in FOREST HILLS, NY)
AIR SYNTHETIC MINOR (AIRS/AFS) STATE MASTER (New York facility tracking) - AIR PROGRAM Business SIC classification: OPERATORS OF APARTMENT BUILDINGS; OPERATORS OF DWELLINGS OTHER THAN APARTMENT BUILDINGS Organizations: 105-37 65TH AVE OWNERS CORP (LEGALLY RESPONSIBLE PARTY)
, BOULEVARD TENANTS CORP (LEGALLY RESPONSIBLE PARTY)
Alternative names: BOULEVARD TENANTS CORPORATION
102-32 TENANTS LTD (102-32 65TH AVE in FOREST HILLS, NY)
AIR SYNTHETIC MINOR (AIRS/AFS) STATE MASTER (New York facility tracking) - AIR PROGRAM Business SIC classification: OPERATORS OF APARTMENT BUILDINGS Business NAICS classification: LESSORS OF RESIDENTIAL BUILDINGS AND DWELLINGS.
113-14 72ND RD BUILDING (113-14 72ND RD in FOREST HILLS, NY)
AIR SYNTHETIC MINOR (AIRS/AFS) STATE MASTER (New York facility tracking) - AIR PROGRAM Business SIC classification: OPERATORS OF APARTMENT BUILDINGS Business NAICS classification: LESSORS OF RESIDENTIAL BUILDINGS AND DWELLINGS. Organizations: 113-14 72ND RD OWNERS CORP (LEGALLY RESPONSIBLE PARTY)
Alternative names: 113 14 OWNERS CORPORATION
HOME DEPOT THE REGO PARK (76-01 WOODHAVEN BLVD in FOREST HILLS, NY)
Large Quantity Generators, more that 1000 kg of hazardous waste/month (Resource Conservation and Recovery Act (tracking hazardous waste)) - notification Organizations: THE HOME DEPOT (CONTACT/OWNER)
CON EDISION - V 1849 (67 DR N 52' W YELLOWSTONE BLVD in FOREST HILLS, NY)
HAZARDOUS WASTE BIENNIAL REPORTER (Resource Conservation and Recovery Act (tracking hazardous waste)) Large Quantity Generators, more that 1000 kg of hazardous waste/month (Resource Conservation and Recovery Act (tracking hazardous waste)) Business NAICS classification: ELECTRIC POWER DISTRIBUTION.
CON EDISION - V9425 (W/S 108TH ST. 39TH S/O 69TH RD in FOREST HILLS, NY)
HAZARDOUS WASTE BIENNIAL REPORTER (Resource Conservation and Recovery Act (tracking hazardous waste)) Large Quantity Generators, more that 1000 kg of hazardous waste/month (Resource Conservation and Recovery Act (tracking hazardous waste)) Business NAICS classification: ELECTRIC POWER DISTRIBUTION.
CON ED - 32 AVE & DOWNINE ST (32 AVE & DOWNINE ST in FLUSHING, NY)
HAZARDOUS WASTE BIENNIAL REPORTER (Resource Conservation and Recovery Act (tracking hazardous waste)) (Resource Conservation and Recovery Act (tracking hazardous waste))
Housing units lacking complete plumbing facilities: 0.3% Housing units lacking complete kitchen facilities: 0.8%
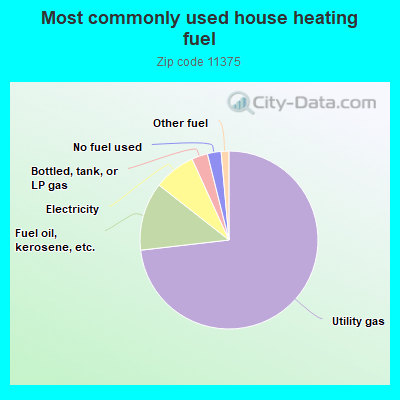
73.1%Utility gas
12.4%Fuel oil, kerosene, etc.
7.6%Electricity
2.9%Bottled, tank, or LP gas
2.5%No fuel used
1.4%Other fuel
Population in 1990: 65,180. Population change in the 1990s: +5,024 (+7.7%).
Place of birth for U.S.-born residents:
This state: 35,471
Northeast: 2,269
Midwest: 922
South: 1,252
West: 1,067
64% of the 11375 zip code residents lived in the same house 5 years ago. Out of people who lived in different houses, 58% lived in this county. Out of people who lived in different counties, 50% lived in New York.
91% of the 11375 zip code residents lived in the same house 1 year ago. Out of people who lived in different houses, 48% moved from this county. Out of people who lived in different houses, 27% moved from different county within same state. Out of people who lived in different houses, 14% moved from different state. Out of people who lived in different houses, 11% moved from abroad.
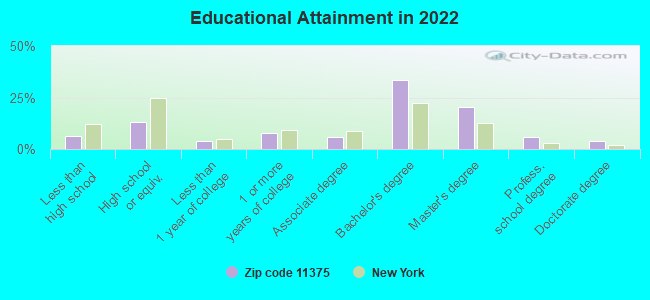
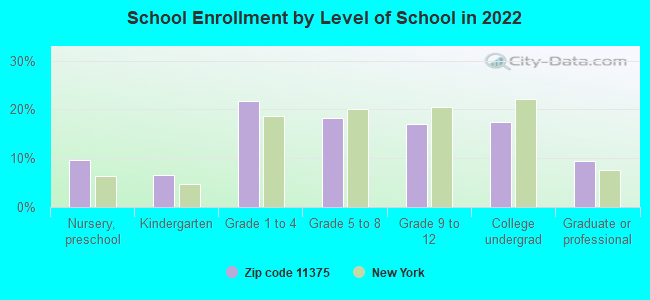
Private vs. public school enrollment:
Students in private schools in grades 1 to 8 (elementary and middle school): 668
Here:
12.1%
New York:
15.6%
Students in private schools in grades 9 to 12 (high school): 724
Here:
30.8%
New York:
15.0%
Students in private undergraduate colleges: 1,094
Here:
45.3%
New York:
39.2%
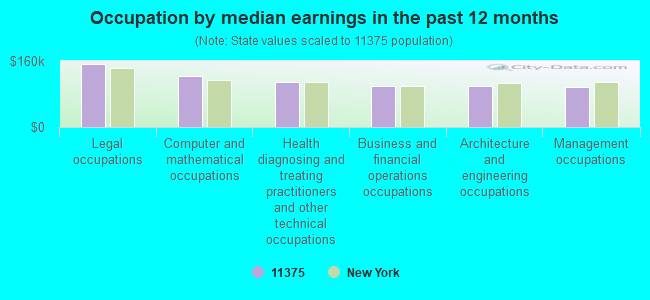
Occupation by median earnings in the past 12 months ($)
151,553Legal occupations
123,826Computer and mathematical occupations
109,529Health diagnosing and treating practitioners and other technical occupations
100,202Business and financial operations occupations
99,340Architecture and engineering occupations
97,477Management occupations
Companies with federal contracts located in this zip code:
ENTRON INDUSTRIES LP (11241 QUEENS BLVD STE 100 in FOREST HILLS, NY; small business) : $902,554 in 20 contractsfrom 2000 to 2006
Contracts for Converters, Electrical, Nonrotating, Launchers, Guided Missile, Antennas, Waveguides, and Related Equipment, Telephone and Telegraph Equipment, and moreby Defense Logistics Agency, Air Force Signed by year:2000: $44,137; 2001: $572,319; 2002: $0; 2003: $0; 2004: $163,598; 2005: $68,504; 2006: $53,996.
Biggest contracts:
$572,319 with Defense Logistics Agency for Converters, Electrical, Nonrotating. Signed on 2001-03-23. Completion date: 2002-01-07.
$94,423 with Air Force for Launchers, Guided Missile. Taking place in NJ. Signed on 2004-05-14. Completion date: 2005-02-28.
$48,175, same as above.Signed on 2004-05-14. Completion date: 2004-09-30.
$44,137 with Air Force for Converters, Electrical, Nonrotating. Signed on 2000-05-19. Completion date: 2002-05-20.
TLM Information Services (116-55 Queens Blvd in Forrest Hills, NY; small business)
$100,000 with Federal Highway Administration for Program Management/Support Services. Signed on 2004-01-16. Completion date: 2005-01-16.
JETBLUE AIRWAYS CORPORATION (11829 QUEENS BLVD in FOREST HILLS, NY)
$83,000 with Air Force for Passenger Air Charter Service. Signed on 2006-05-04. Completion date: 2006-05-07.
KYLE EVANS ENTERPRISES, INC (138-25 QUEENS BLVD in FOREST HILLS, NY; small business) : $69,443 in 2 contractsin 2004
$43,193 with Defense Logistics Agency for Switches. Signed on 2004-02-14. Completion date: 2004-06-13.
$26,250, same as above.Signed on 2004-03-29. Completion date: 2004-06-27.
CVISION TECHNOLOGIES, INC (118-35 QUEENS BLVD 14TH FL in FOREST HILLS, NY; small business) : $14,940 in 2 contractsfrom 2005 to 2006
$9,900 with Defense Logistics Agency for ADP Software. Signed on 2005-12-29. Completion date: 2006-01-31.
$5,040 with Navy for ADP Software. Signed on 2006-05-31. Completion date: 2006-06-30.
UVISION INC (10837 71ST AVE in FOREST HILLS, NY)
$8,090 with Army for ADP Support Equipment. Signed on 2005-01-19. Completion date: 2005-01-27.
Top industries in this zip code by the number of employees in 2005:
Health Care and Social Assistance: General Medical and Surgical Hospitals (over 1000 employees: 1 establishment, 500-999 employees: 1 establishment)
Health Care and Social Assistance: Home Health Care Services (over 1000: 1, 100-249: 2, 50-99: 2, 1-4: 2)
Health Care and Social Assistance: Offices of Physicians (except Mental Health Specialists) (100-249: 1, 20-49: 5, 10-19: 12, 5-9: 37, 1-4: 133)
Management of Companies and Enterprises: Corporate, Subsidiary, and Regional Managing Offices (500-999: 1, 1-4: 2)
Other Services (except Public Administration): Other Similar Organizations (except Business, Professional, Labor, and Political Organizations) (20-49: 2, 10-19: 11, 5-9: 25, 1-4: 55)
Health Care and Social Assistance: Offices of Dentists (10-19: 10, 5-9: 27, 1-4: 66)
Real Estate and Rental and Leasing: Lessors of Residential Buildings and Dwellings (20-49: 1, 10-19: 8, 5-9: 13, 1-4: 99)
Professional, Scientific, and Technical Services: Offices of Lawyers (20-49: 2, 10-19: 6, 5-9: 18, 1-4: 75)
People in group quarters in 2010:
438 people in nursing facilities/skilled-nursing facilities
16 people in group homes intended for adults
11 people in other noninstitutional facilities
People in group quarters in 2000:
419 people in nursing homes
129 people in religious group quarters
14 people in homes for the mentally retarded
12 people in other noninstitutional group quarters
11 people in wards in general hospitals for patients who have no usual home elsewhere
4 people in other nonhousehold living situations
Fatal accident statistics in 2014:
Fatal accident count: 2
Vehicles involved in fatal accidents: 2
Fatal accidents caused by drunken drivers: 0
Fatalities: 2
Persons involved in fatal accidents: 3
Pedestrians involved in fatal accidents: 2
Fatal accident statistics in 2013:
Fatal accident count: 1
Vehicles involved in fatal accidents: 1
Fatal accidents caused by drunken drivers: 0
Fatalities: 1
Persons involved in fatal accidents: 1
Pedestrians involved in fatal accidents: 1
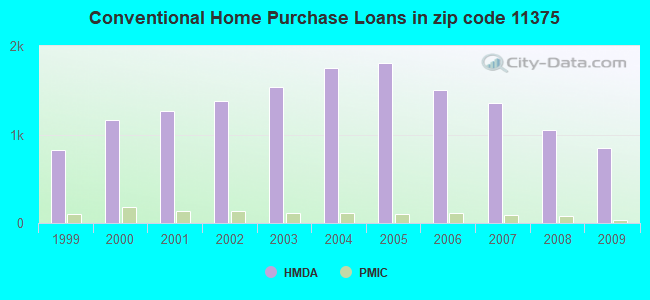
Home Mortgage Disclosure Act Aggregated Statistics For Year 2009 (Based on 20 full and 16 partial tracts)
A) FHA, FSA/RHS & VA Home Purchase Loans
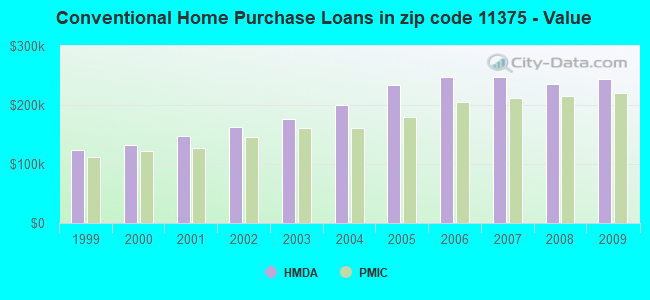
B) Conventional Home Purchase Loans
C) Refinancings
D) Home Improvement Loans
E) Loans on Dwellings For 5+ Families
F) Non-occupant Loans on < 5 Family Dwellings (A B C & D)
G) Loans On Manufactured Home Dwelling (A B C & D)
Number
Average Value
Number
Average Value
Number
Average Value
Number
Average Value
Number
Average Value
Number
Average Value
Number
Average Value
LOANS ORIGINATED
12
$472,029
845
$243,387
914
$226,986
34
$162,541
31
$2,025,962
38
$266,024
0
$0
APPLICATIONS APPROVED, NOT ACCEPTED
2
$528,845
97
$290,153
138
$247,129
7
$66,800
1
$3,900,000
6
$188,302
0
$0
APPLICATIONS DENIED
9
$451,907
200
$270,948
354
$293,308
29
$140,291
0
$0
38
$241,884
1
$201,920
APPLICATIONS WITHDRAWN
4
$560,500
100
$254,833
167
$254,034
4
$255,850
1
$1,400,000
5
$173,344
0
$0
FILES CLOSED FOR INCOMPLETENESS
2
$534,275
44
$215,425
126
$271,388
0
$0
1
$28,044,000
2
$138,985
0
$0
Aggregated Statistics For Year 2008 (Based on 20 full and 16 partial tracts)
A) FHA, FSA/RHS & VA Home Purchase Loans
B) Conventional Home Purchase Loans
C) Refinancings
D) Home Improvement Loans
E) Loans on Dwellings For 5+ Families
F) Non-occupant Loans on < 5 Family Dwellings (A B C & D)
Number
Average Value
Number
Average Value
Number
Average Value
Number
Average Value
Number
Average Value
Number
Average Value
LOANS ORIGINATED
4
$587,302
1,053
$235,329
319
$233,133
37
$109,104
10
$1,341,298
30
$257,953
APPLICATIONS APPROVED, NOT ACCEPTED
0
$0
180
$266,434
73
$287,260
21
$78,231
1
$7,500,000
9
$227,133
APPLICATIONS DENIED
5
$719,290
354
$275,552
228
$282,197
56
$105,894
1
$105,538,940
31
$259,592
APPLICATIONS WITHDRAWN
0
$0
120
$307,015
75
$355,372
11
$166,291
0
$0
12
$539,816
FILES CLOSED FOR INCOMPLETENESS
1
$437,210
55
$325,321
34
$309,521
5
$158,496
0
$0
5
$525,688
Aggregated Statistics For Year 2007 (Based on 20 full and 16 partial tracts)
B) Conventional Home Purchase Loans
C) Refinancings
D) Home Improvement Loans
E) Loans on Dwellings For 5+ Families
F) Non-occupant Loans on < 5 Family Dwellings (A B C & D)
Number
Average Value
Number
Average Value
Number
Average Value
Number
Average Value
Number
Average Value
LOANS ORIGINATED
1,360
$247,660
387
$259,064
74
$184,997
25
$2,152,773
75
$301,329
APPLICATIONS APPROVED, NOT ACCEPTED
283
$290,833
94
$336,637
25
$121,033
3
$1,156,067
21
$325,450
APPLICATIONS DENIED
285
$290,352
279
$334,625
66
$104,837
1
$200,000
53
$188,579
APPLICATIONS WITHDRAWN
103
$311,298
98
$332,751
9
$143,298
3
$2,645,050
13
$452,505
FILES CLOSED FOR INCOMPLETENESS
42
$218,614
38
$300,027
7
$261,093
0
$0
3
$290,667
Aggregated Statistics For Year 2006 (Based on 20 full and 16 partial tracts)
B) Conventional Home Purchase Loans
C) Refinancings
D) Home Improvement Loans
E) Loans on Dwellings For 5+ Families
F) Non-occupant Loans on < 5 Family Dwellings (A B C & D)
Number
Average Value
Number
Average Value
Number
Average Value
Number
Average Value
Number
Average Value
LOANS ORIGINATED
1,506
$248,027
472
$269,072
89
$163,149
22
$2,122,464
95
$301,591
APPLICATIONS APPROVED, NOT ACCEPTED
209
$264,833
91
$283,277
23
$84,980
2
$845,000
17
$343,561
APPLICATIONS DENIED
389
$292,439
287
$291,525
74
$177,572
1
$315,000
43
$268,823
APPLICATIONS WITHDRAWN
150
$314,125
152
$281,127
10
$223,474
0
$0
23
$316,483
FILES CLOSED FOR INCOMPLETENESS
43
$295,555
61
$284,350
10
$97,068
0
$0
7
$351,339
Aggregated Statistics For Year 2005 (Based on 20 full and 16 partial tracts)
B) Conventional Home Purchase Loans
C) Refinancings
D) Home Improvement Loans
E) Loans on Dwellings For 5+ Families
F) Non-occupant Loans on < 5 Family Dwellings (A B C & D)
G) Loans On Manufactured Home Dwelling (A B C & D)
Number
Average Value
Number
Average Value
Number
Average Value
Number
Average Value
Number
Average Value
Number
Average Value
LOANS ORIGINATED
1,808
$233,263
556
$236,832
80
$184,356
18
$2,694,469
93
$280,209
0
$0
APPLICATIONS APPROVED, NOT ACCEPTED
282
$267,214
123
$298,055
30
$154,216
5
$3,038,600
26
$302,607
2
$66,600
APPLICATIONS DENIED
372
$268,213
257
$270,142
71
$130,943
2
$496,050
48
$296,656
1
$26,000
APPLICATIONS WITHDRAWN
184
$284,661
173
$272,444
19
$154,131
1
$750,000
42
$252,749
1
$320,000
FILES CLOSED FOR INCOMPLETENESS
91
$299,719
110
$331,882
9
$142,919
0
$0
5
$243,202
0
$0
Aggregated Statistics For Year 2004 (Based on 20 full and 16 partial tracts)
A) FHA, FSA/RHS & VA Home Purchase Loans
B) Conventional Home Purchase Loans
C) Refinancings
D) Home Improvement Loans
E) Loans on Dwellings For 5+ Families
F) Non-occupant Loans on < 5 Family Dwellings (A B C & D)
G) Loans On Manufactured Home Dwelling (A B C & D)
Number
Average Value
Number
Average Value
Number
Average Value
Number
Average Value
Number
Average Value
Number
Average Value
Number
Average Value
LOANS ORIGINATED
1
$192,760
1,750
$199,292
713
$193,787
73
$133,342
29
$1,983,105
106
$200,679
2
$137,380
APPLICATIONS APPROVED, NOT ACCEPTED
0
$0
251
$235,319
162
$225,466
16
$101,240
2
$8,500,000
16
$238,677
0
$0
APPLICATIONS DENIED
0
$0
306
$207,984
319
$217,218
73
$109,964
3
$6,688,600
55
$168,569
2
$14,840
APPLICATIONS WITHDRAWN
0
$0
146
$237,271
135
$297,913
13
$104,335
2
$14,985,000
24
$230,735
0
$0
FILES CLOSED FOR INCOMPLETENESS
1
$90,360
56
$238,756
67
$262,791
8
$107,154
0
$0
15
$202,433
0
$0
Aggregated Statistics For Year 2003 (Based on 20 full and 16 partial tracts)
A) FHA, FSA/RHS & VA Home Purchase Loans
B) Conventional Home Purchase Loans
C) Refinancings
D) Home Improvement Loans
E) Loans on Dwellings For 5+ Families
F) Non-occupant Loans on < 5 Family Dwellings (A B C & D)
Number
Average Value
Number
Average Value
Number
Average Value
Number
Average Value
Number
Average Value
Number
Average Value
LOANS ORIGINATED
6
$332,068
1,538
$176,862
1,838
$178,264
25
$76,914
6
$2,390,275
107
$228,682
APPLICATIONS APPROVED, NOT ACCEPTED
0
$0
208
$201,596
295
$197,797
23
$114,851
1
$11,500,000
20
$258,918
APPLICATIONS DENIED
0
$0
271
$199,565
447
$217,152
54
$64,938
0
$0
47
$156,957
APPLICATIONS WITHDRAWN
1
$204,000
114
$246,220
212
$213,904
12
$88,487
3
$3,093,447
19
$202,726
FILES CLOSED FOR INCOMPLETENESS
0
$0
50
$183,972
95
$199,310
5
$115,974
0
$0
3
$99,163
Aggregated Statistics For Year 2002 (Based on 19 full and 16 partial tracts)
A) FHA, FSA/RHS & VA Home Purchase Loans
B) Conventional Home Purchase Loans
C) Refinancings
D) Home Improvement Loans
E) Loans on Dwellings For 5+ Families
F) Non-occupant Loans on < 5 Family Dwellings (A B C & D)
Number
Average Value
Number
Average Value
Number
Average Value
Number
Average Value
Number
Average Value
Number
Average Value
LOANS ORIGINATED
1
$132,660
1,378
$161,914
987
$169,693
50
$92,643
14
$2,152,360
86
$194,848
APPLICATIONS APPROVED, NOT ACCEPTED
0
$0
203
$192,568
219
$185,939
16
$53,071
0
$0
17
$204,861
APPLICATIONS DENIED
0
$0
197
$148,129
287
$206,497
45
$86,021
0
$0
21
$194,817
APPLICATIONS WITHDRAWN
0
$0
97
$171,616
192
$221,056
29
$69,404
1
$8,200,000
12
$193,492
FILES CLOSED FOR INCOMPLETENESS
0
$0
45
$180,420
60
$183,239
4
$47,128
1
$10,096,000
6
$267,793
Aggregated Statistics For Year 2001 (Based on 19 full and 16 partial tracts)
A) FHA, FSA/RHS & VA Home Purchase Loans
B) Conventional Home Purchase Loans
C) Refinancings
D) Home Improvement Loans
E) Loans on Dwellings For 5+ Families
F) Non-occupant Loans on < 5 Family Dwellings (A B C & D)
Number
Average Value
Number
Average Value
Number
Average Value
Number
Average Value
Number
Average Value
Number
Average Value
LOANS ORIGINATED
3
$206,387
1,263
$146,660
518
$169,592
47
$59,755
22
$1,803,535
47
$163,550
APPLICATIONS APPROVED, NOT ACCEPTED
1
$126,650
159
$165,655
142
$199,081
15
$64,327
1
$7,493,340
11
$186,899
APPLICATIONS DENIED
2
$123,500
189
$132,093
248
$188,661
75
$67,978
0
$0
24
$132,778
APPLICATIONS WITHDRAWN
7
$199,299
88
$178,458
199
$146,937
33
$68,073
2
$1,600,000
11
$130,264
FILES CLOSED FOR INCOMPLETENESS
2
$194,105
47
$122,898
65
$172,660
3
$62,577
0
$0
4
$199,105
Aggregated Statistics For Year 2000 (Based on 19 full and 16 partial tracts)
A) FHA, FSA/RHS & VA Home Purchase Loans
B) Conventional Home Purchase Loans
C) Refinancings
D) Home Improvement Loans
E) Loans on Dwellings For 5+ Families
F) Non-occupant Loans on < 5 Family Dwellings (A B C & D)
Number
Average Value
Number
Average Value
Number
Average Value
Number
Average Value
Number
Average Value
Number
Average Value
LOANS ORIGINATED
6
$260,210
1,159
$132,258
173
$167,135
41
$55,747
11
$3,071,747
38
$163,486
APPLICATIONS APPROVED, NOT ACCEPTED
0
$0
139
$160,886
45
$128,681
31
$75,166
0
$0
12
$198,375
APPLICATIONS DENIED
1
$209,960
280
$122,806
149
$178,891
55
$62,065
1
$224,000
36
$230,224
APPLICATIONS WITHDRAWN
1
$187,000
100
$179,519
134
$121,880
17
$92,727
6
$3,363,958
9
$243,283
FILES CLOSED FOR INCOMPLETENESS
0
$0
44
$139,135
29
$103,802
9
$77,283
0
$0
2
$295,575
Aggregated Statistics For Year 1999 (Based on 16 full and 11 partial tracts)
A) FHA, FSA/RHS & VA Home Purchase Loans
B) Conventional Home Purchase Loans
C) Refinancings
D) Home Improvement Loans
E) Loans on Dwellings For 5+ Families
F) Non-occupant Loans on < 5 Family Dwellings (A B C & D)
2007 - 2018 National Fire Incident Reporting System (NFIRS) incidents
According to the data from the years 2007 - 2018 the average number of fire incidents per year is 182. The highest number of reported fires - 223 took place in 2008, and the least - 143 in 2011. The data has an increasing trend.
When looking into fire subcategories, the most reports belonged to: Structure Fires (67.0%), and Outside Fires (22.3%).
Fire incident types reported to NFIRS in Zip Code 11375


 Nearest zip codes: 11374, 11424, 11367, 11415, 11418, 11368.


 (Students: 350, Location: 7025 KESSEL ST, Grades: PK-8)
 According to the data from the years 2007 - 2018 the average number of fire incidents per year is 182. The highest number of reported fires - 223 took place in 2008, and the least - 143 in 2011. The data has an increasing trend.
 When looking into fire subcategories, the most reports belonged to: Structure Fires (67.0%), and Outside Fires (22.3%).