Estimated zip code population in 2022: 19,992
Zip code population in 2010: 19,341
Zip code population in 2000: 20,956
Houses and condos: 9,601
Renter-occupied apartments: 5,108
% of renters here:
58%State:
46%
March 2022 cost of living index in zip code 11415: 144.4
(very high, U.S. average is 100)
Land area: 0.6
sq. mi.
Water area: 0.0
sq. mi.
Population density: 35,188 people per square mile (very high).
OSM Map
General Map
Google Map
MSN Map
OSM Map
General Map
Google Map
MSN Map
OSM Map
General Map
Google Map
MSN Map
OSM Map
General Map
Google Map
MSN Map
Please wait while loading the map...
Real estate property taxes paid for housing units in 2022:
This zip code:
1.4% ($5,619)New York:
1.5% ($6,180)
Median real estate property taxes paid for housing units with mortgages in 2022: $5,259 (1.4%)
Median real estate property taxes paid for housing units with no mortgage in 2022: $6,089 (1.5%)
Profiles of local businesses
Business Search - 14 Million verified businesses
Males: 10,271 Females: 9,721
For population 25 years and over in 11415:
High school or higher: 89.0%Bachelor's degree or higher: 52.3%Graduate or professional degree: 23.8%Unemployed: 4.7%Mean travel time to work (commute): 42.7 minutes
For population 15 years and over in 11415:
Never married: 37.7%Now married: 45.7%Separated: 1.3%Widowed: 6.8%Divorced: 8.4%
Zip code 11415 compared to state average:
Black race population percentage below state average. Foreign-born population percentage above state average. Number of rooms per house significantly below state average. 8,459 42.3% White 4,587 22.9% Hispanic or Latino 4,466 22.3% Asian 1,337 6.7% Black 688 3.4% Two or more races 414 2.1% Some other race 33 0.2% American Indian 5 0.03% Native Hawaiian and Other
Data:
Median household income ($)
Median household income (% change since 2000)
Household income diversity
Ratio of average income to average house value (%)
Ratio of average income to average rent
Median household income ($) - White
Median household income ($) - Black or African American
Median household income ($) - Asian
Median household income ($) - Hispanic or Latino
Median household income ($) - American Indian and Alaska Native
Median household income ($) - Multirace
Median household income ($) - Other Race
Median household income for houses/condos with a mortgage ($)
Median household income for apartments without a mortgage ($)
Races - White alone (%)
Races - White alone (% change since 2000)
Races - Black alone (%)
Races - Black alone (% change since 2000)
Races - American Indian alone (%)
Races - American Indian alone (% change since 2000)
Races - Asian alone (%)
Races - Asian alone (% change since 2000)
Races - Hispanic (%)
Races - Hispanic (% change since 2000)
Races - Native Hawaiian and Other Pacific Islander alone (%)
Races - Native Hawaiian and Other Pacific Islander alone (% change since 2000)
Races - Two or more races (%)
Races - Two or more races (% change since 2000)
Races - Other race alone (%)
Races - Other race alone (% change since 2000)
Racial diversity
Unemployment (%)
Unemployment (% change since 2000)
Unemployment (%) - White
Unemployment (%) - Black or African American
Unemployment (%) - Asian
Unemployment (%) - Hispanic or Latino
Unemployment (%) - American Indian and Alaska Native
Unemployment (%) - Multirace
Unemployment (%) - Other Race
Population density (people per square mile)
Population - Males (%)
Population - Females (%)
Population - Males (%) - White
Population - Males (%) - Black or African American
Population - Males (%) - Asian
Population - Males (%) - Hispanic or Latino
Population - Males (%) - American Indian and Alaska Native
Population - Males (%) - Multirace
Population - Males (%) - Other Race
Population - Females (%) - White
Population - Females (%) - Black or African American
Population - Females (%) - Asian
Population - Females (%) - Hispanic or Latino
Population - Females (%) - American Indian and Alaska Native
Population - Females (%) - Multirace
Population - Females (%) - Other Race
Coronavirus confirmed cases (Apr 27, 2024)
Deaths caused by coronavirus (Apr 27, 2024)
Coronavirus confirmed cases (per 100k population) (Apr 27, 2024)
Deaths caused by coronavirus (per 100k population) (Apr 27, 2024)
Daily increase in number of cases (Apr 27, 2024)
Weekly increase in number of cases (Apr 27, 2024)
Cases doubled (in days) (Apr 27, 2024)
Hospitalized patients (Apr 18, 2022)
Negative test results (Apr 18, 2022)
Total test results (Apr 18, 2022)
COVID Vaccine doses distributed (per 100k population) (Sep 19, 2023)
COVID Vaccine doses administered (per 100k population) (Sep 19, 2023)
COVID Vaccine doses distributed (Sep 19, 2023)
COVID Vaccine doses administered (Sep 19, 2023)
Likely homosexual households (%)
Likely homosexual households (% change since 2000)
Likely homosexual households - Lesbian couples (%)
Likely homosexual households - Lesbian couples (% change since 2000)
Likely homosexual households - Gay men (%)
Likely homosexual households - Gay men (% change since 2000)
Cost of living index
Median gross rent ($)
Median contract rent ($)
Median monthly housing costs ($)
Median house or condo value ($)
Median house or condo value ($ change since 2000)
Mean house or condo value by units in structure - 1, detached ($)
Mean house or condo value by units in structure - 1, attached ($)
Mean house or condo value by units in structure - 2 ($)
Mean house or condo value by units in structure by units in structure - 3 or 4 ($)
Mean house or condo value by units in structure - 5 or more ($)
Mean house or condo value by units in structure - Boat, RV, van, etc. ($)
Mean house or condo value by units in structure - Mobile home ($)
Median house or condo value ($) - White
Median house or condo value ($) - Black or African American
Median house or condo value ($) - Asian
Median house or condo value ($) - Hispanic or Latino
Median house or condo value ($) - American Indian and Alaska Native
Median house or condo value ($) - Multirace
Median house or condo value ($) - Other Race
Median resident age
Resident age diversity
Median resident age - Males
Median resident age - Females
Median resident age - White
Median resident age - Black or African American
Median resident age - Asian
Median resident age - Hispanic or Latino
Median resident age - American Indian and Alaska Native
Median resident age - Multirace
Median resident age - Other Race
Median resident age - Males - White
Median resident age - Males - Black or African American
Median resident age - Males - Asian
Median resident age - Males - Hispanic or Latino
Median resident age - Males - American Indian and Alaska Native
Median resident age - Males - Multirace
Median resident age - Males - Other Race
Median resident age - Females - White
Median resident age - Females - Black or African American
Median resident age - Females - Asian
Median resident age - Females - Hispanic or Latino
Median resident age - Females - American Indian and Alaska Native
Median resident age - Females - Multirace
Median resident age - Females - Other Race
Commute - mean travel time to work (minutes)
Travel time to work - Less than 5 minutes (%)
Travel time to work - Less than 5 minutes (% change since 2000)
Travel time to work - 5 to 9 minutes (%)
Travel time to work - 5 to 9 minutes (% change since 2000)
Travel time to work - 10 to 19 minutes (%)
Travel time to work - 10 to 19 minutes (% change since 2000)
Travel time to work - 20 to 29 minutes (%)
Travel time to work - 20 to 29 minutes (% change since 2000)
Travel time to work - 30 to 39 minutes (%)
Travel time to work - 30 to 39 minutes (% change since 2000)
Travel time to work - 40 to 59 minutes (%)
Travel time to work - 40 to 59 minutes (% change since 2000)
Travel time to work - 60 to 89 minutes (%)
Travel time to work - 60 to 89 minutes (% change since 2000)
Travel time to work - 90 or more minutes (%)
Travel time to work - 90 or more minutes (% change since 2000)
Marital status - Never married (%)
Marital status - Now married (%)
Marital status - Separated (%)
Marital status - Widowed (%)
Marital status - Divorced (%)
Median family income ($)
Median family income (% change since 2000)
Median non-family income ($)
Median non-family income (% change since 2000)
Median per capita income ($)
Median per capita income (% change since 2000)
Median family income ($) - White
Median family income ($) - Black or African American
Median family income ($) - Asian
Median family income ($) - Hispanic or Latino
Median family income ($) - American Indian and Alaska Native
Median family income ($) - Multirace
Median family income ($) - Other Race
Median year house/condo built
Median year apartment built
Year house built - Built 2005 or later (%)
Year house built - Built 2000 to 2004 (%)
Year house built - Built 1990 to 1999 (%)
Year house built - Built 1980 to 1989 (%)
Year house built - Built 1970 to 1979 (%)
Year house built - Built 1960 to 1969 (%)
Year house built - Built 1950 to 1959 (%)
Year house built - Built 1940 to 1949 (%)
Year house built - Built 1939 or earlier (%)
Average household size
Household density (households per square mile)
Average household size - White
Average household size - Black or African American
Average household size - Asian
Average household size - Hispanic or Latino
Average household size - American Indian and Alaska Native
Average household size - Multirace
Average household size - Other Race
Occupied housing units (%)
Vacant housing units (%)
Owner occupied housing units (%)
Renter occupied housing units (%)
Vacancy status - For rent (%)
Vacancy status - For sale only (%)
Vacancy status - Rented or sold, not occupied (%)
Vacancy status - For seasonal, recreational, or occasional use (%)
Vacancy status - For migrant workers (%)
Vacancy status - Other vacant (%)
Residents with income below the poverty level (%)
Residents with income below 50% of the poverty level (%)
Children below poverty level (%)
Poor families by family type - Married-couple family (%)
Poor families by family type - Male, no wife present (%)
Poor families by family type - Female, no husband present (%)
Poverty status for native-born residents (%)
Poverty status for foreign-born residents (%)
Poverty among high school graduates not in families (%)
Poverty among people who did not graduate high school not in families (%)
Residents with income below the poverty level (%) - White
Residents with income below the poverty level (%) - Black or African American
Residents with income below the poverty level (%) - Asian
Residents with income below the poverty level (%) - Hispanic or Latino
Residents with income below the poverty level (%) - American Indian and Alaska Native
Residents with income below the poverty level (%) - Multirace
Residents with income below the poverty level (%) - Other Race
Air pollution - Air Quality Index (AQI)
Air pollution - CO
Air pollution - NO2
Air pollution - SO2
Air pollution - Ozone
Air pollution - PM10
Air pollution - PM25
Air pollution - Pb
Crime - Murders per 100,000 population
Crime - Rapes per 100,000 population
Crime - Robberies per 100,000 population
Crime - Assaults per 100,000 population
Crime - Burglaries per 100,000 population
Crime - Thefts per 100,000 population
Crime - Auto thefts per 100,000 population
Crime - Arson per 100,000 population
Crime - City-data.com crime index
Crime - Violent crime index
Crime - Property crime index
Crime - Murders per 100,000 population (5 year average)
Crime - Rapes per 100,000 population (5 year average)
Crime - Robberies per 100,000 population (5 year average)
Crime - Assaults per 100,000 population (5 year average)
Crime - Burglaries per 100,000 population (5 year average)
Crime - Thefts per 100,000 population (5 year average)
Crime - Auto thefts per 100,000 population (5 year average)
Crime - Arson per 100,000 population (5 year average)
Crime - City-data.com crime index (5 year average)
Crime - Violent crime index (5 year average)
Crime - Property crime index (5 year average)
1996 Presidential Elections Results (%) - Democratic Party (Clinton)
1996 Presidential Elections Results (%) - Republican Party (Dole)
1996 Presidential Elections Results (%) - Other
2000 Presidential Elections Results (%) - Democratic Party (Gore)
2000 Presidential Elections Results (%) - Republican Party (Bush)
2000 Presidential Elections Results (%) - Other
2004 Presidential Elections Results (%) - Democratic Party (Kerry)
2004 Presidential Elections Results (%) - Republican Party (Bush)
2004 Presidential Elections Results (%) - Other
2008 Presidential Elections Results (%) - Democratic Party (Obama)
2008 Presidential Elections Results (%) - Republican Party (McCain)
2008 Presidential Elections Results (%) - Other
2012 Presidential Elections Results (%) - Democratic Party (Obama)
2012 Presidential Elections Results (%) - Republican Party (Romney)
2012 Presidential Elections Results (%) - Other
2016 Presidential Elections Results (%) - Democratic Party (Clinton)
2016 Presidential Elections Results (%) - Republican Party (Trump)
2016 Presidential Elections Results (%) - Other
2020 Presidential Elections Results (%) - Democratic Party (Biden)
2020 Presidential Elections Results (%) - Republican Party (Trump)
2020 Presidential Elections Results (%) - Other
Ancestries Reported - Arab (%)
Ancestries Reported - Czech (%)
Ancestries Reported - Danish (%)
Ancestries Reported - Dutch (%)
Ancestries Reported - English (%)
Ancestries Reported - French (%)
Ancestries Reported - French Canadian (%)
Ancestries Reported - German (%)
Ancestries Reported - Greek (%)
Ancestries Reported - Hungarian (%)
Ancestries Reported - Irish (%)
Ancestries Reported - Italian (%)
Ancestries Reported - Lithuanian (%)
Ancestries Reported - Norwegian (%)
Ancestries Reported - Polish (%)
Ancestries Reported - Portuguese (%)
Ancestries Reported - Russian (%)
Ancestries Reported - Scotch-Irish (%)
Ancestries Reported - Scottish (%)
Ancestries Reported - Slovak (%)
Ancestries Reported - Subsaharan African (%)
Ancestries Reported - Swedish (%)
Ancestries Reported - Swiss (%)
Ancestries Reported - Ukrainian (%)
Ancestries Reported - United States (%)
Ancestries Reported - Welsh (%)
Ancestries Reported - West Indian (%)
Ancestries Reported - Other (%)
Educational Attainment - No schooling completed (%)
Educational Attainment - Less than high school (%)
Educational Attainment - High school or equivalent (%)
Educational Attainment - Less than 1 year of college (%)
Educational Attainment - 1 or more years of college (%)
Educational Attainment - Associate degree (%)
Educational Attainment - Bachelor's degree (%)
Educational Attainment - Master's degree (%)
Educational Attainment - Professional school degree (%)
Educational Attainment - Doctorate degree (%)
School Enrollment - Nursery, preschool (%)
School Enrollment - Kindergarten (%)
School Enrollment - Grade 1 to 4 (%)
School Enrollment - Grade 5 to 8 (%)
School Enrollment - Grade 9 to 12 (%)
School Enrollment - College undergrad (%)
School Enrollment - Graduate or professional (%)
School Enrollment - Not enrolled in school (%)
School enrollment - Public schools (%)
School enrollment - Private schools (%)
School enrollment - Not enrolled (%)
Median number of rooms in houses and condos
Median number of rooms in apartments
Housing units lacking complete plumbing facilities (%)
Housing units lacking complete kitchen facilities (%)
Density of houses
Urban houses (%)
Rural houses (%)
Households with people 60 years and over (%)
Households with people 65 years and over (%)
Households with people 75 years and over (%)
Households with one or more nonrelatives (%)
Households with no nonrelatives (%)
Population in households (%)
Family households (%)
Nonfamily households (%)
Population in families (%)
Family households with own children (%)
Median number of bedrooms in owner occupied houses
Mean number of bedrooms in owner occupied houses
Median number of bedrooms in renter occupied houses
Mean number of bedrooms in renter occupied houses
Median number of vehichles in owner occupied houses
Mean number of vehichles in owner occupied houses
Median number of vehichles in renter occupied houses
Mean number of vehichles in renter occupied houses
Mortgage status - with mortgage (%)
Mortgage status - with second mortgage (%)
Mortgage status - with home equity loan (%)
Mortgage status - with both second mortgage and home equity loan (%)
Mortgage status - without a mortgage (%)
Average family size
Average family size - White
Average family size - Black or African American
Average family size - Asian
Average family size - Hispanic or Latino
Average family size - American Indian and Alaska Native
Average family size - Multirace
Average family size - Other Race
Geographical mobility - Same house 1 year ago (%)
Geographical mobility - Moved within same county (%)
Geographical mobility - Moved from different county within same state (%)
Geographical mobility - Moved from different state (%)
Geographical mobility - Moved from abroad (%)
Place of birth - Born in state of residence (%)
Place of birth - Born in other state (%)
Place of birth - Native, outside of US (%)
Place of birth - Foreign born (%)
Housing units in structures - 1, detached (%)
Housing units in structures - 1, attached (%)
Housing units in structures - 2 (%)
Housing units in structures - 3 or 4 (%)
Housing units in structures - 5 to 9 (%)
Housing units in structures - 10 to 19 (%)
Housing units in structures - 20 to 49 (%)
Housing units in structures - 50 or more (%)
Housing units in structures - Mobile home (%)
Housing units in structures - Boat, RV, van, etc. (%)
House/condo owner moved in on average (years ago)
Renter moved in on average (years ago)
Year householder moved into unit - Moved in 1999 to March 2000 (%)
Year householder moved into unit - Moved in 1995 to 1998 (%)
Year householder moved into unit - Moved in 1990 to 1994 (%)
Year householder moved into unit - Moved in 1980 to 1989 (%)
Year householder moved into unit - Moved in 1970 to 1979 (%)
Year householder moved into unit - Moved in 1969 or earlier (%)
Means of transportation to work - Drove car alone (%)
Means of transportation to work - Carpooled (%)
Means of transportation to work - Public transportation (%)
Means of transportation to work - Bus or trolley bus (%)
Means of transportation to work - Streetcar or trolley car (%)
Means of transportation to work - Subway or elevated (%)
Means of transportation to work - Railroad (%)
Means of transportation to work - Ferryboat (%)
Means of transportation to work - Taxicab (%)
Means of transportation to work - Motorcycle (%)
Means of transportation to work - Bicycle (%)
Means of transportation to work - Walked (%)
Means of transportation to work - Other means (%)
Working at home (%)
Industry diversity
Most Common Industries - Agriculture, forestry, fishing and hunting, and mining (%)
Most Common Industries - Agriculture, forestry, fishing and hunting (%)
Most Common Industries - Mining, quarrying, and oil and gas extraction (%)
Most Common Industries - Construction (%)
Most Common Industries - Manufacturing (%)
Most Common Industries - Wholesale trade (%)
Most Common Industries - Retail trade (%)
Most Common Industries - Transportation and warehousing, and utilities (%)
Most Common Industries - Transportation and warehousing (%)
Most Common Industries - Utilities (%)
Most Common Industries - Information (%)
Most Common Industries - Finance and insurance, and real estate and rental and leasing (%)
Most Common Industries - Finance and insurance (%)
Most Common Industries - Real estate and rental and leasing (%)
Most Common Industries - Professional, scientific, and management, and administrative and waste management services (%)
Most Common Industries - Professional, scientific, and technical services (%)
Most Common Industries - Management of companies and enterprises (%)
Most Common Industries - Administrative and support and waste management services (%)
Most Common Industries - Educational services, and health care and social assistance (%)
Most Common Industries - Educational services (%)
Most Common Industries - Health care and social assistance (%)
Most Common Industries - Arts, entertainment, and recreation, and accommodation and food services (%)
Most Common Industries - Arts, entertainment, and recreation (%)
Most Common Industries - Accommodation and food services (%)
Most Common Industries - Other services, except public administration (%)
Most Common Industries - Public administration (%)
Occupation diversity
Most Common Occupations - Management, business, science, and arts occupations (%)
Most Common Occupations - Management, business, and financial occupations (%)
Most Common Occupations - Management occupations (%)
Most Common Occupations - Business and financial operations occupations (%)
Most Common Occupations - Computer, engineering, and science occupations (%)
Most Common Occupations - Computer and mathematical occupations (%)
Most Common Occupations - Architecture and engineering occupations (%)
Most Common Occupations - Life, physical, and social science occupations (%)
Most Common Occupations - Education, legal, community service, arts, and media occupations (%)
Most Common Occupations - Community and social service occupations (%)
Most Common Occupations - Legal occupations (%)
Most Common Occupations - Education, training, and library occupations (%)
Most Common Occupations - Arts, design, entertainment, sports, and media occupations (%)
Most Common Occupations - Healthcare practitioners and technical occupations (%)
Most Common Occupations - Health diagnosing and treating practitioners and other technical occupations (%)
Most Common Occupations - Health technologists and technicians (%)
Most Common Occupations - Service occupations (%)
Most Common Occupations - Healthcare support occupations (%)
Most Common Occupations - Protective service occupations (%)
Most Common Occupations - Fire fighting and prevention, and other protective service workers including supervisors (%)
Most Common Occupations - Law enforcement workers including supervisors (%)
Most Common Occupations - Food preparation and serving related occupations (%)
Most Common Occupations - Building and grounds cleaning and maintenance occupations (%)
Most Common Occupations - Personal care and service occupations (%)
Most Common Occupations - Sales and office occupations (%)
Most Common Occupations - Sales and related occupations (%)
Most Common Occupations - Office and administrative support occupations (%)
Most Common Occupations - Natural resources, construction, and maintenance occupations (%)
Most Common Occupations - Farming, fishing, and forestry occupations (%)
Most Common Occupations - Construction and extraction occupations (%)
Most Common Occupations - Installation, maintenance, and repair occupations (%)
Most Common Occupations - Production, transportation, and material moving occupations (%)
Most Common Occupations - Production occupations (%)
Most Common Occupations - Transportation occupations (%)
Most Common Occupations - Material moving occupations (%)
People in Group quarters - Institutionalized population (%)
People in Group quarters - Correctional institutions (%)
People in Group quarters - Federal prisons and detention centers (%)
People in Group quarters - Halfway houses (%)
People in Group quarters - Local jails and other confinement facilities (including police lockups) (%)
People in Group quarters - Military disciplinary barracks (%)
People in Group quarters - State prisons (%)
People in Group quarters - Other types of correctional institutions (%)
People in Group quarters - Nursing homes (%)
People in Group quarters - Hospitals/wards, hospices, and schools for the handicapped (%)
People in Group quarters - Hospitals/wards and hospices for chronically ill (%)
People in Group quarters - Hospices or homes for chronically ill (%)
People in Group quarters - Military hospitals or wards for chronically ill (%)
People in Group quarters - Other hospitals or wards for chronically ill (%)
People in Group quarters - Hospitals or wards for drug/alcohol abuse (%)
People in Group quarters - Mental (Psychiatric) hospitals or wards (%)
People in Group quarters - Schools, hospitals, or wards for the mentally retarded (%)
People in Group quarters - Schools, hospitals, or wards for the physically handicapped (%)
People in Group quarters - Institutions for the deaf (%)
People in Group quarters - Institutions for the blind (%)
People in Group quarters - Orthopedic wards and institutions for the physically handicapped (%)
People in Group quarters - Wards in general hospitals for patients who have no usual home elsewhere (%)
People in Group quarters - Wards in military hospitals for patients who have no usual home elsewhere (%)
People in Group quarters - Juvenile institutions (%)
People in Group quarters - Long-term care (%)
People in Group quarters - Homes for abused, dependent, and neglected children (%)
People in Group quarters - Residential treatment centers for emotionally disturbed children (%)
People in Group quarters - Training schools for juvenile delinquents (%)
People in Group quarters - Short-term care, detention or diagnostic centers for delinquent children (%)
People in Group quarters - Type of juvenile institution unknown (%)
People in Group quarters - Noninstitutionalized population (%)
People in Group quarters - College dormitories (includes college quarters off campus) (%)
People in Group quarters - Military quarters (%)
People in Group quarters - On base (%)
People in Group quarters - Barracks, unaccompanied personnel housing (UPH), (Enlisted/Officer), ;and similar group living quarters for military personnel (%)
People in Group quarters - Transient quarters for temporary residents (%)
People in Group quarters - Military ships (%)
People in Group quarters - Group homes (%)
People in Group quarters - Homes or halfway houses for drug/alcohol abuse (%)
People in Group quarters - Homes for the mentally ill (%)
People in Group quarters - Homes for the mentally retarded (%)
People in Group quarters - Homes for the physically handicapped (%)
People in Group quarters - Other group homes (%)
People in Group quarters - Religious group quarters (%)
People in Group quarters - Dormitories (%)
People in Group quarters - Agriculture workers' dormitories on farms (%)
People in Group quarters - Job Corps and vocational training facilities (%)
People in Group quarters - Other workers' dormitories (%)
People in Group quarters - Crews of maritime vessels (%)
People in Group quarters - Other nonhousehold living situations (%)
People in Group quarters - Other noninstitutional group quarters (%)
Residents speaking English at home (%)
Residents speaking English at home - Born in the United States (%)
Residents speaking English at home - Native, born elsewhere (%)
Residents speaking English at home - Foreign born (%)
Residents speaking Spanish at home (%)
Residents speaking Spanish at home - Born in the United States (%)
Residents speaking Spanish at home - Native, born elsewhere (%)
Residents speaking Spanish at home - Foreign born (%)
Residents speaking other language at home (%)
Residents speaking other language at home - Born in the United States (%)
Residents speaking other language at home - Native, born elsewhere (%)
Residents speaking other language at home - Foreign born (%)
Class of Workers - Employee of private company (%)
Class of Workers - Self-employed in own incorporated business (%)
Class of Workers - Private not-for-profit wage and salary workers (%)
Class of Workers - Local government workers (%)
Class of Workers - State government workers (%)
Class of Workers - Federal government workers (%)
Class of Workers - Self-employed workers in own not incorporated business and Unpaid family workers (%)
House heating fuel used in houses and condos - Utility gas (%)
House heating fuel used in houses and condos - Bottled, tank, or LP gas (%)
House heating fuel used in houses and condos - Electricity (%)
House heating fuel used in houses and condos - Fuel oil, kerosene, etc. (%)
House heating fuel used in houses and condos - Coal or coke (%)
House heating fuel used in houses and condos - Wood (%)
House heating fuel used in houses and condos - Solar energy (%)
House heating fuel used in houses and condos - Other fuel (%)
House heating fuel used in houses and condos - No fuel used (%)
House heating fuel used in apartments - Utility gas (%)
House heating fuel used in apartments - Bottled, tank, or LP gas (%)
House heating fuel used in apartments - Electricity (%)
House heating fuel used in apartments - Fuel oil, kerosene, etc. (%)
House heating fuel used in apartments - Coal or coke (%)
House heating fuel used in apartments - Wood (%)
House heating fuel used in apartments - Solar energy (%)
House heating fuel used in apartments - Other fuel (%)
House heating fuel used in apartments - No fuel used (%)
Armed forces status - In Armed Forces (%)
Armed forces status - Civilian (%)
Armed forces status - Civilian - Veteran (%)
Armed forces status - Civilian - Nonveteran (%)
Fatal accidents locations in years 2005-2021
Fatal accidents locations in 2005
Fatal accidents locations in 2006
Fatal accidents locations in 2007
Fatal accidents locations in 2008
Fatal accidents locations in 2009
Fatal accidents locations in 2010
Fatal accidents locations in 2011
Fatal accidents locations in 2012
Fatal accidents locations in 2013
Fatal accidents locations in 2014
Fatal accidents locations in 2015
Fatal accidents locations in 2016
Fatal accidents locations in 2017
Fatal accidents locations in 2018
Fatal accidents locations in 2019
Fatal accidents locations in 2020
Fatal accidents locations in 2021
Alcohol use - People drinking some alcohol every month (%)
Alcohol use - People not drinking at all (%)
Alcohol use - Average days/month drinking alcohol
Alcohol use - Average drinks/week
Alcohol use - Average days/year people drink much
Audiometry - Average condition of hearing (%)
Audiometry - People that can hear a whisper from across a quiet room (%)
Audiometry - People that can hear normal voice from across a quiet room (%)
Audiometry - Ears ringing, roaring, buzzing (%)
Audiometry - Had a job exposure to loud noise (%)
Audiometry - Had off-work exposure to loud noise (%)
Blood Pressure & Cholesterol - Has high blood pressure (%)
Blood Pressure & Cholesterol - Checking blood pressure at home (%)
Blood Pressure & Cholesterol - Frequently checking blood cholesterol (%)
Blood Pressure & Cholesterol - Has high cholesterol level (%)
Consumer Behavior - Money monthly spent on food at supermarket/grocery store
Consumer Behavior - Money monthly spent on food at other stores
Consumer Behavior - Money monthly spent on eating out
Consumer Behavior - Money monthly spent on carryout/delivered foods
Consumer Behavior - Income spent on food at supermarket/grocery store (%)
Consumer Behavior - Income spent on food at other stores (%)
Consumer Behavior - Income spent on eating out (%)
Consumer Behavior - Income spent on carryout/delivered foods (%)
Current Health Status - General health condition (%)
Current Health Status - Blood donors (%)
Current Health Status - Has blood ever tested for HIV virus (%)
Current Health Status - Left-handed people (%)
Dermatology - People using sunscreen (%)
Diabetes - Diabetics (%)
Diabetes - Had a blood test for high blood sugar (%)
Diabetes - People taking insulin (%)
Diet Behavior & Nutrition - Diet health (%)
Diet Behavior & Nutrition - Milk product consumption (# of products/month)
Diet Behavior & Nutrition - Meals not home prepared (#/week)
Diet Behavior & Nutrition - Meals from fast food or pizza place (#/week)
Diet Behavior & Nutrition - Ready-to-eat foods (#/month)
Diet Behavior & Nutrition - Frozen meals/pizza (#/month)
Drug Use - People that ever used marijuana or hashish (%)
Drug Use - Ever used hard drugs (%)
Drug Use - Ever used any form of cocaine (%)
Drug Use - Ever used heroin (%)
Drug Use - Ever used methamphetamine (%)
Health Insurance - People covered by health insurance (%)
Kidney Conditions-Urology - Avg. # of times urinating at night
Medical Conditions - People with asthma (%)
Medical Conditions - People with anemia (%)
Medical Conditions - People with psoriasis (%)
Medical Conditions - People with overweight (%)
Medical Conditions - Elderly people having difficulties in thinking or remembering (%)
Medical Conditions - People who ever received blood transfusion (%)
Medical Conditions - People having trouble seeing even with glass/contacts (%)
Medical Conditions - People with arthritis (%)
Medical Conditions - People with gout (%)
Medical Conditions - People with congestive heart failure (%)
Medical Conditions - People with coronary heart disease (%)
Medical Conditions - People with angina pectoris (%)
Medical Conditions - People who ever had heart attack (%)
Medical Conditions - People who ever had stroke (%)
Medical Conditions - People with emphysema (%)
Medical Conditions - People with thyroid problem (%)
Medical Conditions - People with chronic bronchitis (%)
Medical Conditions - People with any liver condition (%)
Medical Conditions - People who ever had cancer or malignancy (%)
Mental Health - People who have little interest in doing things (%)
Mental Health - People feeling down, depressed, or hopeless (%)
Mental Health - People who have trouble sleeping or sleeping too much (%)
Mental Health - People feeling tired or having little energy (%)
Mental Health - People with poor appetite or overeating (%)
Mental Health - People feeling bad about themself (%)
Mental Health - People who have trouble concentrating on things (%)
Mental Health - People moving or speaking slowly or too fast (%)
Mental Health - People having thoughts they would be better off dead (%)
Oral Health - Average years since last visit a dentist
Oral Health - People embarrassed because of mouth (%)
Oral Health - People with gum disease (%)
Oral Health - General health of teeth and gums (%)
Oral Health - Average days a week using dental floss/device
Oral Health - Average days a week using mouthwash for dental problem
Oral Health - Average number of teeth
Pesticide Use - Households using pesticides to control insects (%)
Pesticide Use - Households using pesticides to kill weeds (%)
Physical Activity - People doing vigorous-intensity work activities (%)
Physical Activity - People doing moderate-intensity work activities (%)
Physical Activity - People walking or bicycling (%)
Physical Activity - People doing vigorous-intensity recreational activities (%)
Physical Activity - People doing moderate-intensity recreational activities (%)
Physical Activity - Average hours a day doing sedentary activities
Physical Activity - Average hours a day watching TV or videos
Physical Activity - Average hours a day using computer
Physical Functioning - People having limitations keeping them from working (%)
Physical Functioning - People limited in amount of work they can do (%)
Physical Functioning - People that need special equipment to walk (%)
Physical Functioning - People experiencing confusion/memory problems (%)
Physical Functioning - People requiring special healthcare equipment (%)
Prescription Medications - Average number of prescription medicines taking
Preventive Aspirin Use - Adults 40+ taking low-dose aspirin (%)
Reproductive Health - Vaginal deliveries (%)
Reproductive Health - Cesarean deliveries (%)
Reproductive Health - Deliveries resulted in a live birth (%)
Reproductive Health - Pregnancies resulted in a delivery (%)
Reproductive Health - Women breastfeeding newborns (%)
Reproductive Health - Women that had a hysterectomy (%)
Reproductive Health - Women that had both ovaries removed (%)
Reproductive Health - Women that have ever taken birth control pills (%)
Reproductive Health - Women taking birth control pills (%)
Reproductive Health - Women that have ever used Depo-Provera or injectables (%)
Reproductive Health - Women that have ever used female hormones (%)
Sexual Behavior - People 18+ that ever had sex (vaginal, anal, or oral) (%)
Sexual Behavior - Males 18+ that ever had vaginal sex with a woman (%)
Sexual Behavior - Males 18+ that ever performed oral sex on a woman (%)
Sexual Behavior - Males 18+ that ever had anal sex with a woman (%)
Sexual Behavior - Males 18+ that ever had any sex with a man (%)
Sexual Behavior - Females 18+ that ever had vaginal sex with a man (%)
Sexual Behavior - Females 18+ that ever performed oral sex on a man (%)
Sexual Behavior - Females 18+ that ever had anal sex with a man (%)
Sexual Behavior - Females 18+ that ever had any kind of sex with a woman (%)
Sexual Behavior - Average age people first had sex
Sexual Behavior - Average number of female sex partners in lifetime (males 18+)
Sexual Behavior - Average number of female vaginal sex partners in lifetime (males 18+)
Sexual Behavior - Average age people first performed oral sex on a woman (18+)
Sexual Behavior - Average number of woman performed oral sex on in lifetime (18+)
Sexual Behavior - Average number of male sex partners in lifetime (males 18+)
Sexual Behavior - Average number of male anal sex partners in lifetime (males 18+)
Sexual Behavior - Average age people first performed oral sex on a man (18+)
Sexual Behavior - Average number of male oral sex partners in lifetime (18+)
Sexual Behavior - People using protection when performing oral sex (%)
Sexual Behavior - Average number of times people have vaginal or anal sex a year
Sexual Behavior - People having sex without condom (%)
Sexual Behavior - Average number of male sex partners in lifetime (females 18+)
Sexual Behavior - Average number of male vaginal sex partners in lifetime (females 18+)
Sexual Behavior - Average number of female sex partners in lifetime (females 18+)
Sexual Behavior - Circumcised males 18+ (%)
Sleep Disorders - Average hours sleeping at night
Sleep Disorders - People that has trouble sleeping (%)
Smoking-Cigarette Use - People smoking cigarettes (%)
Taste & Smell - People 40+ having problems with smell (%)
Taste & Smell - People 40+ having problems with taste (%)
Taste & Smell - People 40+ that ever had wisdom teeth removed (%)
Taste & Smell - People 40+ that ever had tonsils teeth removed (%)
Taste & Smell - People 40+ that ever had a loss of consciousness because of a head injury (%)
Taste & Smell - People 40+ that ever had a broken nose or other serious injury to face or skull (%)
Taste & Smell - People 40+ that ever had two or more sinus infections (%)
Weight - Average height (inches)
Weight - Average weight (pounds)
Weight - Average BMI
Weight - People that are obese (%)
Weight - People that ever were obese (%)
Weight - People trying to lose weight (%)
100%
urban population.
Estimated median house/condo value in 2022: $389,350
11415:
$389,350New York:
$400,400
According to our research of New York and other state lists, there were 8 registered sex offenders living in 11415 zip code as of April 27, 2024 . The ratio of all residents to sex offenders in zip code 11415 is 2,448 to 1.The ratio of registered sex offenders to all residents in this zip code is much lower than the state average.
Median resident age: This zip code:
42.3 yearsNew York median age:
40.0 years
Average household size: This zip code:
2.2 peopleNew York:
2.5 people
Averages for the 2020 tax year for zip code 11415, filed in 2021:
Average Adjusted Gross Income (AGI) in 2020: $70,226 (Individual Income Tax Returns) Here:
$70,226State:
$90,930
Salary/wage: $67,199 (reported on 78.7% of returns )Here:
$67,199State:
$72,104
(% of AGI for various income ranges: 956.4% for AGIs below $25k , 3487.7% for AGIs $25k-50k , 7057.2% for AGIs $50k-75k , 10892.5% for AGIs $75k-100k , 20797.1% for AGIs $100k-200k , 65030.7% for AGIs over 200k ) Taxable interest for individuals: $1,581 (reported on 32.4% of returns )This zip code:
$1,581New York:
$3,075
(% of AGI for various income ranges: 19.6% for AGIs below $25k , 28.8% for AGIs $25k-50k , 49.4% for AGIs $50k-75k , 50.9% for AGIs $75k-100k , 150.7% for AGIs $100k-200k , 1298.0% for AGIs over 200k ) Ordinary dividends: $4,447 (reported on 20.0% of returns )(% of AGI for various income ranges: 32.8% for AGIs below $25k , 38.2% for AGIs $25k-50k , 74.2% for AGIs $50k-75k , 92.9% for AGIs $75k-100k , 256.3% for AGIs $100k-200k , 2480.7% for AGIs over 200k ) Net capital gain/loss in AGI: +$11,754 (reported on 19.7% of returns )Here:
+$11,754State:
+$44,925
(% of AGI for various income ranges: 7.1% for AGIs below $25k , 34.6% for AGIs $25k-50k , 54.8% for AGIs $50k-75k , 171.6% for AGIs $75k-100k , 453.3% for AGIs $100k-200k , 10598.7% for AGIs over 200k ) Profit/loss from business: +$9,422 (reported on 20.7% of returns )Here:
+$9,422State:
+$14,940
(% of AGI for various income ranges: 326.5% for AGIs below $25k , 211.2% for AGIs $25k-50k , 142.0% for AGIs $50k-75k , 199.9% for AGIs $75k-100k , 437.9% for AGIs $100k-200k , 2396.0% for AGIs over 200k ) Taxable individual retirement arrangement distribution: $17,558 (reported on 6.2% of returns )11415:
$17,558New York:
$19,609
(% of AGI for various income ranges: 57.0% for AGIs below $25k , 73.1% for AGIs $25k-50k , 106.4% for AGIs $50k-75k , 151.2% for AGIs $75k-100k , 362.7% for AGIs $100k-200k , 2018.0% for AGIs over 200k ) Self-employed (Keogh) retirement plans: $20,500 (reported on 0.5% of returns )11415:
$20,500New York:
$32,497
(% of AGI for various income ranges: 47.4% for AGIs $75k-100k , 440.0% for AGIs over 200k ) Total itemized deductions: $28,393 (reported on 11.0% of returns )Here:
$28,393State:
$39,326
(% of AGI for various income ranges: 57.2% for AGIs below $25k , 132.5% for AGIs $25k-50k , 281.2% for AGIs $50k-75k , 529.2% for AGIs $75k-100k , 1186.5% for AGIs $100k-200k , 6483.3% for AGIs over 200k ) Charity contributions: $10,066 (reported on 8.8% of returns )Here:
$10,066State:
$15,420
(% of AGI for various income ranges: 3.3% for AGIs below $25k , 15.5% for AGIs $25k-50k , 48.9% for AGIs $50k-75k , 86.0% for AGIs $75k-100k , 257.4% for AGIs $100k-200k , 3233.3% for AGIs over 200k ) Taxes paid: $8,893 (reported on 11.0% of returns )(% of AGI for various income ranges: 12.7% for AGIs below $25k , 44.9% for AGIs $25k-50k , 109.3% for AGIs $50k-75k , 233.9% for AGIs $75k-100k , 451.7% for AGIs $100k-200k , 1080.7% for AGIs over 200k ) Earned income credit: $1,791 (reported on 12.0% of returns )(% of AGI for various income ranges: 79.6% for AGIs below $25k , 54.7% for AGIs $25k-50k ) Percentage of individuals using paid preparers for their 2020 taxes: 93.2%(% for various income ranges: 90.0% for AGIs below $25k , 93.8% for AGIs $25k-50k , 94.7% for AGIs $50k-75k , 93.2% for AGIs $75k-100k , 94.9% for AGIs $100k-200k , 97.6% for AGIs over 200k )
Averages for the 2012 tax year for zip code 11415, filed in 2013:
Average Adjusted Gross Income (AGI) in 2012: $59,551 (Individual Income Tax Returns) Here:
$59,551State:
$77,088
Salary/wage: $56,342 (reported on 80.9% of returns )Here:
$56,342State:
$60,593
(% of AGI for various income ranges: 61.7% for AGIs below $25k , 85.5% for AGIs $25k-50k , 85.7% for AGIs $50k-75k , 87.0% for AGIs $75k-100k , 82.2% for AGIs $100k-200k , 48.8% for AGIs over 200k ) Taxable interest for individuals: $1,108 (reported on 38.5% of returns )This zip code:
$1,108New York:
$3,125
(% of AGI for various income ranges: 1.4% for AGIs below $25k , 0.6% for AGIs $25k-50k , 0.5% for AGIs $50k-75k , 0.6% for AGIs $75k-100k , 0.7% for AGIs $100k-200k , 0.9% for AGIs over 200k ) Ordinary dividends: $3,757 (reported on 19.4% of returns )(% of AGI for various income ranges: 1.8% for AGIs below $25k , 0.9% for AGIs $25k-50k , 0.8% for AGIs $50k-75k , 1.0% for AGIs $75k-100k , 1.3% for AGIs $100k-200k , 1.8% for AGIs over 200k ) Net capital gain/loss in AGI: +$11,318 (reported on 16.1% of returns )Here:
+$11,318State:
+$42,474
(% of AGI for various income ranges: 0.3% for AGIs $75k-100k , 0.9% for AGIs $100k-200k , 15.5% for AGIs over 200k ) Profit/loss from business: +$12,595 (reported on 20.7% of returns )Here:
+$12,595State:
+$16,168
(% of AGI for various income ranges: 21.7% for AGIs below $25k , 5.4% for AGIs $25k-50k , 2.1% for AGIs $50k-75k , 2.3% for AGIs $75k-100k , 2.5% for AGIs $100k-200k , 3.9% for AGIs over 200k ) Taxable individual retirement arrangement distribution: $14,432 (reported on 7.2% of returns )11415:
$14,432New York:
$17,621
(% of AGI for various income ranges: 3.0% for AGIs below $25k , 1.3% for AGIs $25k-50k , 1.3% for AGIs $50k-75k , 1.0% for AGIs $75k-100k , 2.0% for AGIs $100k-200k , 2.3% for AGIs over 200k ) Self-employment retirement plans: $19,150 (reported on 0.6% of returns )11415:
$19,150New York:
$27,330
Total itemized deductions: $22,646 (22% of AGI, reported on 40.0% of returns )Here:
$22,646State:
$34,985
Here:
22.4% of AGIState:
21.3% of AGI
(% of AGI for various income ranges: 9.5% for AGIs below $25k , 11.2% for AGIs $25k-50k , 14.4% for AGIs $50k-75k , 16.3% for AGIs $75k-100k , 17.8% for AGIs $100k-200k , 16.8% for AGIs over 200k ) Charity contributions: $3,687 (reported on 33.1% of returns )(% of AGI for various income ranges: 0.7% for AGIs below $25k , 1.1% for AGIs $25k-50k , 1.6% for AGIs $50k-75k , 1.6% for AGIs $75k-100k , 2.0% for AGIs $100k-200k , 4.3% for AGIs over 200k ) Taxes paid: $10,521 (reported on 40.0% of returns )11415:
$10,521State:
$18,656
(% of AGI for various income ranges: 2.0% for AGIs below $25k , 3.3% for AGIs $25k-50k , 5.8% for AGIs $50k-75k , 7.9% for AGIs $75k-100k , 9.2% for AGIs $100k-200k , 9.5% for AGIs over 200k ) Earned income credit: $1,958 (reported on 16.1% of returns )(% of AGI for various income ranges: 6.1% for AGIs below $25k , 0.8% for AGIs $25k-50k ) Percentage of individuals using paid preparers for their 2012 taxes: 68.4%(% for various income ranges: 67.8% for AGIs below $25k , 66.4% for AGIs $25k-50k , 67.6% for AGIs $50k-75k , 70.2% for AGIs $75k-100k , 72.1% for AGIs $100k-200k , 75.0% for AGIs over 200k )
Averages for the 2004 tax year for zip code 11415, filed in 2005:
Average Adjusted Gross Income (AGI) in 2004: $46,005 (Individual Income Tax Returns) Here:
$46,005State:
$59,519
Salary/wage: $45,304 (reported on 81.1% of returns )Here:
$45,304State:
$50,673
(% of AGI for various income ranges: 88.4% for AGIs below $10k , 70.0% for AGIs $10k-25k , 89.3% for AGIs $25k-50k , 88.0% for AGIs $50k-75k , 86.1% for AGIs $75k-100k , 65.7% for AGIs over 100k ) Taxable interest for individuals: $1,569 (reported on 51.8% of returns )This zip code:
$1,569New York:
$2,377
(% of AGI for various income ranges: 9.2% for AGIs below $10k , 3.1% for AGIs $10k-25k , 1.3% for AGIs $25k-50k , 1.3% for AGIs $50k-75k , 1.2% for AGIs $75k-100k , 2.1% for AGIs over 100k ) Taxable dividends: $2,821 (reported on 23.2% of returns )(% of AGI for various income ranges: 6.6% for AGIs below $10k , 1.8% for AGIs $10k-25k , 0.7% for AGIs $25k-50k , 1.1% for AGIs $50k-75k , 1.0% for AGIs $75k-100k , 2.1% for AGIs over 100k ) Net capital gain/loss: +$8,102 (reported on 19.4% of returns )Here:
+$8,102State:
+$23,581
(% of AGI for various income ranges: -2.8% for AGIs below $10k , -0.7% for AGIs $10k-25k , -0.1% for AGIs $25k-50k , 0.3% for AGIs $50k-75k , 0.8% for AGIs $75k-100k , 11.1% for AGIs over 100k ) Profit/loss from business: +$9,963 (reported on 20.1% of returns )Here:
+$9,963State:
+$13,809
(% of AGI for various income ranges: 41.4% for AGIs below $10k , 16.4% for AGIs $10k-25k , 3.5% for AGIs $25k-50k , 1.5% for AGIs $50k-75k , 2.2% for AGIs $75k-100k , 3.4% for AGIs over 100k ) IRA payment deduction: $3,381 (reported on 4.5% of returns )11415:
$3,381New York:
$3,115
(% of AGI for various income ranges: 0.5% for AGIs $10k-25k , 0.5% for AGIs $25k-50k , 0.3% for AGIs $50k-75k , 0.2% for AGIs $75k-100k , 0.2% for AGIs over 100k ) Self-employed pension: $12,455 (reported on 0.9% of returns )Here:
$12,455New York:
$19,016
Total itemized deductions: $18,255 (24% of AGI, reported on 40.8% of returns )Here:
$18,255State:
$25,864
Here:
24.0% of AGIState:
21.9% of AGI
(% of AGI for various income ranges: 8.7% for AGIs below $10k , 10.5% for AGIs $10k-25k , 14.3% for AGIs $25k-50k , 16.2% for AGIs $50k-75k , 17.8% for AGIs $75k-100k , 18.7% for AGIs over 100k ) Charity contributions deductions: $3,553 (5% of AGI, reported on 37.0% of returns )Here:
4.5% of AGIState:
3.6% of AGI
(% of AGI for various income ranges: 0.4% for AGIs below $10k , 1.2% for AGIs $10k-25k , 2.1% for AGIs $25k-50k , 2.3% for AGIs $50k-75k , 2.5% for AGIs $75k-100k , 4.5% for AGIs over 100k ) Total tax: $6,655 (reported on 81.6% of returns )11415:
$6,655State:
$11,730
(% of AGI for various income ranges: 7.3% for AGIs below $10k , 5.5% for AGIs $10k-25k , 7.7% for AGIs $25k-50k , 10.8% for AGIs $50k-75k , 12.5% for AGIs $75k-100k , 17.1% for AGIs over 100k ) Earned income credit: $1,534 (reported on 14.4% of returns )Percentage of individuals using paid preparers for their 2004 taxes: 67.6%(% for various income ranges: 63.6% for AGIs below $10k , 69.1% for AGIs $10k-25k , 68.5% for AGIs $25k-50k , 66.3% for AGIs $50k-75k , 67.3% for AGIs $75k-100k , 73.1% for AGIs over 100k )
Estimated median household income in 2022: This zip code:
$86,321New York:
$79,557
Nearest zip codes: 11424 ,
11418 ,
11435 ,
11419 ,
11375 ,
11367 .
New York Zip Code Map
Percentage of family households: This zip code:
37.5%New York:
41.3%
Percentage of households with unmarried partners: This zip code:
6.3%New York:
42.3%
Likely homosexual households (counted as self-reported same-sex unmarried-partner households)
Lesbian couples: 0.0% of all households Gay men: 0.4% of all households
Household received Food Stamps/SNAP in the past 12 months: 954Household did not receive Food Stamps/SNAP in the past 12 months: 7,769
Women who had a birth in the past 12 months: 329 (249 now married , 79 unmarried) Women who did not have a birth in the past 12 months: 4,274 (1,752 now married , 2,512 unmarried)
Housing units in zip code 11415 with a mortgage: 2,028 (118
second mortgage , 87
both second mortgage and home equity loan )
Median monthly owner costs for units with a mortgage: $1,788
Median monthly owner costs for units without a mortgage: $955
Residents with income below the poverty level in 2022:
This zip code:
8.4%Whole state:
14.3%
Residents with income below 50% of the poverty level in 2022:
This zip code:
4.7%Whole state:
6.8%
Median number of rooms in houses and condos: Median number of rooms in apartments:
Year house built (houses)
0 2020 or later146 2010 to 2019252 2000 to 2009150 1990 to 1999309 1980 to 1989748 1970 to 19791,330 1960 to 19691,516 1950 to 19591,418 1940 to 19493,577 1939 or earlier
Zip code 11415 household income distribution in 2022 344 Less than $10,000389 $10,000 to $14,999194 $15,000 to $19,999416 $20,000 to $24,999168 $25,000 to $29,999204 $30,000 to $34,999118 $35,000 to $39,999167 $40,000 to $44,999321 $45,000 to $49,999511 $50,000 to $59,999868 $60,000 to $74,9991,028 $75,000 to $99,999985 $100,000 to $124,999732 $125,000 to $149,999866 $150,000 to $199,9991,399 $200,000 or moreEstimate of home value of owner-occupied houses/condos in 2022 in zip code 11415 16 $80,000 to $89,99933 $90,000 to $99,99918 $100,000 to $124,99921 $125,000 to $149,99970 $150,000 to $174,999200 $175,000 to $199,999476 $200,000 to $249,999439 $250,000 to $299,999732 $300,000 to $399,999421 $400,000 to $499,999433 $500,000 to $749,999325 $750,000 to $999,999213 $1,000,000 to $1,499,999155 $1,500,000 to $1,999,999142 $2,000,000 or moreRent paid by renters in 2022 in zip code 11415 8 $300 to $34915 $350 to $39919 $500 to $5498 $600 to $64920 $650 to $69916 $750 to $799126 $800 to $89990 $900 to $999261 $1,000 to $1,249653 $1,250 to $1,4992,392 $1,500 to $1,999905 $2,000 to $2,499282 $2,500 to $2,999102 $3,000 to $3,49978 $3,500 or more107 No cash rent
Median gross rent in 2022: $1,853.
Median price asked for vacant for-sale houses and condos in 2022: $526,065.
Estimated median house (or condo) value in 2022 for: White Non-Hispanic householders: $635,604Black or African American householders: $130,452Asian householders: $470,632Some other race householders: $394,166Two or more races householders: $561,948Hispanic or Latino householders: $393,966Estimated median house or condo value in 2022: $389,350
11415:
$389,350New York:
$400,400
Lower value quartile - upper value quartile: $270,686 - $695,294
Mean price in 2022: Detached houses: $1,438,503Here:
$1,438,503State:
$476,719
Townhouses or other attached units: $784,570Here:
$784,570State:
$699,270
In 2-unit structures: $475,293Here:
$475,293State:
$713,077
In 3-to-4-unit structures: $1,623,468Here:
$1,623,468State:
$764,568
In 5-or-more-unit structures: $270,974Here:
$270,974State:
$912,009
Housing units in structures:
One, detached: 849One, attached: 356Two: 3793 or 4: 4685 to 9: 3910 to 19: 34420 to 49: 2,16650 or more: 5,087Mobile homes: 16Unemployment : 4.7%
Means of transportation to work in zip code 11415 25.8% 2,737 Drove a car alone3.5% 368 Carpooled7.7% 815 Bus or trolley bus31.4% 3,328 Streetcar or trolley car3.8% 401 Subway or elevated2.3% 249 Taxi0.5% 49 Bicycle4.2% 441 Walked3.8% 398 Other means16.5% 1,753 Worked at homeTravel time to work (commute) in zip code 11415 60 Less than 5 minutes211 5 to 9 minutes443 10 to 14 minutes403 15 to 19 minutes803 20 to 24 minutes206 25 to 29 minutes1,895 30 to 34 minutes281 35 to 39 minutes590 40 to 44 minutes1,628 45 to 59 minutes1,690 60 to 89 minutes690 90 or more minutes
Percentage of zip code residents living and working in this county: 51.9%
Household type by relationship:
Households: 19,992
Male householders: 4,269 (1,426 living alone ), Female householders: 4,508 (1,917 living alone )3,338 spouses (3,261 opposite-sex spouses ), 782 unmarried partners , (703 opposite-sex unmarried partners ), 4,675 children (4,511 natural , 65 adopted , 101 stepchildren ), 126 grandchildren , 386 brothers or sisters , 789 parents , 0 foster children , 430 other relatives , 531 non-relatives In group quarters: 190 (-1 institutionalized population )
Size of family households: 2,095 2-persons , 1,157 3-persons , 965 4-persons , 172 5-persons , 36 6-persons , 172 7-or-more-persons
Size of nonfamily households: 3,342 1-person , 753 2-persons , 115 3-persons , 13 4-persons , 9 5-persons
2,691 married couples with children. single-parent households (242 men , 356 women ).
49.1% of residents of 11415 zip code speak English at home. of residents speak Spanish at home (59% very well, 28% well, 8% not well, 5% not at all ).of residents speak other Indo-European language at home (59% very well, 22% well, 10% not well, 9% not at all ).of residents speak Asian or Pacific Island language at home (71% very well, 18% well, 6% not well, 4% not at all ).of residents speak other language at home (82% very well, 12% well, 3% not well, 3% not at all ).
Foreign born population: 7,856 (39.3%)
(70.1%
of them are naturalized citizens )
This zip code:
39.3%Whole state:
22.7%
10% Ecuador 9% Chile 9% Bhutan 5% Romania 5% Nepal 4% Malaysia 3% Colombia 4% Russian 3% American 3% Italian 3% Polish 3% Irish 2% Eastern European 1% German
Year of entry for the foreign-born population
1,638 2010 or later 1,633 2000 to 2009 2,390 1990 to 1999 2,388 Before 1990
Public elementary/middle school in in zip code 11415 not listed on the city page:
Private elementary/middle schools in in this zip code not listed on the city page:
Facilities with environmental interests located in this zip code:
J CHATILLON & SONS-83-30 KEW GARDENS RD (83-30 KEW GARDENS ROAD in KEW GARDENS, NY)
AIR MINOR (AIRS/AFS) STATE MASTER (New York facility tracking) - AIR PROGRAM, HAZARDOUS WASTE PROGRAM Small Quantity Generators, between 100 kg and 1000 kg of hazardous waste/month (Resource Conservation and Recovery Act (tracking hazardous waste)) Business SIC classification: COATING, ENGRAVING, AND ALLIED SERVICESOrganizations: JOHN CHATILLON & SONS INC (LEGALLY RESPONSIBLE PARTY)
Alternative names: JOHN CHATILLION & SONS INCORPORATED, JOHN CHATILLON & SONS INC
125-10 QUEENS BLVD BUILDING (125-10 QUEENS BLVD in QUEENS, NY)
AIR SYNTHETIC MINOR (AIRS/AFS) STATE MASTER (New York facility tracking) - AIR PROGRAM Business SIC classification: OPERATORS OF APARTMENT BUILDINGSBusiness NAICS classification: LESSORS OF RESIDENTIAL BUILDINGS AND DWELLINGS.Organizations: SILVER TOWERS OWNERS CORP (LEGALLY RESPONSIBLE PARTY)
Alternative names: SILVER TOWER COMPANY
CON EDISON - VS 3861 (45-25 KISSENA BLVD in KEW GARDENS, NY)
Large Quantity Generators, more that 1000 kg of hazardous waste/month (Resource Conservation and Recovery Act (tracking hazardous waste)) Organizations: CONSOLIDATED EDISON COMPANY OF NY, INC. (CONTACT/OPERATOR)
CON EDISON (METORPOLITAN AVE & 125TH ST in KEW GARDENS, NY)
(Resource Conservation and Recovery Act (tracking hazardous waste))
Housing units lacking complete plumbing facilities: 0.5%
Housing units lacking complete kitchen facilities: 1.1%
71.9% Utility gas 12.0% Fuel oil, kerosene, etc. 10.0% Electricity 2.3% Bottled, tank, or LP gas 2.2% Other fuel 1.6% No fuel used
Population in 1990: 16,703. Population change in the 1990s: +4,253 (+25.5%).
Place of birth for U.S.-born residents:
This state: 10,050Northeast: 703Midwest: 377South: 451West: 244
62% of the 11415 zip code residents lived in the same house 5 years ago.
Out of people who lived in different houses, 58% lived in this county.
Out of people who lived in different counties, 50% lived in New York.
88% of the 11415 zip code residents lived in the same house 1 year ago.
Out of people who lived in different houses, 55% moved from this county.
Out of people who lived in different houses, 31% moved from different county within same state.
Out of people who lived in different houses, 4% moved from different state.
Out of people who lived in different houses, 10% moved from abroad.
Private vs. public school enrollment:
Students in private schools in grades 1 to 8 (elementary and middle school): 301
Students in private schools in grades 9 to 12 (high school): 211
Students in private undergraduate colleges: 300
Occupation by median earnings in the past 12 months ($)
92,089 Legal occupations 91,738 Life, physical, and social science occupations 91,600 Computer and mathematical occupations 84,801 Business and financial operations occupations 84,087 Law enforcement workers including supervisors 83,114 Health diagnosing and treating practitioners and other technical occupations
Top industries in this zip code by the number of employees in 2005:
Health Care and Social Assistance: Home Health Care Services (250-499 employees: 2 establishments, 100-249 employees: 1 establishment)Professional, Scientific, and Technical Services: Offices of Lawyers (100-249: 1, 20-49: 1, 10-19: 1, 5-9: 5, 1-4: 42)Educational Services: Elementary and Secondary Schools (100-249: 1, 50-99: 1)Professional, Scientific, and Technical Services: Research and Development in the Physical, Engineering, and Life Sciences (100-249: 1)Construction: Electrical Contractors (100-249: 1)Health Care and Social Assistance: Offices of Physicians (except Mental Health Specialists) (50-99: 1, 10-19: 2, 5-9: 2, 1-4: 8)Accommodation and Food Services: Limited-Service Restaurants (20-49: 2, 10-19: 1, 1-4: 7)Arts, Entertainment, and Recreation: Fitness and Recreational Sports Centers (50-99: 1, 5-9: 1, 1-4: 2)Real Estate and Rental and Leasing: Lessors of Residential Buildings and Dwellings (10-19: 1, 5-9: 1, 1-4: 28)
People in group quarters in 2010:
19 people in group homes intended for adults
10 people in residential treatment centers for adults
People in group quarters in 2000:
467 people in local jails and other confinement facilities (including police lockups)
125 people in nursing homes
25 people in homes for the mentally retarded
Fatal accident statistics in 2012:
Fatal accident count: 2Vehicles involved in fatal accidents: 2Fatal accidents caused by drunken drivers: 0Fatalities: 2Persons involved in fatal accidents: 2Pedestrians involved in fatal accidents: 2
Fatal accident statistics in 2010:
Fatal accident count: 1Vehicles involved in fatal accidents: 1Fatal accidents caused by drunken drivers: 0Fatalities: 1Persons involved in fatal accidents: 1Pedestrians involved in fatal accidents: 1
Home Mortgage Disclosure Act Aggregated Statistics For Year 2009(Based on 3 full and 10 partial tracts) A) FHA, FSA/RHS & VA B) Conventional C) Refinancings D) Home Improvement Loans E) Loans on Dwellings For 5+ Families F) Non-occupant Loans on Number Average Value Number Average Value Number Average Value Number Average Value Number Average Value Number Average Value
LOANS ORIGINATED 7 $451,154 163 $206,800 178 $230,057 13 $149,430 8 $4,051,268 9 $170,691 APPLICATIONS APPROVED, NOT ACCEPTED 0 $0 26 $253,005 35 $210,635 2 $16,730 0 $0 0 $0 APPLICATIONS DENIED 1 $353,000 72 $225,448 124 $262,579 20 $72,052 0 $0 15 $222,305 APPLICATIONS WITHDRAWN 0 $0 20 $215,507 53 $276,449 3 $462,580 0 $0 1 $333,340 FILES CLOSED FOR INCOMPLETENESS 0 $0 14 $305,566 37 $255,322 3 $347,320 2 $1,676,880 1 $362,580
Aggregated Statistics For Year 2008(Based on 3 full and 10 partial tracts) A) FHA, FSA/RHS & VA B) Conventional C) Refinancings D) Home Improvement Loans E) Loans on Dwellings For 5+ Families F) Non-occupant Loans on G) Loans On Manufactured Number Average Value Number Average Value Number Average Value Number Average Value Number Average Value Number Average Value Number Average Value
LOANS ORIGINATED 2 $482,350 264 $212,820 118 $220,666 16 $96,384 2 $868,130 17 $242,498 0 $0 APPLICATIONS APPROVED, NOT ACCEPTED 0 $0 44 $298,480 40 $391,066 6 $71,682 0 $0 4 $286,782 0 $0 APPLICATIONS DENIED 3 $380,913 100 $249,764 91 $327,612 23 $37,367 0 $0 8 $159,549 1 $40,000 APPLICATIONS WITHDRAWN 0 $0 41 $164,605 37 $311,238 1 $722,500 0 $0 3 $230,237 0 $0 FILES CLOSED FOR INCOMPLETENESS 0 $0 18 $189,248 22 $285,398 1 $288,750 0 $0 0 $0 0 $0
Aggregated Statistics For Year 2007(Based on 3 full and 10 partial tracts) B) Conventional C) Refinancings D) Home Improvement Loans E) Loans on Dwellings For 5+ Families F) Non-occupant Loans on Number Average Value Number Average Value Number Average Value Number Average Value Number Average Value
LOANS ORIGINATED 403 $224,378 136 $269,931 38 $124,813 7 $2,931,840 24 $308,030 APPLICATIONS APPROVED, NOT ACCEPTED 86 $245,137 43 $334,554 13 $144,180 2 $1,195,235 7 $286,377 APPLICATIONS DENIED 119 $228,455 145 $371,630 29 $136,829 0 $0 17 $262,869 APPLICATIONS WITHDRAWN 37 $283,500 39 $288,746 10 $142,431 0 $0 7 $284,040 FILES CLOSED FOR INCOMPLETENESS 19 $424,243 17 $358,661 1 $57,800 0 $0 2 $494,055
Aggregated Statistics For Year 2006(Based on 3 full and 10 partial tracts) B) Conventional C) Refinancings D) Home Improvement Loans E) Loans on Dwellings For 5+ Families F) Non-occupant Loans on G) Loans On Manufactured Number Average Value Number Average Value Number Average Value Number Average Value Number Average Value Number Average Value
LOANS ORIGINATED 435 $232,305 200 $283,618 47 $159,456 9 $1,697,902 43 $279,966 1 $43,130 APPLICATIONS APPROVED, NOT ACCEPTED 104 $251,735 75 $360,146 17 $182,594 2 $11,261,695 13 $192,819 0 $0 APPLICATIONS DENIED 190 $295,860 192 $332,942 36 $214,766 1 $4,386,000 26 $338,828 0 $0 APPLICATIONS WITHDRAWN 69 $348,017 84 $338,394 14 $136,668 0 $0 14 $281,911 0 $0 FILES CLOSED FOR INCOMPLETENESS 15 $240,403 30 $305,705 2 $21,080 0 $0 3 $264,313 2 $161,635
Aggregated Statistics For Year 2005(Based on 3 full and 10 partial tracts) B) Conventional C) Refinancings D) Home Improvement Loans E) Loans on Dwellings For 5+ Families F) Non-occupant Loans on Number Average Value Number Average Value Number Average Value Number Average Value Number Average Value
LOANS ORIGINATED 544 $208,467 231 $248,030 49 $128,252 2 $382,750 47 $310,733 APPLICATIONS APPROVED, NOT ACCEPTED 112 $261,231 46 $332,244 12 $90,123 0 $0 18 $356,663 APPLICATIONS DENIED 198 $234,573 135 $328,500 39 $151,318 0 $0 26 $256,758 APPLICATIONS WITHDRAWN 83 $234,038 86 $249,878 2 $245,850 0 $0 16 $348,312 FILES CLOSED FOR INCOMPLETENESS 47 $197,196 67 $350,123 0 $0 0 $0 4 $247,450
Aggregated Statistics For Year 2004(Based on 3 full and 10 partial tracts) A) FHA, FSA/RHS & VA B) Conventional C) Refinancings D) Home Improvement Loans E) Loans on Dwellings For 5+ Families F) Non-occupant Loans on G) Loans On Manufactured Number Average Value Number Average Value Number Average Value Number Average Value Number Average Value Number Average Value Number Average Value
LOANS ORIGINATED 1 $473,960 527 $169,288 296 $196,100 31 $122,229 17 $2,178,513 36 $327,266 0 $0 APPLICATIONS APPROVED, NOT ACCEPTED 0 $0 91 $196,921 54 $275,827 11 $124,732 0 $0 3 $274,963 1 $76,590 APPLICATIONS DENIED 1 $458,070 155 $212,310 148 $238,978 24 $119,931 0 $0 28 $179,307 3 $73,563 APPLICATIONS WITHDRAWN 0 $0 57 $219,635 93 $305,981 14 $146,360 2 $1,475,425 6 $322,228 0 $0 FILES CLOSED FOR INCOMPLETENESS 0 $0 15 $317,442 37 $231,476 4 $110,258 0 $0 2 $144,765 0 $0
Aggregated Statistics For Year 2003(Based on 3 full and 10 partial tracts) A) FHA, FSA/RHS & VA B) Conventional C) Refinancings D) Home Improvement Loans E) Loans on Dwellings For 5+ Families F) Non-occupant Loans on Number Average Value Number Average Value Number Average Value Number Average Value Number Average Value Number Average Value
LOANS ORIGINATED 5 $263,016 447 $166,373 509 $186,286 9 $38,704 3 $573,343 41 $218,554 APPLICATIONS APPROVED, NOT ACCEPTED 0 $0 80 $236,893 104 $197,233 9 $53,970 1 $1,827,500 8 $211,285 APPLICATIONS DENIED 0 $0 76 $205,767 186 $189,477 18 $125,793 0 $0 15 $150,947 APPLICATIONS WITHDRAWN 4 $340,652 54 $214,629 104 $265,187 10 $40,549 1 $939,250 9 $248,641 FILES CLOSED FOR INCOMPLETENESS 0 $0 25 $193,780 36 $218,349 2 $100,350 0 $0 0 $0
Aggregated Statistics For Year 2002(Based on 3 full and 8 partial tracts) A) FHA, FSA/RHS & VA B) Conventional C) Refinancings D) Home Improvement Loans E) Loans on Dwellings For 5+ Families F) Non-occupant Loans on Number Average Value Number Average Value Number Average Value Number Average Value Number Average Value Number Average Value
LOANS ORIGINATED 7 $261,546 334 $126,772 249 $179,454 19 $26,714 9 $1,251,217 42 $159,145 APPLICATIONS APPROVED, NOT ACCEPTED 0 $0 41 $169,587 81 $215,201 2 $23,585 0 $0 2 $337,240 APPLICATIONS DENIED 0 $0 99 $137,428 129 $187,222 29 $37,472 0 $0 21 $138,623 APPLICATIONS WITHDRAWN 6 $243,875 42 $176,614 87 $213,941 16 $51,471 3 $5,210,500 15 $225,631 FILES CLOSED FOR INCOMPLETENESS 0 $0 16 $205,673 31 $170,474 1 $32,160 1 $2,266,100 0 $0
Aggregated Statistics For Year 2001(Based on 3 full and 8 partial tracts) A) FHA, FSA/RHS & VA B) Conventional C) Refinancings D) Home Improvement Loans E) Loans on Dwellings For 5+ Families F) Non-occupant Loans on Number Average Value Number Average Value Number Average Value Number Average Value Number Average Value Number Average Value
LOANS ORIGINATED 7 $262,850 310 $144,208 125 $158,666 18 $77,203 8 $3,019,380 21 $203,641 APPLICATIONS APPROVED, NOT ACCEPTED 2 $199,255 43 $175,906 38 $161,192 4 $73,408 0 $0 7 $212,490 APPLICATIONS DENIED 1 $433,500 89 $136,057 78 $134,492 22 $52,762 1 $2,010,250 12 $183,233 APPLICATIONS WITHDRAWN 5 $218,456 37 $200,654 74 $162,131 6 $39,017 0 $0 8 $168,761 FILES CLOSED FOR INCOMPLETENESS 0 $0 16 $79,534 22 $180,487 4 $74,500 0 $0 3 $70,197
Aggregated Statistics For Year 2000(Based on 3 full and 8 partial tracts) A) FHA, FSA/RHS & VA B) Conventional C) Refinancings D) Home Improvement Loans E) Loans on Dwellings For 5+ Families F) Non-occupant Loans on Number Average Value Number Average Value Number Average Value Number Average Value Number Average Value Number Average Value
LOANS ORIGINATED 4 $176,472 264 $115,333 55 $140,540 22 $22,758 13 $2,108,858 17 $172,890 APPLICATIONS APPROVED, NOT ACCEPTED 0 $0 20 $126,227 15 $114,006 16 $44,419 0 $0 4 $174,100 APPLICATIONS DENIED 0 $0 64 $100,374 56 $109,491 21 $37,249 2 $956,810 2 $87,680 APPLICATIONS WITHDRAWN 0 $0 18 $134,648 89 $113,338 14 $24,316 1 $804,100 3 $200,153 FILES CLOSED FOR INCOMPLETENESS 0 $0 15 $154,411 11 $171,319 3 $23,527 0 $0 0 $0
Aggregated Statistics For Year 1999(Based on 2 full and 7 partial tracts) A) FHA, FSA/RHS & VA B) Conventional C) Refinancings D) Home Improvement Loans E) Loans on Dwellings For 5+ Families F) Non-occupant Loans on Number Average Value Number Average Value Number Average Value Number Average Value Number Average Value Number Average Value
LOANS ORIGINATED 7 $216,420 119 $124,525 66 $132,628 14 $13,104 5 $596,680 13 $134,469 APPLICATIONS APPROVED, NOT ACCEPTED 0 $0 14 $167,184 30 $170,104 6 $48,697 0 $0 1 $372,460 APPLICATIONS DENIED 2 $163,340 42 $132,884 47 $107,483 13 $39,634 0 $0 5 $282,644 APPLICATIONS WITHDRAWN 2 $213,455 12 $132,979 33 $147,835 6 $60,273 3 $2,041,307 0 $0 FILES CLOSED FOR INCOMPLETENESS 0 $0 6 $176,073 18 $191,110 2 $74,930 0 $0 1 $103,010
Private Mortgage Insurance Companies Aggregated Statistics For Year 2009(Based on 8 partial tracts) A) Conventional B) Refinancings Number Average Value Number Average Value
LOANS ORIGINATED 24 $242,816 0 $0 APPLICATIONS APPROVED, NOT ACCEPTED 2 $530,340 3 $522,160 APPLICATIONS DENIED 3 $315,880 0 $0 APPLICATIONS WITHDRAWN 0 $0 0 $0 FILES CLOSED FOR INCOMPLETENESS 0 $0 0 $0
Aggregated Statistics For Year 2008(Based on 3 full and 10 partial tracts) A) Conventional B) Refinancings Number Average Value Number Average Value
LOANS ORIGINATED 48 $244,679 12 $262,139 APPLICATIONS APPROVED, NOT ACCEPTED 20 $246,803 2 $414,075 APPLICATIONS DENIED 2 $351,575 1 $101,610 APPLICATIONS WITHDRAWN 0 $0 3 $401,710 FILES CLOSED FOR INCOMPLETENESS 0 $0 0 $0
Aggregated Statistics For Year 2007(Based on 3 full and 10 partial tracts) A) Conventional B) Refinancings C) Non-occupant Loans on D) Loans On Manufactured Number Average Value Number Average Value Number Average Value Number Average Value
LOANS ORIGINATED 60 $187,808 3 $229,890 0 $0 1 $169,070 APPLICATIONS APPROVED, NOT ACCEPTED 11 $214,450 2 $353,260 0 $0 0 $0 APPLICATIONS DENIED 3 $286,460 0 $0 0 $0 0 $0 APPLICATIONS WITHDRAWN 5 $332,972 2 $351,575 2 $494,055 0 $0 FILES CLOSED FOR INCOMPLETENESS 2 $406,395 0 $0 0 $0 0 $0
Aggregated Statistics For Year 2006(Based on 3 full and 10 partial tracts) A) Conventional B) Refinancings C) Non-occupant Loans on Number Average Value Number Average Value Number Average Value
LOANS ORIGINATED 41 $163,752 5 $359,112 0 $0 APPLICATIONS APPROVED, NOT ACCEPTED 23 $174,803 0 $0 2 $126,755 APPLICATIONS DENIED 2 $113,820 2 $405,785 0 $0 APPLICATIONS WITHDRAWN 2 $221,495 0 $0 0 $0 FILES CLOSED FOR INCOMPLETENESS 0 $0 0 $0 0 $0
Aggregated Statistics For Year 2005(Based on 3 full and 10 partial tracts) A) Conventional B) Refinancings C) Non-occupant Loans on Number Average Value Number Average Value Number Average Value
LOANS ORIGINATED 73 $166,588 3 $310,507 3 $335,150 APPLICATIONS APPROVED, NOT ACCEPTED 21 $221,527 1 $105,260 0 $0 APPLICATIONS DENIED 1 $117,690 1 $261,550 1 $117,690 APPLICATIONS WITHDRAWN 7 $196,451 0 $0 0 $0 FILES CLOSED FOR INCOMPLETENESS 3 $330,010 0 $0 0 $0
Aggregated Statistics For Year 2004(Based on 3 full and 10 partial tracts) A) Conventional B) Refinancings C) Non-occupant Loans on Number Average Value Number Average Value Number Average Value
LOANS ORIGINATED 68 $221,125 1 $74,560 0 $0 APPLICATIONS APPROVED, NOT ACCEPTED 30 $191,849 4 $252,025 1 $231,000 APPLICATIONS DENIED 9 $279,874 1 $120,000 0 $0 APPLICATIONS WITHDRAWN 4 $263,138 2 $451,420 0 $0 FILES CLOSED FOR INCOMPLETENESS 0 $0 1 $617,010 0 $0
Aggregated Statistics For Year 2003(Based on 3 full and 10 partial tracts) A) Conventional B) Refinancings C) Non-occupant Loans on Number Average Value Number Average Value Number Average Value
LOANS ORIGINATED 59 $179,254 8 $295,386 1 $186,410 APPLICATIONS APPROVED, NOT ACCEPTED 21 $222,873 3 $113,850 0 $0 APPLICATIONS DENIED 2 $114,420 0 $0 0 $0 APPLICATIONS WITHDRAWN 10 $266,267 4 $266,652 0 $0 FILES CLOSED FOR INCOMPLETENESS 0 $0 0 $0 0 $0
Aggregated Statistics For Year 2002(Based on 3 full and 8 partial tracts) A) Conventional B) Refinancings C) Non-occupant Loans on Number Average Value Number Average Value Number Average Value
LOANS ORIGINATED 53 $175,069 4 $162,155 1 $82,600 APPLICATIONS APPROVED, NOT ACCEPTED 33 $181,688 4 $229,028 0 $0 APPLICATIONS DENIED 2 $202,995 0 $0 0 $0 APPLICATIONS WITHDRAWN 5 $138,154 0 $0 0 $0 FILES CLOSED FOR INCOMPLETENESS 0 $0 0 $0 0 $0
Aggregated Statistics For Year 2001(Based on 3 full and 8 partial tracts) A) Conventional B) Refinancings C) Non-occupant Loans on Number Average Value Number Average Value Number Average Value
LOANS ORIGINATED 61 $154,222 4 $144,482 0 $0 APPLICATIONS APPROVED, NOT ACCEPTED 17 $173,991 5 $197,474 2 $217,520 APPLICATIONS DENIED 3 $429,980 0 $0 2 $379,395 APPLICATIONS WITHDRAWN 1 $62,140 0 $0 0 $0 FILES CLOSED FOR INCOMPLETENESS 0 $0 0 $0 0 $0
Aggregated Statistics For Year 2000(Based on 3 full and 8 partial tracts) A) Conventional B) Refinancings Number Average Value Number Average Value
LOANS ORIGINATED 59 $155,630 10 $125,210 APPLICATIONS APPROVED, NOT ACCEPTED 8 $112,165 3 $142,093 APPLICATIONS DENIED 2 $307,070 1 $270,220 APPLICATIONS WITHDRAWN 2 $201,225 0 $0 FILES CLOSED FOR INCOMPLETENESS 0 $0 0 $0
Aggregated Statistics For Year 1999(Based on 2 full and 6 partial tracts) A) Conventional B) Refinancings Number Average Value Number Average Value
LOANS ORIGINATED 40 $162,729 4 $192,342 APPLICATIONS APPROVED, NOT ACCEPTED 5 $50,240 2 $117,995 APPLICATIONS DENIED 2 $141,040 0 $0 APPLICATIONS WITHDRAWN 0 $0 0 $0 FILES CLOSED FOR INCOMPLETENESS 0 $0 0 $0
2007 - 2018 National Fire Incident Reporting System (NFIRS) incidents See full 2006 National Fire Incident Reporting System statistics for zip code 11415, New York
Most common first names in zip code 11415 among deceased individuals Name Count Lived (average)
John 134 75.6 years Joseph 119 75.3 years Mary 96 80.5 years Rose 90 81.8 years Anna 89 80.4 years William 82 75.5 years Helen 71 81.2 years Margaret 64 79.6 years Louis 60 76.9 years Charles 60 76.4 years
Most common last names in zip code 11415 among deceased individuals Last name Count Lived (average)
Cohen 23 80.1 years Miller 18 79.9 years Levine 16 76.9 years Smith 16 75.2 years Klein 15 80.9 years Schwartz 15 80.2 years Meyer 14 81.1 years Levy 14 80.8 years Weiss 14 83.2 years Stern 14 82.6 years
Businesses in zip code 11415
Name Count Name Count
7-Eleven 1 McDonald's 1 Bally Total Fitness 1 Starbucks 1 CVS 1 Subway 1 Dunkin Donuts 2 Toys"R"Us 1 FedEx 2 UPS 3

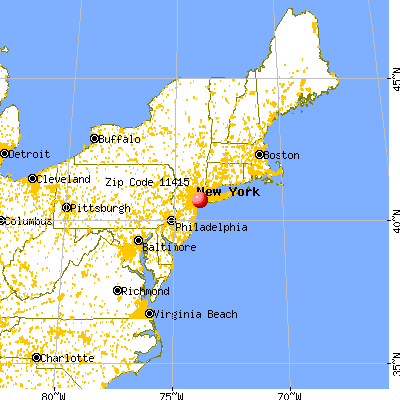


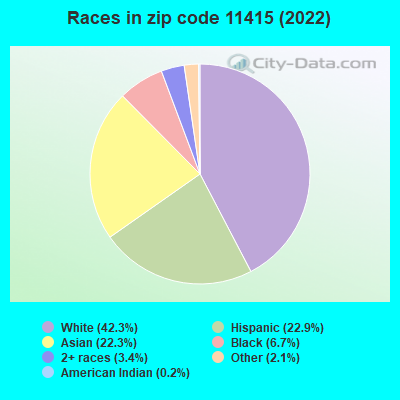


 Nearest zip codes: 11424, 11418, 11435, 11419, 11375, 11367.
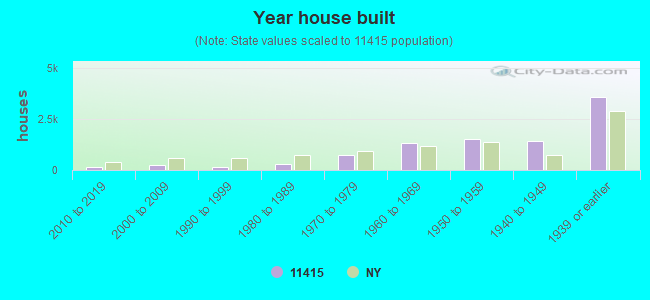

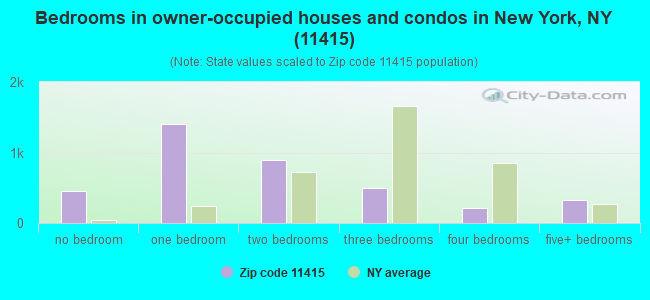
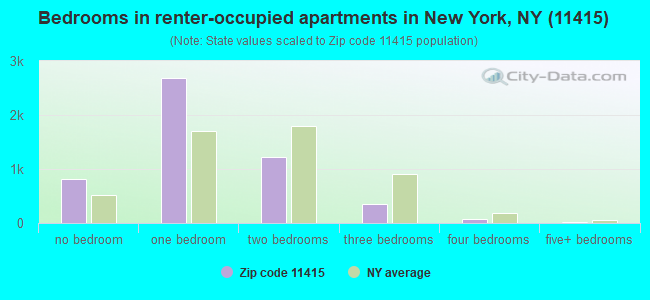
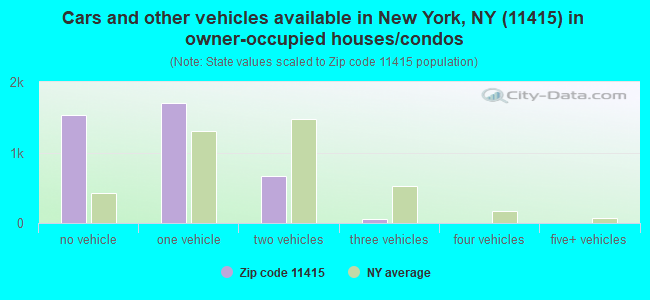
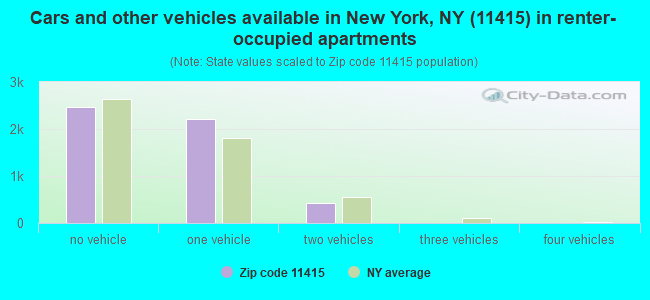


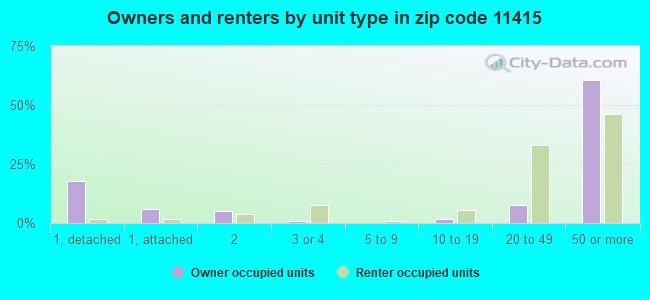
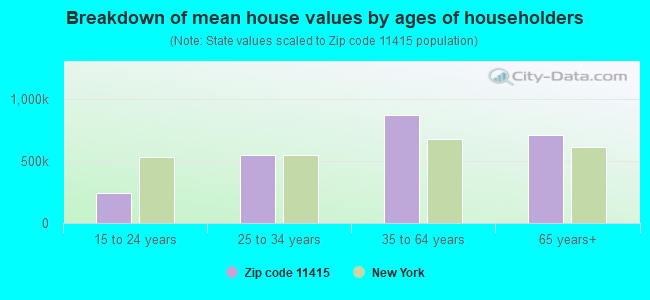


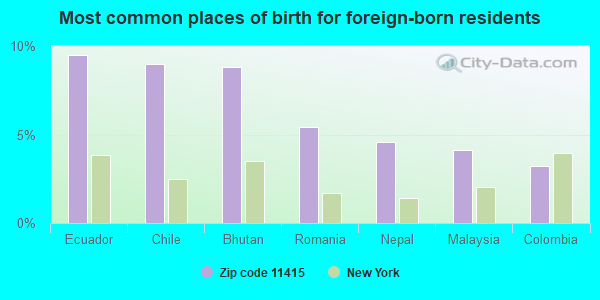
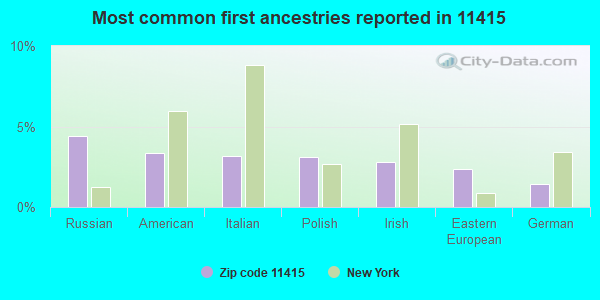
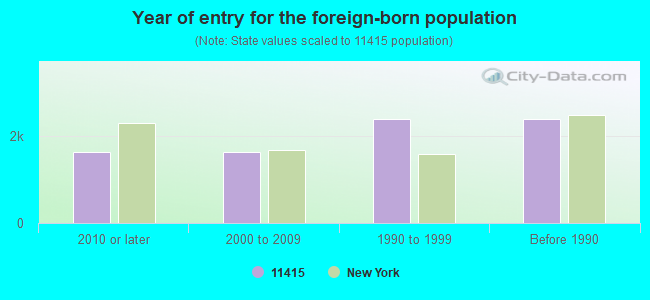

 (Students: 778, Location: 82-37 KEW GARDENS RD, Grades: KG-6)
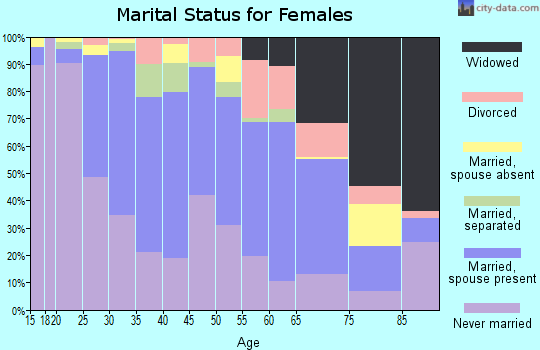
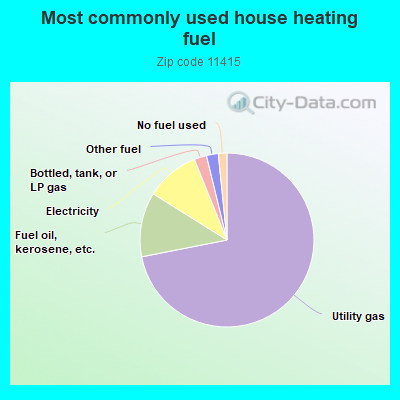
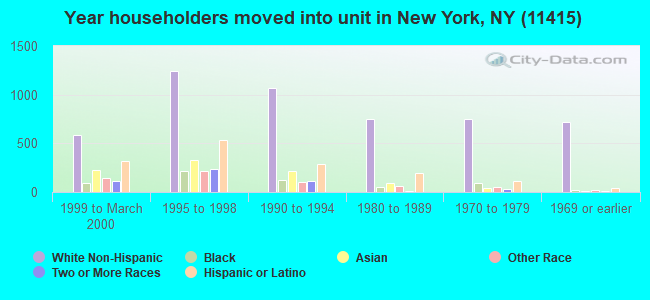
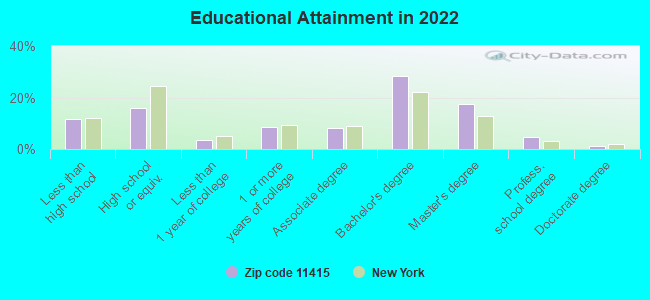
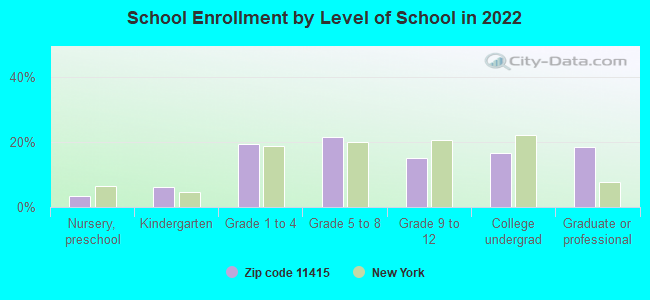
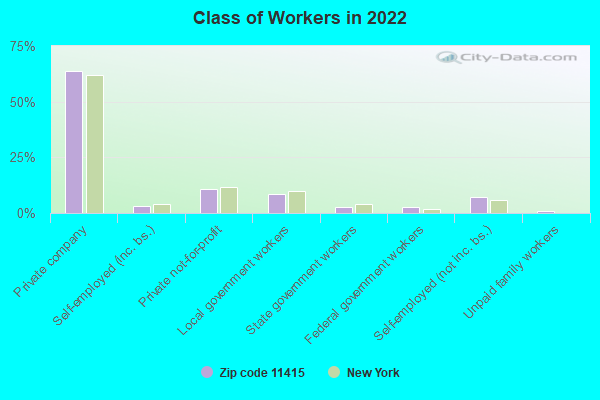
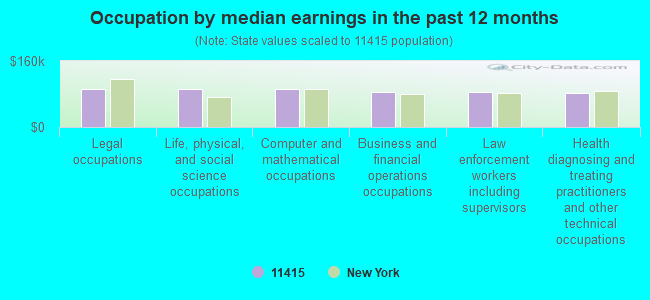
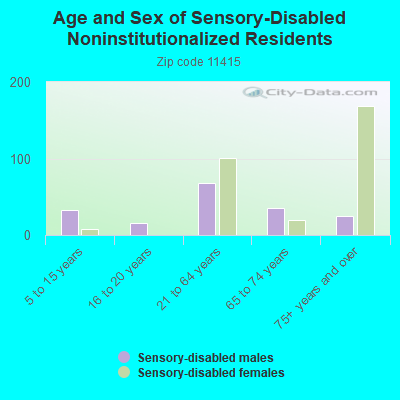
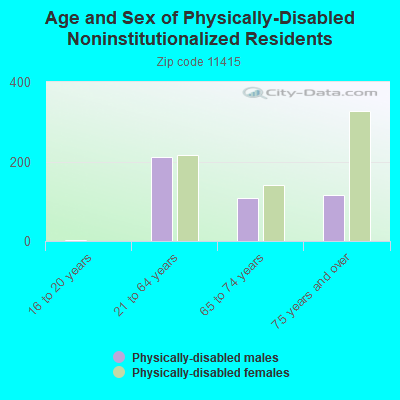
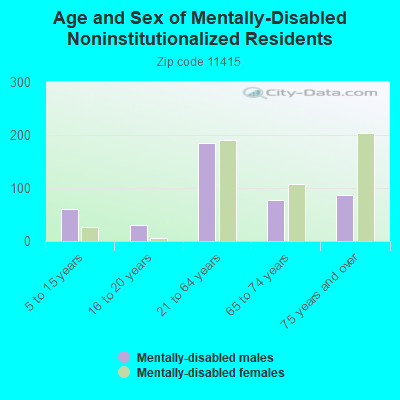
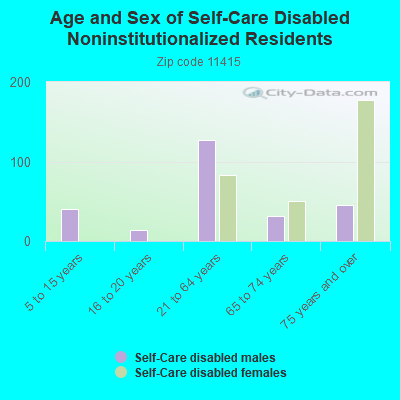
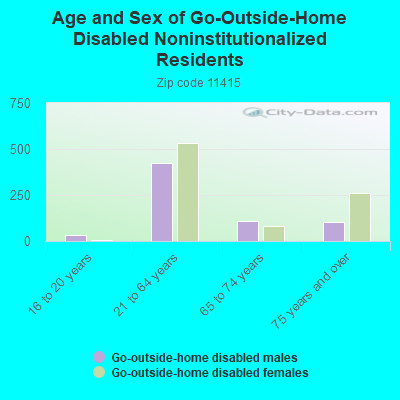
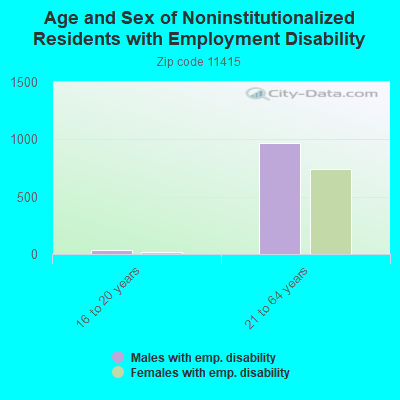
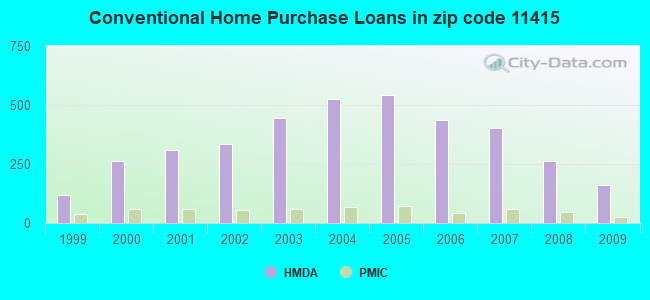
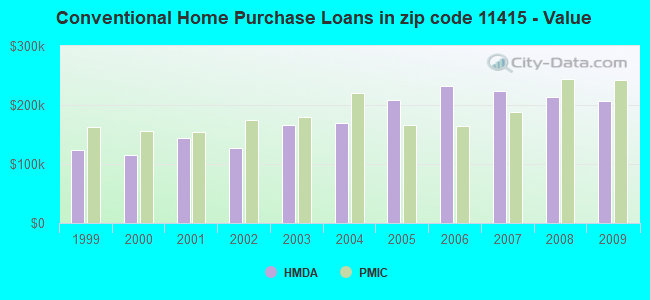
 According to the data from the years 2007 - 2018 the average number of fire incidents per year is 48. The highest number of reported fires - 62 took place in 2012, and the least - 31 in 2015. The data has a decreasing trend.
 When looking into fire subcategories, the most reports belonged to: Structure Fires (67.9%), and Outside Fires (16.8%).