Estimated zip code population in 2022: 47,332 Zip code population in 2010: 47,211 Zip code population in 2000: 48,867
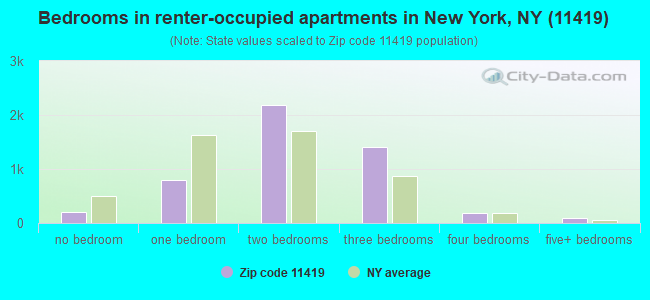
Houses and condos: 13,757 Renter-occupied apartments: 4,948
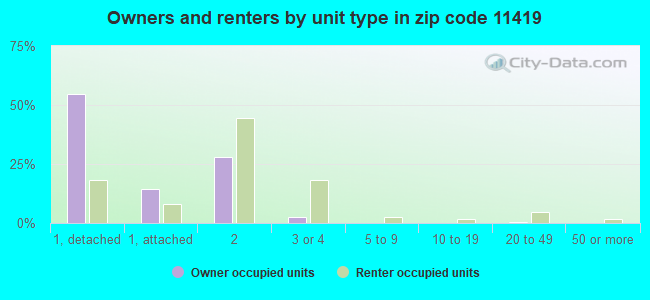
% of renters here:
38%
State:
46%
March 2022 cost of living index in zip code 11419: 149.3 (very high, U.S. average is 100)
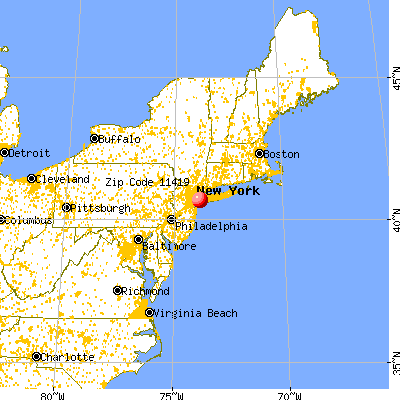
Land area: 1.1 sq. mi. Water area: 0.0 sq. mi.
Population density: 41,912 people per square mile
(very high).
OSM Map
General Map
Google Map
MSN Map
OSM Map
General Map
Google Map
MSN Map
OSM Map
General Map
Google Map
MSN Map
OSM Map
General Map
Google Map
MSN Map
Please wait while loading the map...
Real estate property taxes paid for housing units in 2022:
This zip code:
0.8% ($5,620)
New York:
1.5% ($6,180)
Median real estate property taxes paid for housing units with mortgages in 2022: $5,471 (0.8%) Median real estate property taxes paid for housing units with no mortgage in 2022: $5,775 (0.8%)
Business Search- 14 Million verified businesses
Males: 24,334
(51.4%)
Females: 22,998
(48.6%)
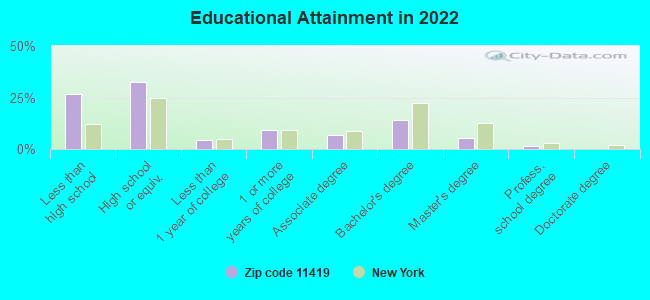
For population 25 years and over in 11419:
High school or higher: 73.2%
Bachelor's degree or higher: 20.7%
Graduate or professional degree: 6.7%
Unemployed: 7.2%
Mean travel time to work (commute): 46.5 minutes
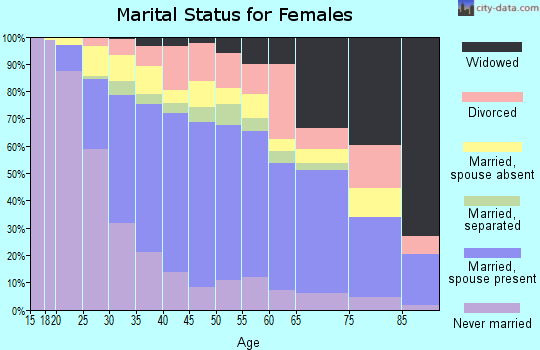
For population 15 years and over in 11419:
Never married: 35.7%
Now married: 50.3%
Separated: 2.8%
Widowed: 4.6%
Divorced: 6.6%
Zip code 11419 compared to state average:
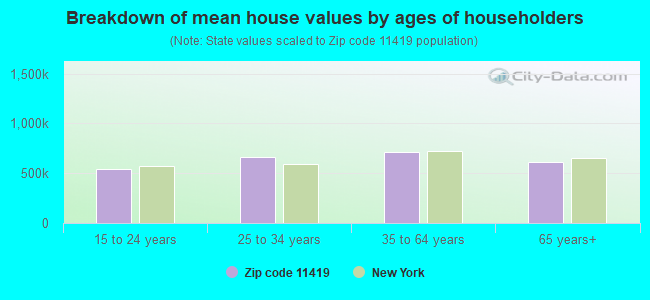
Median house value above state average.
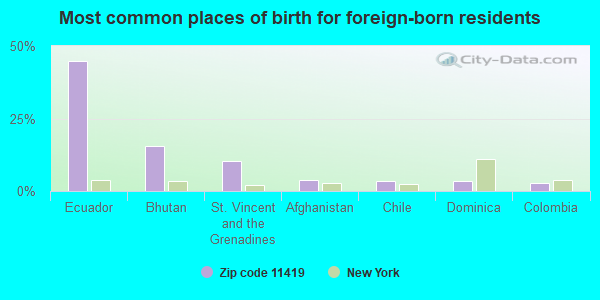
Foreign-born population percentage significantly above state average.
Length of stay since moving in significantly above state average.
House age above state average.
Percentage of population with a bachelor's degree or higher below state average.
Estimated median house/condo value in 2022: $682,483
11419:
$682,483
New York:
$400,400
According to our research of New York and other state lists, there were 23 registered sex offenders living in 11419 zip code as of April 27, 2024. The ratio of all residents to sex offenders in zip code 11419 is 2,277 to 1. The ratio of registered sex offenders to all residents in this zip code is lower than the state average.
Median resident age:
This zip code:
42.1 years
New York median age:
40.0 years
Average household size:
This zip code:
3.6 people
New York:
2.5 people
Averages for the 2020 tax year for zip code 11419, filed in 2021:
Average Adjusted Gross Income (AGI) in 2020: $37,038 (Individual Income Tax Returns)
Here:
$37,038
State:
$90,930
Salary/wage: $40,189 (reported on 69.3% of returns)
Here:
$40,189
State:
$72,104
(% of AGI for various income ranges: 931.7% for AGIs below $25k, 3582.1% for AGIs $25k-50k, 7141.6% for AGIs $50k-75k, 11126.8% for AGIs $75k-100k, 19652.5% for AGIs $100k-200k, 61920.0% for AGIs over 200k)
Taxable interest for individuals: $611 (reported on 17.5% of returns)
This zip code:
$611
New York:
$3,075
(% of AGI for various income ranges: 7.4% for AGIs below $25k, 8.2% for AGIs $25k-50k, 19.7% for AGIs $50k-75k, 37.4% for AGIs $75k-100k, 90.9% for AGIs $100k-200k, 638.0% for AGIs over 200k)
Ordinary dividends: $1,103 (reported on 5.6% of returns)
Here:
$1,103
State:
$11,095
(% of AGI for various income ranges: 2.7% for AGIs below $25k, 5.3% for AGIs $25k-50k, 7.7% for AGIs $50k-75k, 15.0% for AGIs $75k-100k, 67.7% for AGIs $100k-200k, 578.0% for AGIs over 200k)
Net capital gain/loss in AGI: +$6,716 (reported on 6.6% of returns)
Here:
+$6,716
State:
+$44,925
(% of AGI for various income ranges: 0.3% for AGIs below $25k, 15.3% for AGIs $25k-50k, 35.6% for AGIs $50k-75k, 102.7% for AGIs $75k-100k, 358.7% for AGIs $100k-200k, 12488.0% for AGIs over 200k)
Profit/loss from business: +$8,856 (reported on 32.2% of returns)
Here:
+$8,856
State:
+$14,940
(% of AGI for various income ranges: 646.7% for AGIs below $25k, 422.9% for AGIs $25k-50k, 190.9% for AGIs $50k-75k, 232.5% for AGIs $75k-100k, 311.6% for AGIs $100k-200k)
Taxable individual retirement arrangement distribution: $13,306 (reported on 1.3% of returns)
11419:
$13,306
New York:
$19,609
(% of AGI for various income ranges: 8.4% for AGIs below $25k, 13.6% for AGIs $25k-50k, 21.1% for AGIs $50k-75k, 56.0% for AGIs $75k-100k, 268.3% for AGIs $100k-200k)
Total itemized deductions: $26,130 (reported on 5.1% of returns)
Here:
$26,130
State:
$39,326
(% of AGI for various income ranges: 32.7% for AGIs below $25k, 107.6% for AGIs $25k-50k, 328.1% for AGIs $50k-75k, 709.2% for AGIs $75k-100k, 1278.6% for AGIs $100k-200k, 3718.0% for AGIs over 200k)
Charity contributions: $4,844 (reported on 3.9% of returns)
Here:
$4,844
State:
$15,420
(% of AGI for various income ranges: 2.4% for AGIs below $25k, 9.1% for AGIs $25k-50k, 41.5% for AGIs $50k-75k, 101.6% for AGIs $75k-100k, 217.7% for AGIs $100k-200k, 1220.0% for AGIs over 200k)
Taxes paid: $8,504 (reported on 5.1% of returns)
11419:
$8,504
State:
$9,183
(% of AGI for various income ranges: 9.3% for AGIs below $25k, 30.9% for AGIs $25k-50k, 112.5% for AGIs $50k-75k, 256.9% for AGIs $75k-100k, 403.9% for AGIs $100k-200k, 1048.0% for AGIs over 200k)
Earned income credit: $1,869 (reported on 22.2% of returns)
Here:
$1,869
State:
$2,138
(% of AGI for various income ranges: 103.2% for AGIs below $25k, 75.4% for AGIs $25k-50k, 1.1% for AGIs $50k-75k)
Percentage of individuals using paid preparers for their 2020 taxes: 93.3%
Here:
93%
State:
95%
(% for various income ranges: 89.8% for AGIs below $25k, 96.7% for AGIs $25k-50k, 96.2% for AGIs $50k-75k, 96.2% for AGIs $75k-100k, 95.0% for AGIs $100k-200k, 93.8% for AGIs over 200k)
Averages for the 2012 tax year for zip code 11419, filed in 2013:
Average Adjusted Gross Income (AGI) in 2012: $31,453 (Individual Income Tax Returns)
Here:
$31,453
State:
$77,088
Salary/wage: $34,793 (reported on 77.8% of returns)
Here:
$34,793
State:
$60,593
(% of AGI for various income ranges: 68.5% for AGIs below $25k, 91.4% for AGIs $25k-50k, 93.4% for AGIs $50k-75k, 91.2% for AGIs $75k-100k, 88.5% for AGIs $100k-200k, 74.2% for AGIs over 200k)
Taxable interest for individuals: $486 (reported on 22.6% of returns)
This zip code:
$486
New York:
$3,125
(% of AGI for various income ranges: 0.4% for AGIs below $25k, 0.3% for AGIs $25k-50k, 0.3% for AGIs $50k-75k, 0.3% for AGIs $75k-100k, 0.5% for AGIs $100k-200k, 0.9% for AGIs over 200k)
Ordinary dividends: $1,080 (reported on 5.4% of returns)
Here:
$1,080
State:
$10,299
(% of AGI for various income ranges: 0.1% for AGIs below $25k, 0.2% for AGIs $25k-50k, 0.2% for AGIs $50k-75k, 0.3% for AGIs $75k-100k, 0.3% for AGIs $100k-200k)
Profit/loss from business: +$10,096 (reported on 24.6% of returns)
Here:
+$10,096
State:
+$16,168
(% of AGI for various income ranges: 26.7% for AGIs below $25k, 5.4% for AGIs $25k-50k, 1.4% for AGIs $50k-75k, 0.8% for AGIs $75k-100k, 1.1% for AGIs $100k-200k)
Taxable individual retirement arrangement distribution: $9,772 (reported on 1.8% of returns)
11419:
$9,772
New York:
$17,621
(% of AGI for various income ranges: 0.4% for AGIs below $25k, 0.4% for AGIs $25k-50k, 0.4% for AGIs $50k-75k, 0.9% for AGIs $75k-100k, 1.2% for AGIs $100k-200k)
Total itemized deductions: $19,481 (32% of AGI, reported on 25.4% of returns)
Here:
$19,481
State:
$34,985
Here:
32.3% of AGI
State:
21.3% of AGI
(% of AGI for various income ranges: 6.8% for AGIs below $25k, 15.5% for AGIs $25k-50k, 19.4% for AGIs $50k-75k, 20.3% for AGIs $75k-100k, 20.9% for AGIs $100k-200k, 17.2% for AGIs over 200k)
Charity contributions: $2,367 (reported on 20.5% of returns)
Here:
$2,367
State:
$5,572
(% of AGI for various income ranges: 0.4% for AGIs below $25k, 1.4% for AGIs $25k-50k, 2.1% for AGIs $50k-75k, 2.0% for AGIs $75k-100k, 2.2% for AGIs $100k-200k, 1.9% for AGIs over 200k)
Taxes paid: $6,620 (reported on 25.4% of returns)
11419:
$6,620
State:
$18,656
(% of AGI for various income ranges: 1.4% for AGIs below $25k, 3.7% for AGIs $25k-50k, 6.8% for AGIs $50k-75k, 8.2% for AGIs $75k-100k, 9.8% for AGIs $100k-200k, 10.2% for AGIs over 200k)
Earned income credit: $2,371 (reported on 33.2% of returns)
Here:
$2,371
State:
$2,230
(% of AGI for various income ranges: 9.5% for AGIs below $25k, 1.6% for AGIs $25k-50k)
Percentage of individuals using paid preparers for their 2012 taxes: 80.7%
Here:
81%
State:
66%
(% for various income ranges: 81.2% for AGIs below $25k, 81.4% for AGIs $25k-50k, 78.9% for AGIs $50k-75k, 75.0% for AGIs $75k-100k, 78.1% for AGIs $100k-200k, 83.3% for AGIs over 200k)
Averages for the 2004 tax year for zip code 11419, filed in 2005:
Average Adjusted Gross Income (AGI) in 2004: $28,465 (Individual Income Tax Returns)
Here:
$28,465
State:
$59,519
Salary/wage: $31,288 (reported on 81.5% of returns)
Here:
$31,288
State:
$50,673
(% of AGI for various income ranges: 68.5% for AGIs below $10k, 83.0% for AGIs $10k-25k, 95.6% for AGIs $25k-50k, 94.4% for AGIs $50k-75k, 91.0% for AGIs $75k-100k, 79.3% for AGIs over 100k)
Taxable interest for individuals: $513 (reported on 38.6% of returns)
This zip code:
$513
New York:
$2,377
(% of AGI for various income ranges: 1.9% for AGIs below $10k, 0.6% for AGIs $10k-25k, 0.5% for AGIs $25k-50k, 0.6% for AGIs $50k-75k, 0.8% for AGIs $75k-100k, 1.0% for AGIs over 100k)
Taxable dividends: $924 (reported on 8.6% of returns)
Here:
$924
State:
$5,394
(% of AGI for various income ranges: 0.7% for AGIs below $10k, 0.2% for AGIs $10k-25k, 0.2% for AGIs $25k-50k, 0.2% for AGIs $50k-75k, 0.5% for AGIs $75k-100k, 0.4% for AGIs over 100k)
Net capital gain/loss: +$4,416 (reported on 5.4% of returns)
Here:
+$4,416
State:
+$23,581
(% of AGI for various income ranges: -0.1% for AGIs below $10k, -0.2% for AGIs $10k-25k, 0.1% for AGIs $25k-50k, 0.4% for AGIs $50k-75k, 0.9% for AGIs $75k-100k, 6.2% for AGIs over 100k)
Profit/loss from business: +$8,512 (reported on 21.5% of returns)
Here:
+$8,512
State:
+$13,809
(% of AGI for various income ranges: 41.3% for AGIs below $10k, 16.0% for AGIs $10k-25k, 2.8% for AGIs $25k-50k, 1.3% for AGIs $50k-75k, 0.6% for AGIs $75k-100k, 3.3% for AGIs over 100k)
IRA payment deduction: $3,025 (reported on 1.5% of returns)
11419:
$3,025
New York:
$3,115
(% of AGI for various income ranges: 0.1% for AGIs below $10k, 0.1% for AGIs $10k-25k, 0.2% for AGIs $25k-50k, 0.2% for AGIs $50k-75k, 0.1% for AGIs $75k-100k, 0.1% for AGIs over 100k)
Self-employed pension: $13,357 (reported on 0.1% of returns)
Here:
$13,357
New York:
$19,016
Total itemized deductions: $17,449 (36% of AGI, reported on 33.2% of returns)
Here:
$17,449
State:
$25,864
Here:
35.7% of AGI
State:
21.9% of AGI
(% of AGI for various income ranges: 8.5% for AGIs below $10k, 13.1% for AGIs $10k-25k, 22.2% for AGIs $25k-50k, 24.0% for AGIs $50k-75k, 23.4% for AGIs $75k-100k, 22.4% for AGIs over 100k)
Charity contributions deductions: $2,550 (5% of AGI, reported on 29.0% of returns)
Here:
$2,550
State:
$4,439
Here:
4.9% of AGI
State:
3.6% of AGI
(% of AGI for various income ranges: 0.3% for AGIs below $10k, 1.3% for AGIs $10k-25k, 2.9% for AGIs $25k-50k, 3.4% for AGIs $50k-75k, 3.2% for AGIs $75k-100k, 3.0% for AGIs over 100k)
Total tax: $2,785 (reported on 68.8% of returns)
11419:
$2,785
State:
$11,730
(% of AGI for various income ranges: 7.0% for AGIs below $10k, 4.2% for AGIs $10k-25k, 5.0% for AGIs $25k-50k, 7.4% for AGIs $50k-75k, 9.0% for AGIs $75k-100k, 13.8% for AGIs over 100k)
Earned income credit: $1,817 (reported on 28.8% of returns)
Here:
$1,817
State:
$1,757
Percentage of individuals using paid preparers for their 2004 taxes: 72.9%
Here:
73%
State:
67%
(% for various income ranges: 69.9% for AGIs below $10k, 75.3% for AGIs $10k-25k, 73.2% for AGIs $25k-50k, 70.8% for AGIs $50k-75k, 74.0% for AGIs $75k-100k, 73.0% for AGIs over 100k)
Likely homosexual households (counted as self-reported same-sex unmarried-partner households)
Lesbian couples: 0.0% of all households
Gay men: 0.0% of all households
Household received Food Stamps/SNAP in the past 12 months: 2,939 Household did not receive Food Stamps/SNAP in the past 12 months: 10,349
Women who had a birth in the past 12 months: 367 (226 now married, 142 unmarried) Women who did not have a birth in the past 12 months: 10,175 (4,168 now married, 5,983 unmarried)
Housing units in zip code 11419 with a mortgage: 5,059 (357 second mortgage, 273 both second mortgage and home equity loan) Houses without a mortgage: 57
Median monthly owner costs for units with a mortgage: $2,977 Median monthly owner costs for units without a mortgage: $1,055
Residents with income below the poverty level in 2022:
This zip code:
11.3%
Whole state:
14.3%
Residents with income below 50% of the poverty level in 2022:
This zip code:
5.6%
Whole state:
6.8%
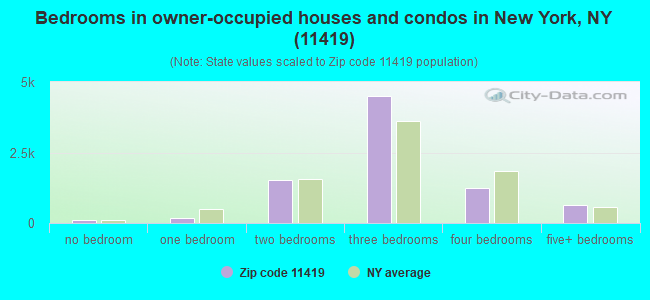
Median number of rooms in houses and condos:
Here:
5.8
State:
6.3
Median number of rooms in apartments:
Here:
4.2
State:
3.8
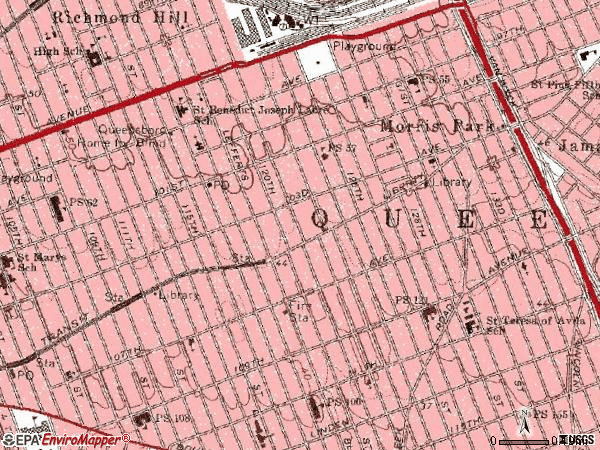
Notable locations in this zip code not listed on our city pages
Notable locations in zip code 11419: Lefferts Branch Queens Borough Public Library (A), Fire Department New York Engine 308 Battalion 51 Manifold Hose Wagon (B), Queensboro Home for Blind (C). Display/hide their locations on the map
Churches in zip code 11419 include: Saint Paul's Lutheran Church (A), Saint Benedict Joseph Labre Church (B), Kingdom Hall of Jehovahs Witnesses (C), Gurdwara Sikh Temple (D), Gospel Baptist Church (E). Display/hide their locations on the map
4,093 married couples with children.
1,466 single-parent households (359 men, 1,107 women).
61.7% of residents of 11419 zip code speak English at home.
15.2% of residents speak Spanish at home (54% very well, 20% well, 22% not well, 4% not at all).
19.7% of residents speak other Indo-European language at home (47% very well, 31% well, 17% not well, 5% not at all).
2.3% of residents speak Asian or Pacific Island language at home (41% very well, 25% well, 30% not well, 5% not at all).
0.6% of residents speak other language at home (87% very well, 11% well, 2% not well).
Foreign born population: 31,057 (65.6%) (67.1% of them are naturalized citizens)
This zip code:
65.6%
Whole state:
22.7%
45%Ecuador
16%Bhutan
10%St. Vincent and the Grenadines
4%Afghanistan
3%Chile
3%Dominica
3%Colombia
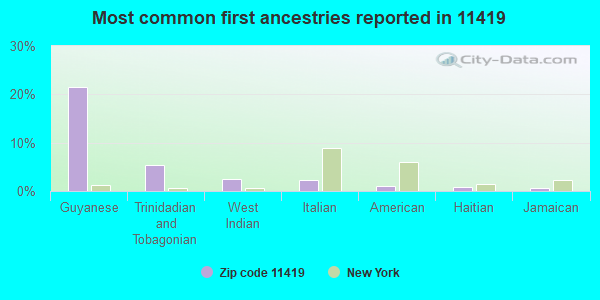
22%Guyanese
5%Trinidadian and Tobagonian
3%West Indian
2%Italian
1%American
1%Haitian
1%Jamaican
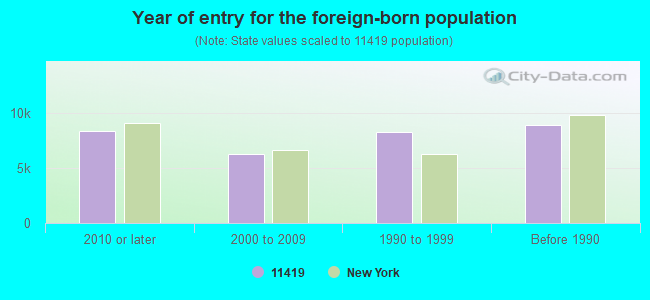
Year of entry for the foreign-born population
8,3532010 or later
6,3042000 to 2009
8,3331990 to 1999
8,952Before 1990
Public elementary/middle school in in zip code 11419 not listed on the city page:
Facilities with environmental interests located in this zip code:
110-12 LIBERTY CLEANERS (110-12 LIBERTY AVENUE in S RICHMOND HILL, NY)
AIR MINOR (AIRS/AFS) STATE MASTER (New York facility tracking) - AIR PROGRAM, HAZARDOUS WASTE PROGRAM Conditionally Exempt Small Quantity Generators, less than 100 kg/month of hazardous waste (Resource Conservation and Recovery Act (tracking hazardous waste)) Business SIC classification: DRYCLEANING PLANTS, EXCEPT RUG CLEANING Business NAICS classification: DRYCLEANING AND LAUNDRY SERVICES (EXCEPT COIN-OPERATED). Organizations: INGRID WOHRLE (CONTACT/OPERATOR)
, YOUNG LEE (CONTACT/OWNER)
, 110-12 LIBERTY CLEANERS INC (LEGALLY RESPONSIBLE PARTY)
CON ED - TM 0904 (N/S JAMAICA AVE S/E/C 130 ST in JAMAICA, NY)
HAZARDOUS WASTE BIENNIAL REPORTER (Resource Conservation and Recovery Act (tracking hazardous waste)) (Resource Conservation and Recovery Act (tracking hazardous waste))
CON ED - VS 5036 (JAMAICA AVE N in JAMAICA, NY)
HAZARDOUS WASTE BIENNIAL REPORTER (Resource Conservation and Recovery Act (tracking hazardous waste)) (Resource Conservation and Recovery Act (tracking hazardous waste))
CON ED - VS 8495 (E/S 106TH ST 40' S/O 103RD AVE in RICHMOND HILL, NY)
HAZARDOUS WASTE BIENNIAL REPORTER (Resource Conservation and Recovery Act (tracking hazardous waste)) (Resource Conservation and Recovery Act (tracking hazardous waste))
CON ED - VS 8779 (VAN WYCK EXP W/S/R 53 N 91ST in JAMAICA, NY)
HAZARDOUS WASTE BIENNIAL REPORTER (Resource Conservation and Recovery Act (tracking hazardous waste)) (Resource Conservation and Recovery Act (tracking hazardous waste))
CON ED - VS 9104 (W/S/R VAN WYCK EXP W 55 N 91ST in JAMAICA, NY)
HAZARDOUS WASTE BIENNIAL REPORTER (Resource Conservation and Recovery Act (tracking hazardous waste)) (Resource Conservation and Recovery Act (tracking hazardous waste))
BETHLEHEM CHURCH (89-45 LEFFERTS BLVD in RICHMOND HILL, NY)
(Resource Conservation and Recovery Act (tracking hazardous waste))
6401 4TH AVENUE CORP (112-20 ATLANTIC AVE in RICHMOND HILL, NY)
Conditionally Exempt Small Quantity Generators, less than 100 kg/month of hazardous waste (Resource Conservation and Recovery Act (tracking hazardous waste)) - notification
INDUSTRIAL PRINTERS (103-47 LEFFERTS BLVD in SOUTH RICHMOND HILL, NY)
Small Quantity Generators, between 100 kg and 1000 kg of hazardous waste/month (Resource Conservation and Recovery Act (tracking hazardous waste)) - notification Organizations: WELDCO INC (CONTACT/OWNER)
Housing units lacking complete plumbing facilities: 1.2% Housing units lacking complete kitchen facilities: 1.4%
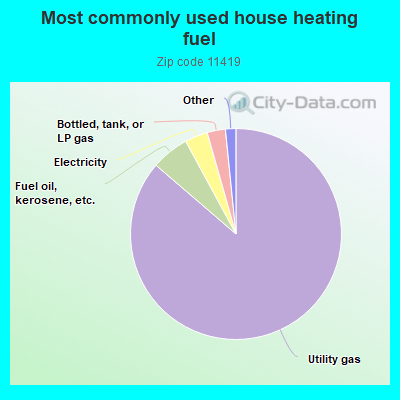
86.3%Utility gas
5.8%Fuel oil, kerosene, etc.
3.5%Electricity
2.8%Bottled, tank, or LP gas
0.6%Other fuel
0.6%No fuel used
Population in 1990: 37,530. Population change in the 1990s: +11,337 (+30.2%).
Place of birth for U.S.-born residents:
This state: 14,394
Northeast: 221
Midwest: 67
South: 483
West: 171
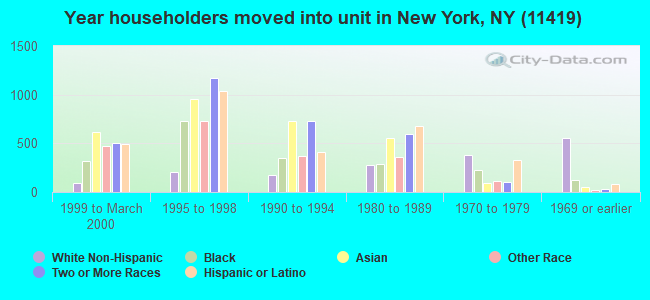
68% of the 11419 zip code residents lived in the same house 5 years ago. Out of people who lived in different houses, 75% lived in this county. Out of people who lived in different counties, 50% lived in New York.
94% of the 11419 zip code residents lived in the same house 1 year ago. Out of people who lived in different houses, 60% moved from this county. Out of people who lived in different houses, 14% moved from different county within same state. Out of people who lived in different houses, 7% moved from different state. Out of people who lived in different houses, 18% moved from abroad.
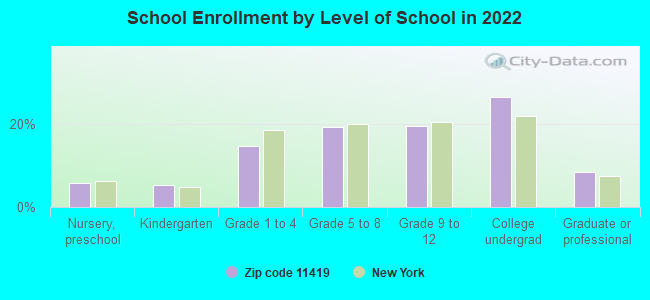
Private vs. public school enrollment:
Students in private schools in grades 1 to 8 (elementary and middle school): 257
Here:
7.1%
New York:
15.6%
Students in private schools in grades 9 to 12 (high school): 189
Here:
9.1%
New York:
15.0%
Students in private undergraduate colleges: 617
Here:
22.0%
New York:
39.2%
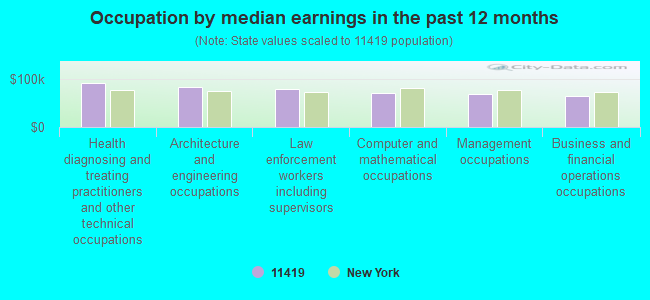
Occupation by median earnings in the past 12 months ($)
92,357Health diagnosing and treating practitioners and other technical occupations
83,774Architecture and engineering occupations
79,721Law enforcement workers including supervisors
71,799Computer and mathematical occupations
69,270Management occupations
64,526Business and financial operations occupations
Companies with federal contracts located in this zip code:
NEW WORLD CONSTRUCTION (101-56 133RD STREET in SOUTH RICHMOND, NY; small business) : $1,275,671 in 96 contractsfrom 2000 to 2002
Contracts for Maintenance, Repair or Alteration of Real Property -- Miscellaneous Buildings by Navy Signed by year:2000: $381,483; 2001: $673,232; 2002: $220,956; 2003: $0; 2004: $0; 2005: $0; 2006: $0.
Biggest contracts:
$40,600 with Navy for Maintenance, Repair or Alteration of Real Property -- Miscellaneous Buildings. Signed on 2000-10-18. Completion date: 2001-01-18.
$25,000, same as above.Signed on 2001-04-02. Completion date: 2001-09-30.
$24,900, same as above.Signed on 2001-04-02. Completion date: 2001-09-20.
$24,850, same as above.Signed on 2001-04-11. Completion date: 2001-09-30.
GK CONSTRUCTION, INC (101-56 133RD ST in SOUTH RICHMOND, NY; small business) : $1,234,093 in 83 contractsfrom 2002 to 2004
Contracts for Facilities Operations Support Services, Maintenance, Repair or Alteration of Real Property -- Miscellaneous Buildings by Navy Signed by year:2000: $0; 2001: $0; 2002: $775,634; 2003: $316,189; 2004: $142,270; 2005: $0; 2006: $0.
Biggest contracts:
$54,590 with Navy for Facilities Operations Support Services. Signed on 2003-05-13. Completion date: 2003-05-13.
$53,000, same as above.Signed on 2002-05-14. Completion date: 2003-05-13.
$33,216 with Navy for Maintenance, Repair or Alteration of Real Property -- Miscellaneous Buildings. Signed on 2003-06-05. Completion date: 2003-07-21.
$27,565, same as above.Signed on 2003-04-14. Completion date: 2003-06-30.
Top industries in this zip code by the number of employees in 2005:
Health Care and Social Assistance: Offices of Physicians (except Mental Health Specialists) (50-99 employees: 1 establishment, 20-49 employees: 1 establishment, 10-19 employees: 1 establishment, 5-9 employees: 3 establishments, 1-4 employees: 20 establishments)
2007 - 2018 National Fire Incident Reporting System (NFIRS) incidents
According to the data from the years 2007 - 2018 the average number of fire incidents per year is 127. The highest number of reported fires - 155 took place in 2011, and the least - 86 in 2007. The data has a rising trend.
When looking into fire subcategories, the most incidents belonged to: Structure Fires (65.8%), and Outside Fires (17.1%).
Fire incident types reported to NFIRS in Zip Code 11419


 Nearest zip codes: 11420, 11418, 11435, 11415, 11417, 11424.


 (Students: 810, Location: 101-33 124TH ST, Grades: PK-5)
 According to the data from the years 2007 - 2018 the average number of fire incidents per year is 127. The highest number of reported fires - 155 took place in 2011, and the least - 86 in 2007. The data has a rising trend.
 When looking into fire subcategories, the most incidents belonged to: Structure Fires (65.8%), and Outside Fires (17.1%).