Estimated zip code population in 2022: 30,704 Zip code population in 2010: 28,967 Zip code population in 2000: 28,607
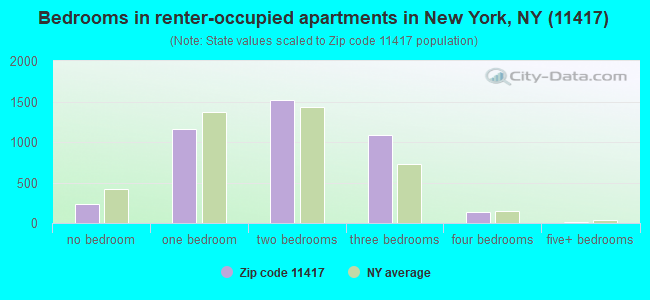
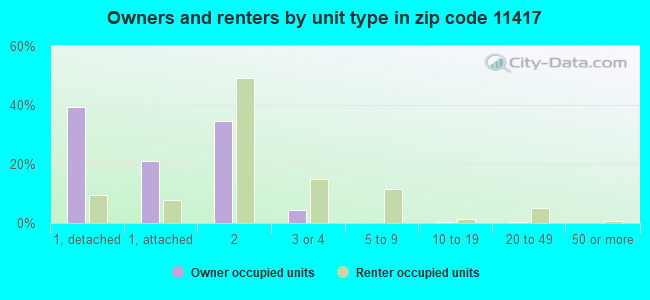
Houses and condos: 10,015 Renter-occupied apartments: 4,165
% of renters here:
43%
State:
46%
March 2022 cost of living index in zip code 11417: 150.4 (very high, U.S. average is 100)
Land area: 1.1 sq. mi. Water area: 0.0 sq. mi.
Population density: 27,438 people per square mile
(very high).
OSM Map
General Map
Google Map
MSN Map
OSM Map
General Map
Google Map
MSN Map
OSM Map
General Map
Google Map
MSN Map
OSM Map
General Map
Google Map
MSN Map
Please wait while loading the map...
Real estate property taxes paid for housing units in 2022:
This zip code:
0.8% ($5,256)
New York:
1.5% ($6,180)
Median real estate property taxes paid for housing units with mortgages in 2022: $5,491 (0.7%) Median real estate property taxes paid for housing units with no mortgage in 2022: $4,793 (0.7%)
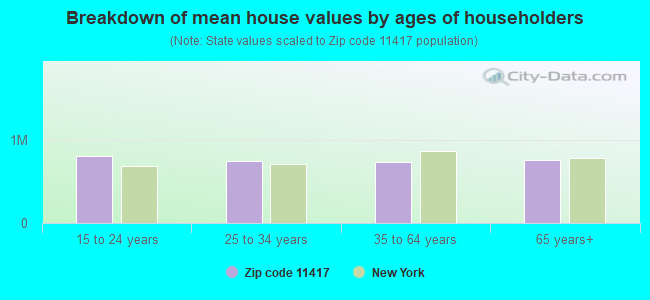
Estimated median house/condo value in 2022: $698,224
11417:
$698,224
New York:
$400,400
According to our research of New York and other state lists, there were 6 registered sex offenders living in 11417 zip code as of April 27, 2024. The ratio of all residents to sex offenders in zip code 11417 is 5,366 to 1. The ratio of registered sex offenders to all residents in this zip code is much lower than the state average.
Median resident age:
This zip code:
37.3 years
New York median age:
40.0 years
Average household size:
This zip code:
3.2 people
New York:
2.5 people
Averages for the 2020 tax year for zip code 11417, filed in 2021:
Average Adjusted Gross Income (AGI) in 2020: $47,285 (Individual Income Tax Returns)
Here:
$47,285
State:
$90,930
Salary/wage: $47,203 (reported on 78.8% of returns)
Here:
$47,203
State:
$72,104
(% of AGI for various income ranges: 921.3% for AGIs below $25k, 3370.0% for AGIs $25k-50k, 6954.6% for AGIs $50k-75k, 10647.8% for AGIs $75k-100k, 18120.1% for AGIs $100k-200k, 58775.7% for AGIs over 200k)
Taxable interest for individuals: $770 (reported on 22.5% of returns)
This zip code:
$770
New York:
$3,075
(% of AGI for various income ranges: 9.8% for AGIs below $25k, 10.9% for AGIs $25k-50k, 28.2% for AGIs $50k-75k, 69.3% for AGIs $75k-100k, 75.8% for AGIs $100k-200k, 208.6% for AGIs over 200k)
Ordinary dividends: $1,721 (reported on 9.5% of returns)
Here:
$1,721
State:
$11,095
(% of AGI for various income ranges: 6.7% for AGIs below $25k, 8.6% for AGIs $25k-50k, 31.6% for AGIs $50k-75k, 37.5% for AGIs $75k-100k, 74.9% for AGIs $100k-200k, 581.4% for AGIs over 200k)
Net capital gain/loss in AGI: +$3,822 (reported on 10.5% of returns)
Here:
+$3,822
State:
+$44,925
(% of AGI for various income ranges: 3.0% for AGIs below $25k, 9.5% for AGIs $25k-50k, 36.2% for AGIs $50k-75k, 58.9% for AGIs $75k-100k, 225.2% for AGIs $100k-200k, 3785.7% for AGIs over 200k)
Profit/loss from business: +$6,930 (reported on 21.2% of returns)
Here:
+$6,930
State:
+$14,940
(% of AGI for various income ranges: 292.4% for AGIs below $25k, 181.6% for AGIs $25k-50k, 111.2% for AGIs $50k-75k, 193.8% for AGIs $75k-100k, 164.2% for AGIs $100k-200k, 438.6% for AGIs over 200k)
Taxable individual retirement arrangement distribution: $12,471 (reported on 2.8% of returns)
11417:
$12,471
New York:
$19,609
(% of AGI for various income ranges: 20.9% for AGIs below $25k, 25.6% for AGIs $25k-50k, 39.8% for AGIs $50k-75k, 119.3% for AGIs $75k-100k, 211.2% for AGIs $100k-200k)
Total itemized deductions: $27,191 (reported on 8.0% of returns)
Here:
$27,191
State:
$39,326
(% of AGI for various income ranges: 42.0% for AGIs below $25k, 119.5% for AGIs $25k-50k, 320.9% for AGIs $50k-75k, 746.0% for AGIs $75k-100k, 1353.8% for AGIs $100k-200k, 5117.1% for AGIs over 200k)
Charity contributions: $4,556 (reported on 6.0% of returns)
Here:
$4,556
State:
$15,420
(% of AGI for various income ranges: 1.5% for AGIs below $25k, 13.9% for AGIs $25k-50k, 36.7% for AGIs $50k-75k, 81.0% for AGIs $75k-100k, 176.5% for AGIs $100k-200k, 1048.6% for AGIs over 200k)
Taxes paid: $8,818 (reported on 8.0% of returns)
11417:
$8,818
State:
$9,183
(% of AGI for various income ranges: 10.6% for AGIs below $25k, 35.2% for AGIs $25k-50k, 108.9% for AGIs $50k-75k, 269.5% for AGIs $75k-100k, 469.9% for AGIs $100k-200k, 1110.0% for AGIs over 200k)
Earned income credit: $2,084 (reported on 21.0% of returns)
Here:
$2,084
State:
$2,138
(% of AGI for various income ranges: 105.7% for AGIs below $25k, 78.8% for AGIs $25k-50k, 1.5% for AGIs $50k-75k)
Percentage of individuals using paid preparers for their 2020 taxes: 94.8%
Here:
95%
State:
95%
(% for various income ranges: 92.3% for AGIs below $25k, 97.0% for AGIs $25k-50k, 96.0% for AGIs $50k-75k, 94.6% for AGIs $75k-100k, 96.2% for AGIs $100k-200k, 95.0% for AGIs over 200k)
Averages for the 2012 tax year for zip code 11417, filed in 2013:
Average Adjusted Gross Income (AGI) in 2012: $39,792 (Individual Income Tax Returns)
Here:
$39,792
State:
$77,088
Salary/wage: $41,242 (reported on 81.6% of returns)
Here:
$41,242
State:
$60,593
(% of AGI for various income ranges: 68.7% for AGIs below $25k, 89.6% for AGIs $25k-50k, 89.6% for AGIs $50k-75k, 88.8% for AGIs $75k-100k, 89.6% for AGIs $100k-200k, 47.8% for AGIs over 200k)
Taxable interest for individuals: $563 (reported on 27.6% of returns)
This zip code:
$563
New York:
$3,125
(% of AGI for various income ranges: 0.4% for AGIs below $25k, 0.3% for AGIs $25k-50k, 0.4% for AGIs $50k-75k, 0.4% for AGIs $75k-100k, 0.4% for AGIs $100k-200k, 0.3% for AGIs over 200k)
Ordinary dividends: $1,455 (reported on 9.1% of returns)
Here:
$1,455
State:
$10,299
(% of AGI for various income ranges: 0.3% for AGIs below $25k, 0.3% for AGIs $25k-50k, 0.3% for AGIs $50k-75k, 0.3% for AGIs $75k-100k, 0.3% for AGIs $100k-200k, 0.4% for AGIs over 200k)
Net capital gain/loss in AGI: +$2,535 (reported on 6.5% of returns)
Here:
+$2,535
State:
+$42,474
(% of AGI for various income ranges: 0.2% for AGIs $100k-200k, 8.8% for AGIs over 200k)
Profit/loss from business: +$9,107 (reported on 18.4% of returns)
Here:
+$9,107
State:
+$16,168
(% of AGI for various income ranges: 21.1% for AGIs below $25k, 2.8% for AGIs $25k-50k, 1.2% for AGIs $50k-75k, 0.6% for AGIs $75k-100k, 0.8% for AGIs $100k-200k)
Taxable individual retirement arrangement distribution: $9,896 (reported on 3.5% of returns)
11417:
$9,896
New York:
$17,621
(% of AGI for various income ranges: 1.1% for AGIs below $25k, 0.9% for AGIs $25k-50k, 1.0% for AGIs $50k-75k, 0.9% for AGIs $75k-100k, 0.8% for AGIs $100k-200k)
Total itemized deductions: $21,580 (29% of AGI, reported on 31.8% of returns)
Here:
$21,580
State:
$34,985
Here:
29.3% of AGI
State:
21.3% of AGI
(% of AGI for various income ranges: 7.2% for AGIs below $25k, 14.5% for AGIs $25k-50k, 18.8% for AGIs $50k-75k, 22.1% for AGIs $75k-100k, 21.7% for AGIs $100k-200k, 19.7% for AGIs over 200k)
Charity contributions: $2,150 (reported on 26.3% of returns)
Here:
$2,150
State:
$5,572
(% of AGI for various income ranges: 0.4% for AGIs below $25k, 1.2% for AGIs $25k-50k, 1.7% for AGIs $50k-75k, 1.8% for AGIs $75k-100k, 1.8% for AGIs $100k-200k, 1.2% for AGIs over 200k)
Taxes paid: $8,119 (reported on 31.8% of returns)
11417:
$8,119
State:
$18,656
(% of AGI for various income ranges: 1.7% for AGIs below $25k, 3.8% for AGIs $25k-50k, 6.7% for AGIs $50k-75k, 8.7% for AGIs $75k-100k, 10.0% for AGIs $100k-200k, 10.8% for AGIs over 200k)
Earned income credit: $2,401 (reported on 27.2% of returns)
Here:
$2,401
State:
$2,230
(% of AGI for various income ranges: 9.4% for AGIs below $25k, 1.2% for AGIs $25k-50k)
Percentage of individuals using paid preparers for their 2012 taxes: 77.1%
Here:
77%
State:
66%
(% for various income ranges: 76.8% for AGIs below $25k, 76.9% for AGIs $25k-50k, 76.3% for AGIs $50k-75k, 79.8% for AGIs $75k-100k, 78.9% for AGIs $100k-200k, 71.4% for AGIs over 200k)
Averages for the 2004 tax year for zip code 11417, filed in 2005:
Average Adjusted Gross Income (AGI) in 2004: $35,894 (Individual Income Tax Returns)
Here:
$35,894
State:
$59,519
Salary/wage: $37,599 (reported on 83.1% of returns)
Here:
$37,599
State:
$50,673
(% of AGI for various income ranges: 66.0% for AGIs below $10k, 79.6% for AGIs $10k-25k, 91.9% for AGIs $25k-50k, 90.8% for AGIs $50k-75k, 89.5% for AGIs $75k-100k, 80.3% for AGIs over 100k)
Taxable interest for individuals: $898 (reported on 44.9% of returns)
This zip code:
$898
New York:
$2,377
(% of AGI for various income ranges: 3.2% for AGIs below $10k, 1.4% for AGIs $10k-25k, 0.9% for AGIs $25k-50k, 1.0% for AGIs $50k-75k, 0.8% for AGIs $75k-100k, 1.4% for AGIs over 100k)
Taxable dividends: $1,257 (reported on 14.1% of returns)
Here:
$1,257
State:
$5,394
(% of AGI for various income ranges: 1.5% for AGIs below $10k, 0.4% for AGIs $10k-25k, 0.4% for AGIs $25k-50k, 0.4% for AGIs $50k-75k, 0.5% for AGIs $75k-100k, 0.7% for AGIs over 100k)
Net capital gain/loss: +$1,636 (reported on 10.0% of returns)
Here:
+$1,636
State:
+$23,581
(% of AGI for various income ranges: -0.7% for AGIs below $10k, -0.2% for AGIs $10k-25k, 0.0% for AGIs $25k-50k, -0.0% for AGIs $50k-75k, 0.8% for AGIs $75k-100k, 2.2% for AGIs over 100k)
Profit/loss from business: +$8,761 (reported on 16.3% of returns)
Here:
+$8,761
State:
+$13,809
(% of AGI for various income ranges: 34.4% for AGIs below $10k, 12.4% for AGIs $10k-25k, 2.5% for AGIs $25k-50k, 0.8% for AGIs $50k-75k, 1.2% for AGIs $75k-100k, 2.2% for AGIs over 100k)
IRA payment deduction: $2,856 (reported on 2.2% of returns)
11417:
$2,856
New York:
$3,115
(% of AGI for various income ranges: 0.3% for AGIs below $10k, 0.2% for AGIs $10k-25k, 0.3% for AGIs $25k-50k, 0.2% for AGIs $50k-75k, 0.1% for AGIs $75k-100k, 0.1% for AGIs over 100k)
Self-employed pension: $9,150 (reported on 0.2% of returns)
Here:
$9,150
New York:
$19,016
Total itemized deductions: $18,194 (31% of AGI, reported on 40.1% of returns)
Here:
$18,194
State:
$25,864
Here:
31.4% of AGI
State:
21.9% of AGI
(% of AGI for various income ranges: 10.6% for AGIs below $10k, 13.6% for AGIs $10k-25k, 20.4% for AGIs $25k-50k, 23.1% for AGIs $50k-75k, 22.7% for AGIs $75k-100k, 21.1% for AGIs over 100k)
Charity contributions deductions: $2,396 (4% of AGI, reported on 36.2% of returns)
Here:
$2,396
State:
$4,439
Here:
4.0% of AGI
State:
3.6% of AGI
(% of AGI for various income ranges: 0.5% for AGIs below $10k, 1.2% for AGIs $10k-25k, 2.6% for AGIs $25k-50k, 2.9% for AGIs $50k-75k, 2.7% for AGIs $75k-100k, 2.4% for AGIs over 100k)
Total tax: $4,005 (reported on 73.1% of returns)
11417:
$4,005
State:
$11,730
(% of AGI for various income ranges: 5.6% for AGIs below $10k, 4.1% for AGIs $10k-25k, 6.0% for AGIs $25k-50k, 8.1% for AGIs $50k-75k, 9.4% for AGIs $75k-100k, 14.2% for AGIs over 100k)
Earned income credit: $1,751 (reported on 21.9% of returns)
Here:
$1,751
State:
$1,757
Percentage of individuals using paid preparers for their 2004 taxes: 72.6%
Here:
73%
State:
67%
(% for various income ranges: 68.9% for AGIs below $10k, 74.0% for AGIs $10k-25k, 72.6% for AGIs $25k-50k, 72.4% for AGIs $50k-75k, 76.0% for AGIs $75k-100k, 75.8% for AGIs over 100k)
Likely homosexual households (counted as self-reported same-sex unmarried-partner households)
Lesbian couples: 0.1% of all households
Gay men: 0.1% of all households
Household received Food Stamps/SNAP in the past 12 months: 1,606 Household did not receive Food Stamps/SNAP in the past 12 months: 7,985
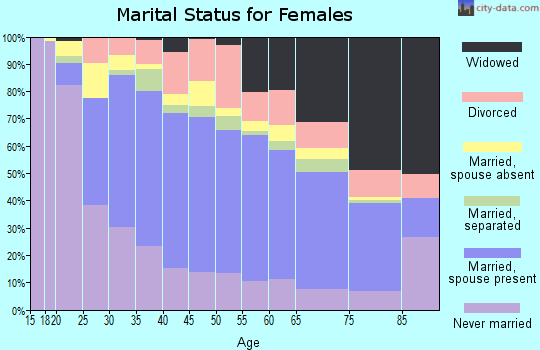
Women who had a birth in the past 12 months: 256 (140 now married, 117 unmarried) Women who did not have a birth in the past 12 months: 7,216 (3,220 now married, 3,967 unmarried)
Housing units in zip code 11417 with a mortgage: 3,329 (310 second mortgage, 201 both second mortgage and home equity loan) Median monthly owner costs for units with a mortgage: $3,067 Median monthly owner costs for units without a mortgage: $886
Residents with income below the poverty level in 2022:
This zip code:
11.4%
Whole state:
14.3%
Residents with income below 50% of the poverty level in 2022:
This zip code:
5.5%
Whole state:
6.8%
Median number of rooms in houses and condos:
Here:
5.7
State:
6.3
Median number of rooms in apartments:
Here:
4.4
State:
3.8
Notable locations in this zip code not listed on our city pages
Notable locations in zip code 11417: Ozone Park Branch Queens Borough Public Library (A), Fire Department New York Engine 285 Ladder 142 (B), New York Ladder Company 142 (C). Display/hide their locations on the map
Parks in zip code 11417 include: John Adams Playground (1), Wellbrook Triangle (2), Loring Field (3), Centreville Playground (4), Rocket Park (5), Tudor Park (6), Corporal Ruoff Square (7), Police Officer Nicholas Demutiis Playground (8). Display/hide their locations on the map
Tourist attraction (not listed on the city page) : ADL AUTO SCHOOL INC. (Tours & Charters; 104-05 107 ST).
3,955 married couples with children.
1,674 single-parent households (391 men, 1,283 women).
45.4% of residents of 11417 zip code speak English at home.
28.8% of residents speak Spanish at home (59% very well, 22% well, 16% not well, 3% not at all).
18.4% of residents speak other Indo-European language at home (64% very well, 23% well, 9% not well, 3% not at all).
6.4% of residents speak Asian or Pacific Island language at home (45% very well, 35% well, 15% not well, 5% not at all).
0.5% of residents speak other language at home (61% very well, 22% well, 18% not at all).
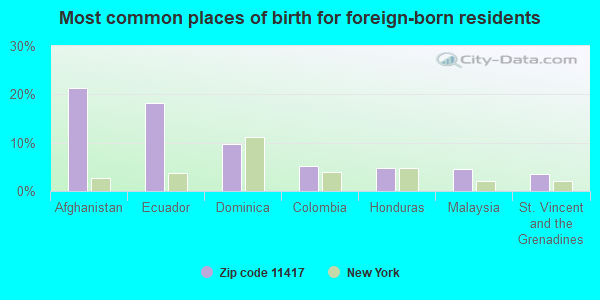
Foreign born population: 13,591 (44.3%) (69.0% of them are naturalized citizens)
This zip code:
44.3%
Whole state:
22.7%
21%Afghanistan
18%Ecuador
10%Dominica
5%Colombia
5%Honduras
5%Malaysia
4%St. Vincent and the Grenadines
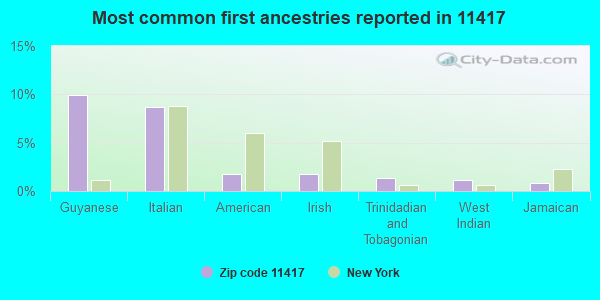
10%Guyanese
9%Italian
2%American
2%Irish
1%Trinidadian and Tobagonian
1%West Indian
1%Jamaican
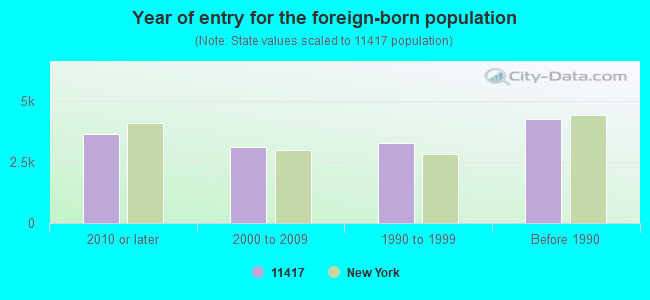
Year of entry for the foreign-born population
3,6702010 or later
3,1342000 to 2009
3,3031990 to 1999
4,276Before 1990
Public high schools in in zip code 11417 not listed on the city page:
Facilities with environmental interests located in this zip code:
CROWN NOVELTY WORKS CORPORATION (86-15 LIBERTY AVE. in OZONE PARK, NY)
AIR MINOR (AIRS/AFS) (Integrated Compliance Information System) - ICIS-02-1993-0028, FORMAL ENFORCEMENT ACTION COMPLIANCE ACTIVITY (Tracking inspections of insecticide, fungicide, and rodenticide, and toxic substances) TRI REPORTER (Tracking of toxic chemicals releasing facilities) Business SIC classification: NONFERROUS FOUNDRIES, EXCEPT ALUMINUM AND COPPER; BOLTS, NUTS, SCREWS, RIVETS, AND WASHERS
100-07 ROCKAWAY BLVD PETROLEUM (100-07 ROCKAWAY BLVD in OZONE PARK, NY)
AIR MINOR (AIRS/AFS) STATE MASTER (New York facility tracking) - AIR PROGRAM, Business SIC classification: GASOLINE SERVICE STATIONS Organizations: 100-07 ROCKAWAY PETROLEUM INC, RAKO MANAGEMENT CORP (LEGALLY RESPONSIBLE PARTY)
Alternative names: GULF, RAKO MGMT FACILITY
CROSS BAY CLEANERS (96-05 LIBERTY AVENUE in OZONE PARK, NY)
AIR MINOR (AIRS/AFS) STATE MASTER (New York facility tracking) - AIR PROGRAM, HAZARDOUS WASTE PROGRAM Small Quantity Generators, between 100 kg and 1000 kg of hazardous waste/month (Resource Conservation and Recovery Act (tracking hazardous waste)) - notification Business SIC classification: DRYCLEANING PLANTS, EXCEPT RUG CLEANING Business NAICS classification: DRYCLEANING AND LAUNDRY SERVICES (EXCEPT COIN-OPERATED). Organizations: MR SANG YUK SUH (CONTACT/OWNER)
Alternative names: CROSSBAY CLEANERS
BEST CLEANERS (135-03 CROSS BAY BLVD in OZONE PARK, NY)
AIR MINOR (AIRS/AFS) STATE MASTER (New York facility tracking) - AIR PROGRAM, HAZARDOUS WASTE PROGRAM Business SIC classification: DRYCLEANING PLANTS, EXCEPT RUG CLEANING Business NAICS classification: DRYCLEANING AND LAUNDRY SERVICES (EXCEPT COIN-OPERATED). Organizations: YOUNG SHIK SHIN (LEGALLY RESPONSIBLE PARTY)
AIRPORT CLEANERS (93-08 LINDEN BOULEVARD in OZONE PARK, NY)
(Resource Conservation and Recovery Act (tracking hazardous waste))
ALLSTAR SERVICES INC (88-35 PITKIN AVE in OZONE PARK, NY)
USED OIL PROGRAM (Resource Conservation and Recovery Act (tracking hazardous waste)) Organizations: AL CASSIANO (CONTACT/OPERATOR)
GETTY PETROLEUM CORP (98-21 ROCKAWAY BLVD in OZONE PARK, NY)
(Resource Conservation and Recovery Act (tracking hazardous waste)) Alternative names: GASOLINE STATION
CROSSKIN SERVICE STATION INC (90-71 PITKIN AVE in OZONE PARK, NY)
(Resource Conservation and Recovery Act (tracking hazardous waste))
BENNETT SCHOLEY RICE (98-08 ROCKAWAY BLVD in OZONE PARK, NY)
(Resource Conservation and Recovery Act (tracking hazardous waste))
CIARA AUTO BODY (86-25 LIBERTY AVE in OZONE PARK, NY)
(Resource Conservation and Recovery Act (tracking hazardous waste))
CLASSIC AUTOMOTIVE CRAFTS INC (113-04 ROCKAWAY BLVD in OZONE PARK, NY)
Small Quantity Generators, between 100 kg and 1000 kg of hazardous waste/month (Resource Conservation and Recovery Act (tracking hazardous waste)) - notification
Housing units lacking complete plumbing facilities: 0.9% Housing units lacking complete kitchen facilities: 0.7%
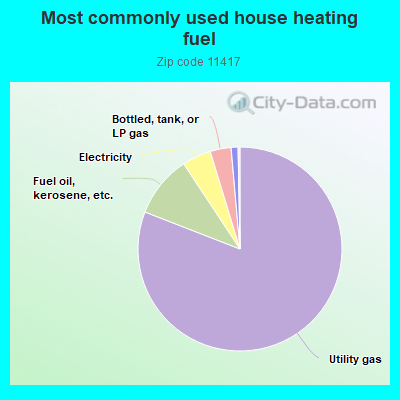
81.0%Utility gas
9.8%Fuel oil, kerosene, etc.
4.6%Electricity
3.3%Bottled, tank, or LP gas
1.1%No fuel used
Population in 1990: 22,768. Population change in the 1990s: +5,839 (+25.6%).
Place of birth for U.S.-born residents:
This state: 15,228
Northeast: 222
Midwest: 141
South: 432
West: 234
68% of the 11417 zip code residents lived in the same house 5 years ago. Out of people who lived in different houses, 72% lived in this county. Out of people who lived in different counties, 50% lived in New York.
93% of the 11417 zip code residents lived in the same house 1 year ago. Out of people who lived in different houses, 59% moved from this county. Out of people who lived in different houses, 23% moved from different county within same state. Out of people who lived in different houses, 8% moved from different state. Out of people who lived in different houses, 9% moved from abroad.
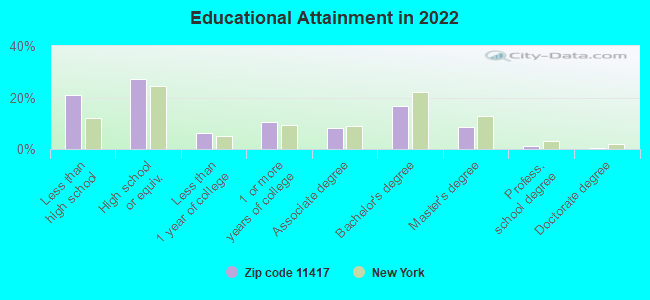
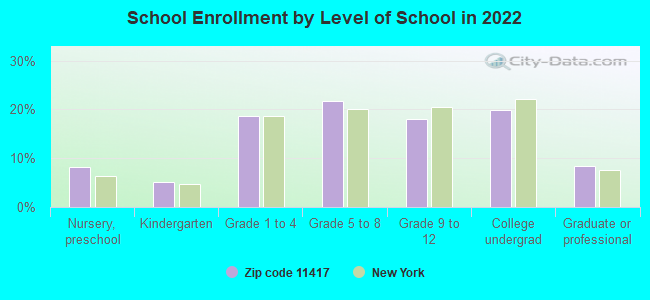
Private vs. public school enrollment:
Students in private schools in grades 1 to 8 (elementary and middle school): 181
Here:
5.6%
New York:
15.6%
Students in private schools in grades 9 to 12 (high school): 164
Here:
11.2%
New York:
15.0%
Students in private undergraduate colleges: 425
Here:
26.8%
New York:
39.2%
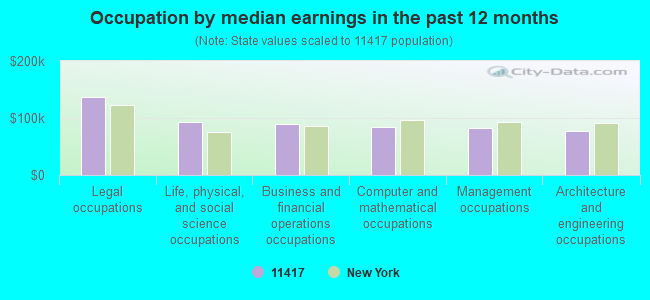
Occupation by median earnings in the past 12 months ($)
137,215Legal occupations
92,979Life, physical, and social science occupations
89,450Business and financial operations occupations
84,542Computer and mathematical occupations
82,631Management occupations
78,027Architecture and engineering occupations
Companies with federal contracts located in this zip code:
YOUR FURNITURE SOURCE INC (10615 77TH ST in OZONE PARK, NY; small business) : $13,718 in 2 contractsin 2005
$10,642 with Army for Office Furniture. Taking place in CA. Signed on 2005-03-24. Effective on 2005-03-11. Completion date: 2005-04-08.
$3,076 with Army for Office Furniture. Signed on 2005-05-06. Completion date: 2005-05-20.
Top industries in this zip code by the number of employees in 2005:
Arts, Entertainment, and Recreation: Racetracks (500-999 employees: 1 establishment)
Construction: Poured Concrete Foundation and Structure Contractors (250-499: 1, 5-9: 1)
Administrative and Support and Waste Management and Remediation Services: Other Services to Buildings and Dwellings (250-499: 1, 1-4: 1)
2007 - 2018 National Fire Incident Reporting System (NFIRS) incidents
According to the data from the years 2007 - 2018 the average number of fire incidents per year is 100. The highest number of reported fires - 122 took place in 2014, and the least - 61 in 2007. The data has a rising trend.
When looking into fire subcategories, the most incidents belonged to: Structure Fires (59.6%), and Outside Fires (21.0%).
Fire incident types reported to NFIRS in Zip Code 11417


 Nearest zip codes: 11416, 11414, 11421, 11419, 11418, 11420.


 (Students: 3,252, Location: 101-01 ROCKAWAY BLVD, Grades: 9-12)

 According to the data from the years 2007 - 2018 the average number of fire incidents per year is 100. The highest number of reported fires - 122 took place in 2014, and the least - 61 in 2007. The data has a rising trend.
 When looking into fire subcategories, the most incidents belonged to: Structure Fires (59.6%), and Outside Fires (21.0%).