Estimated zip code population in 2022: 29,892 Zip code population in 2010: 26,148 Zip code population in 2000: 28,121
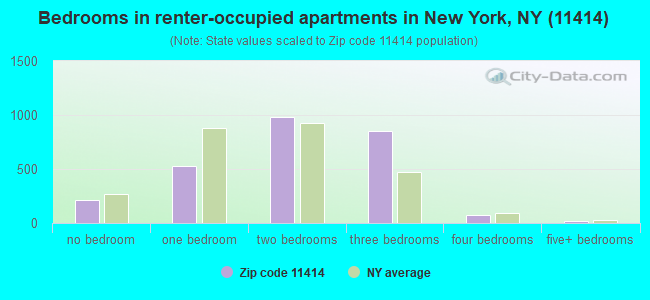
Houses and condos: 12,278 Renter-occupied apartments: 2,672
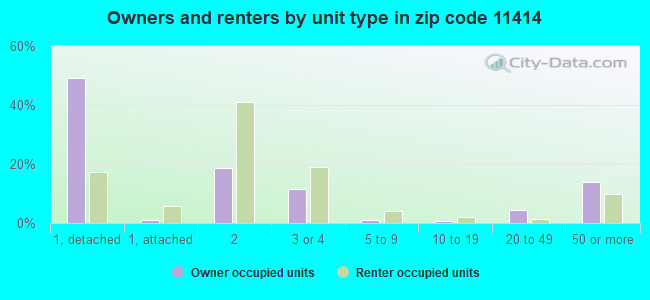
% of renters here:
23%
State:
46%
March 2022 cost of living index in zip code 11414: 148.1 (very high, U.S. average is 100)
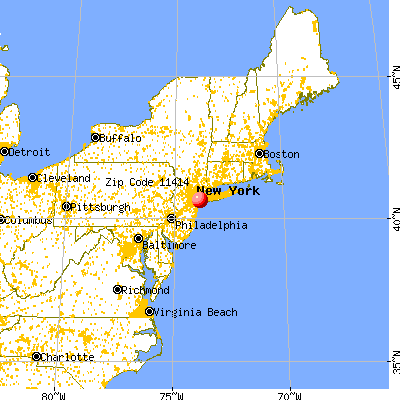
Land area: 2.3 sq. mi. Water area: 0.1 sq. mi.
Population density: 12,998 people per square mile
(very high).
OSM Map
General Map
Google Map
MSN Map
OSM Map
General Map
Google Map
MSN Map
OSM Map
General Map
Google Map
MSN Map
OSM Map
General Map
Google Map
MSN Map
Please wait while loading the map...
Real estate property taxes paid for housing units in 2022:
This zip code:
1.0% ($5,997)
New York:
1.5% ($6,180)
Median real estate property taxes paid for housing units with mortgages in 2022: $6,096 (0.9%) Median real estate property taxes paid for housing units with no mortgage in 2022: $5,854 (1.0%)
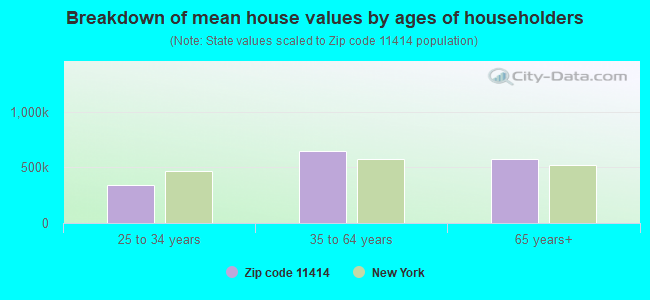
Estimated median house/condo value in 2022: $621,605
11414:
$621,605
New York:
$400,400
According to our research of New York and other state lists, there were 12 registered sex offenders living in 11414 zip code as of April 27, 2024. The ratio of all residents to sex offenders in zip code 11414 is 2,388 to 1. The ratio of registered sex offenders to all residents in this zip code is much lower than the state average.
Median resident age:
This zip code:
46.7 years
New York median age:
40.0 years
Average household size:
This zip code:
2.6 people
New York:
2.5 people
Averages for the 2020 tax year for zip code 11414, filed in 2021:
Average Adjusted Gross Income (AGI) in 2020: $75,457 (Individual Income Tax Returns)
Here:
$75,457
State:
$90,930
Salary/wage: $66,142 (reported on 76.5% of returns)
Here:
$66,142
State:
$72,104
(% of AGI for various income ranges: 922.4% for AGIs below $25k, 3261.8% for AGIs $25k-50k, 6372.8% for AGIs $50k-75k, 9545.3% for AGIs $75k-100k, 17261.8% for AGIs $100k-200k, 58101.7% for AGIs over 200k)
Taxable interest for individuals: $1,920 (reported on 41.7% of returns)
This zip code:
$1,920
New York:
$3,075
(% of AGI for various income ranges: 47.7% for AGIs below $25k, 40.0% for AGIs $25k-50k, 65.6% for AGIs $50k-75k, 111.9% for AGIs $75k-100k, 195.8% for AGIs $100k-200k, 1654.3% for AGIs over 200k)
Ordinary dividends: $4,341 (reported on 23.5% of returns)
Here:
$4,341
State:
$11,095
(% of AGI for various income ranges: 54.3% for AGIs below $25k, 62.1% for AGIs $25k-50k, 92.2% for AGIs $50k-75k, 160.6% for AGIs $75k-100k, 258.7% for AGIs $100k-200k, 1854.8% for AGIs over 200k)
Net capital gain/loss in AGI: +$14,280 (reported on 21.2% of returns)
Here:
+$14,280
State:
+$44,925
(% of AGI for various income ranges: 9.6% for AGIs below $25k, 33.2% for AGIs $25k-50k, 65.3% for AGIs $50k-75k, 155.4% for AGIs $75k-100k, 374.4% for AGIs $100k-200k, 13975.2% for AGIs over 200k)
Profit/loss from business: +$10,226 (reported on 12.6% of returns)
Here:
+$10,226
State:
+$14,940
(% of AGI for various income ranges: 161.7% for AGIs below $25k, 144.4% for AGIs $25k-50k, 129.8% for AGIs $50k-75k, 119.2% for AGIs $75k-100k, 254.2% for AGIs $100k-200k, 1678.3% for AGIs over 200k)
Taxable individual retirement arrangement distribution: $14,145 (reported on 9.5% of returns)
11414:
$14,145
New York:
$19,609
(% of AGI for various income ranges: 82.7% for AGIs below $25k, 119.4% for AGIs $25k-50k, 141.7% for AGIs $50k-75k, 250.4% for AGIs $75k-100k, 428.6% for AGIs $100k-200k, 1078.7% for AGIs over 200k)
Self-employed (Keogh) retirement plans: $15,140 (reported on 0.4% of returns)
11414:
$15,140
New York:
$32,497
(% of AGI for various income ranges: 49.5% for AGIs $100k-200k)
Total itemized deductions: $26,762 (reported on 15.0% of returns)
Here:
$26,762
State:
$39,326
(% of AGI for various income ranges: 96.8% for AGIs below $25k, 231.7% for AGIs $25k-50k, 427.2% for AGIs $50k-75k, 760.2% for AGIs $75k-100k, 1460.9% for AGIs $100k-200k, 4565.7% for AGIs over 200k)
Charity contributions: $4,047 (reported on 13.0% of returns)
Here:
$4,047
State:
$15,420
(% of AGI for various income ranges: 5.5% for AGIs below $25k, 22.7% for AGIs $25k-50k, 45.6% for AGIs $50k-75k, 97.2% for AGIs $75k-100k, 206.7% for AGIs $100k-200k, 727.0% for AGIs over 200k)
Taxes paid: $9,029 (reported on 15.0% of returns)
11414:
$9,029
State:
$9,183
(% of AGI for various income ranges: 26.5% for AGIs below $25k, 75.9% for AGIs $25k-50k, 145.2% for AGIs $50k-75k, 295.2% for AGIs $75k-100k, 528.6% for AGIs $100k-200k, 1186.1% for AGIs over 200k)
Earned income credit: $1,789 (reported on 9.8% of returns)
Here:
$1,789
State:
$2,138
(% of AGI for various income ranges: 64.5% for AGIs below $25k, 48.8% for AGIs $25k-50k)
Percentage of individuals using paid preparers for their 2020 taxes: 95.0%
Here:
95%
State:
95%
(% for various income ranges: 93.5% for AGIs below $25k, 95.7% for AGIs $25k-50k, 94.8% for AGIs $50k-75k, 96.4% for AGIs $75k-100k, 95.4% for AGIs $100k-200k, 95.5% for AGIs over 200k)
Averages for the 2012 tax year for zip code 11414, filed in 2013:
Average Adjusted Gross Income (AGI) in 2012: $62,800 (Individual Income Tax Returns)
Here:
$62,800
State:
$77,088
Salary/wage: $57,787 (reported on 77.6% of returns)
Here:
$57,787
State:
$60,593
(% of AGI for various income ranges: 55.6% for AGIs below $25k, 71.8% for AGIs $25k-50k, 75.5% for AGIs $50k-75k, 73.8% for AGIs $75k-100k, 75.7% for AGIs $100k-200k, 61.2% for AGIs over 200k)
Taxable interest for individuals: $1,491 (reported on 50.9% of returns)
This zip code:
$1,491
New York:
$3,125
(% of AGI for various income ranges: 2.8% for AGIs below $25k, 1.3% for AGIs $25k-50k, 1.0% for AGIs $50k-75k, 0.9% for AGIs $75k-100k, 0.9% for AGIs $100k-200k, 1.7% for AGIs over 200k)
Ordinary dividends: $3,248 (reported on 26.2% of returns)
Here:
$3,248
State:
$10,299
(% of AGI for various income ranges: 3.0% for AGIs below $25k, 1.2% for AGIs $25k-50k, 1.3% for AGIs $50k-75k, 1.2% for AGIs $75k-100k, 1.2% for AGIs $100k-200k, 1.5% for AGIs over 200k)
Net capital gain/loss in AGI: +$4,672 (reported on 20.0% of returns)
Here:
+$4,672
State:
+$42,474
(% of AGI for various income ranges: 0.2% for AGIs $75k-100k, 0.7% for AGIs $100k-200k, 8.6% for AGIs over 200k)
Profit/loss from business: +$13,733 (reported on 11.6% of returns)
Here:
+$13,733
State:
+$16,168
(% of AGI for various income ranges: 11.1% for AGIs below $25k, 3.0% for AGIs $25k-50k, 1.8% for AGIs $50k-75k, 1.3% for AGIs $75k-100k, 1.6% for AGIs $100k-200k, 2.9% for AGIs over 200k)
Taxable individual retirement arrangement distribution: $11,979 (reported on 13.1% of returns)
11414:
$11,979
New York:
$17,621
(% of AGI for various income ranges: 4.9% for AGIs below $25k, 2.9% for AGIs $25k-50k, 2.4% for AGIs $50k-75k, 2.7% for AGIs $75k-100k, 2.3% for AGIs $100k-200k, 1.6% for AGIs over 200k)
Self-employment retirement plans: $16,140 (reported on 0.4% of returns)
11414:
$16,140
New York:
$27,330
Total itemized deductions: $33,076 (36% of AGI, reported on 53.0% of returns)
Here:
$33,076
State:
$34,985
Here:
36.0% of AGI
State:
21.3% of AGI
(% of AGI for various income ranges: 33.4% for AGIs below $25k, 26.5% for AGIs $25k-50k, 28.5% for AGIs $50k-75k, 28.6% for AGIs $75k-100k, 29.4% for AGIs $100k-200k, 22.5% for AGIs over 200k)
Charity contributions: $2,215 (reported on 46.4% of returns)
Here:
$2,215
State:
$5,572
(% of AGI for various income ranges: 1.1% for AGIs below $25k, 1.7% for AGIs $25k-50k, 2.0% for AGIs $50k-75k, 1.8% for AGIs $75k-100k, 1.6% for AGIs $100k-200k, 1.3% for AGIs over 200k)
Taxes paid: $10,579 (reported on 52.7% of returns)
11414:
$10,579
State:
$18,656
(% of AGI for various income ranges: 5.2% for AGIs below $25k, 5.9% for AGIs $25k-50k, 8.0% for AGIs $50k-75k, 9.2% for AGIs $75k-100k, 10.1% for AGIs $100k-200k, 10.7% for AGIs over 200k)
Earned income credit: $2,006 (reported on 10.5% of returns)
Here:
$2,006
State:
$2,230
(% of AGI for various income ranges: 4.5% for AGIs below $25k, 0.5% for AGIs $25k-50k)
Percentage of individuals using paid preparers for their 2012 taxes: 77.1%
Here:
77%
State:
66%
(% for various income ranges: 73.8% for AGIs below $25k, 75.1% for AGIs $25k-50k, 77.8% for AGIs $50k-75k, 80.8% for AGIs $75k-100k, 82.0% for AGIs $100k-200k, 83.3% for AGIs over 200k)
Averages for the 2004 tax year for zip code 11414, filed in 2005:
Average Adjusted Gross Income (AGI) in 2004: $51,667 (Individual Income Tax Returns)
Here:
$51,667
State:
$59,519
Salary/wage: $49,332 (reported on 77.2% of returns)
Here:
$49,332
State:
$50,673
(% of AGI for various income ranges: 147.2% for AGIs below $10k, 58.3% for AGIs $10k-25k, 77.4% for AGIs $25k-50k, 79.7% for AGIs $50k-75k, 79.2% for AGIs $75k-100k, 67.1% for AGIs over 100k)
Taxable interest for individuals: $1,816 (reported on 65.9% of returns)
This zip code:
$1,816
New York:
$2,377
(% of AGI for various income ranges: 28.0% for AGIs below $10k, 4.7% for AGIs $10k-25k, 2.4% for AGIs $25k-50k, 1.8% for AGIs $50k-75k, 1.6% for AGIs $75k-100k, 2.0% for AGIs over 100k)
Taxable dividends: $2,149 (reported on 32.3% of returns)
Here:
$2,149
State:
$5,394
(% of AGI for various income ranges: 17.0% for AGIs below $10k, 2.6% for AGIs $10k-25k, 1.3% for AGIs $25k-50k, 1.1% for AGIs $50k-75k, 1.0% for AGIs $75k-100k, 1.2% for AGIs over 100k)
Net capital gain/loss: +$8,476 (reported on 26.9% of returns)
Here:
+$8,476
State:
+$23,581
(% of AGI for various income ranges: -12.2% for AGIs below $10k, -0.3% for AGIs $10k-25k, -0.1% for AGIs $25k-50k, 0.7% for AGIs $50k-75k, 0.9% for AGIs $75k-100k, 11.7% for AGIs over 100k)
Profit/loss from business: +$11,295 (reported on 11.4% of returns)
Here:
+$11,295
State:
+$13,809
(% of AGI for various income ranges: 24.4% for AGIs below $10k, 7.3% for AGIs $10k-25k, 1.9% for AGIs $25k-50k, 1.5% for AGIs $50k-75k, 1.8% for AGIs $75k-100k, 2.5% for AGIs over 100k)
IRA payment deduction: $3,342 (reported on 4.1% of returns)
11414:
$3,342
New York:
$3,115
(% of AGI for various income ranges: 1.0% for AGIs below $10k, 0.4% for AGIs $10k-25k, 0.4% for AGIs $25k-50k, 0.3% for AGIs $50k-75k, 0.2% for AGIs $75k-100k, 0.1% for AGIs over 100k)
Self-employed pension: $10,459 (reported on 0.7% of returns)
Here:
$10,459
New York:
$19,016
(% of AGI for various income ranges: 0.1% for AGIs $25k-50k, 0.1% for AGIs $50k-75k, 0.1% for AGIs $75k-100k, 0.2% for AGIs over 100k)
Total itemized deductions: $19,684 (25% of AGI, reported on 51.4% of returns)
Here:
$19,684
State:
$25,864
Here:
25.4% of AGI
State:
21.9% of AGI
(% of AGI for various income ranges: 38.2% for AGIs below $10k, 16.3% for AGIs $10k-25k, 19.6% for AGIs $25k-50k, 21.9% for AGIs $50k-75k, 20.5% for AGIs $75k-100k, 18.0% for AGIs over 100k)
Charity contributions deductions: $2,526 (3% of AGI, reported on 48.9% of returns)
Here:
$2,526
State:
$4,439
Here:
3.2% of AGI
State:
3.6% of AGI
(% of AGI for various income ranges: 1.9% for AGIs below $10k, 1.6% for AGIs $10k-25k, 2.7% for AGIs $25k-50k, 2.8% for AGIs $50k-75k, 2.6% for AGIs $75k-100k, 2.1% for AGIs over 100k)
Total tax: $7,454 (reported on 79.7% of returns)
11414:
$7,454
State:
$11,730
(% of AGI for various income ranges: 5.7% for AGIs below $10k, 4.1% for AGIs $10k-25k, 7.1% for AGIs $25k-50k, 9.5% for AGIs $50k-75k, 10.8% for AGIs $75k-100k, 16.7% for AGIs over 100k)
Earned income credit: $1,505 (reported on 7.9% of returns)
Here:
$1,505
State:
$1,757
Percentage of individuals using paid preparers for their 2004 taxes: 75.0%
Here:
75%
State:
67%
(% for various income ranges: 70.1% for AGIs below $10k, 72.3% for AGIs $10k-25k, 74.6% for AGIs $25k-50k, 77.6% for AGIs $50k-75k, 77.8% for AGIs $75k-100k, 81.5% for AGIs over 100k)
Likely homosexual households (counted as self-reported same-sex unmarried-partner households)
Lesbian couples: 0.1% of all households
Gay men: 0.2% of all households
Household received Food Stamps/SNAP in the past 12 months: 1,174 Household did not receive Food Stamps/SNAP in the past 12 months: 10,396
Women who had a birth in the past 12 months: 226 (149 now married, 77 unmarried) Women who did not have a birth in the past 12 months: 5,146 (2,400 now married, 2,720 unmarried)
Housing units in zip code 11414 with a mortgage: 4,863 (401 second mortgage, 25 home equity loan, 335 both second mortgage and home equity loan) Houses without a mortgage: 99
Median monthly owner costs for units with a mortgage: $2,895 Median monthly owner costs for units without a mortgage: $1,144
Residents with income below the poverty level in 2022:
This zip code:
6.4%
Whole state:
14.3%
Residents with income below 50% of the poverty level in 2022:
This zip code:
3.5%
Whole state:
6.8%
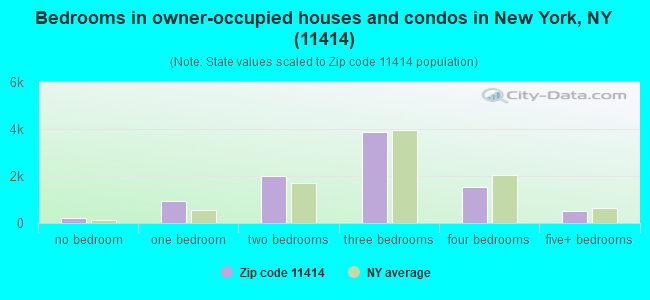
Median number of rooms in houses and condos:
Here:
5.7
State:
6.3
Median number of rooms in apartments:
Here:
4.5
State:
3.8
Notable locations in this zip code not listed on our city pages
Notable locations in zip code 11414: West Hamilton Beach Fire Department Engine Company 1 (A), Howard Beach Branch Queens Borough Public Library (B), Fire Department New York Engine 331 Ladder 173 (C), New York Ladder Company 173 (D). Display/hide their locations on the map
Parks in zip code 11414 include: Sutter Green (1), Harold Schneiderman Playground (2), Walter Ward Playground (3), Frank M Charles Memorial Park (4). Display/hide their locations on the map
In group quarters: 18 (-1 institutionalized population)
Size of family households: 3,044 2-persons, 1,498 3-persons, 1,578 4-persons, 738 5-persons, 472 6-persons, 92 7-or-more-persons
Size of nonfamily households: 3,651 1-person, 550 2-persons
4,530 married couples with children.
1,149 single-parent households (83 men, 1,066 women).
62.7% of residents of 11414 zip code speak English at home.
16.4% of residents speak Spanish at home (64% very well, 22% well, 11% not well, 3% not at all).
16.7% of residents speak other Indo-European language at home (80% very well, 13% well, 6% not well, 1% not at all).
3.7% of residents speak Asian or Pacific Island language at home (96% very well, 4% not well).
0.8% of residents speak other language at home (59% very well, 41% well).
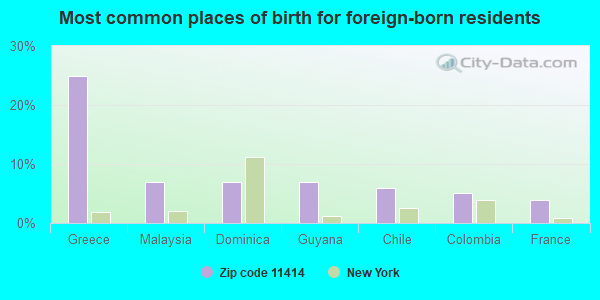
Foreign born population: 5,988 (20.0%) (86.2% of them are naturalized citizens)
This zip code:
20.0%
Whole state:
22.7%
25%Greece
7%Malaysia
7%Dominica
7%Guyana
6%Chile
5%Colombia
4%France
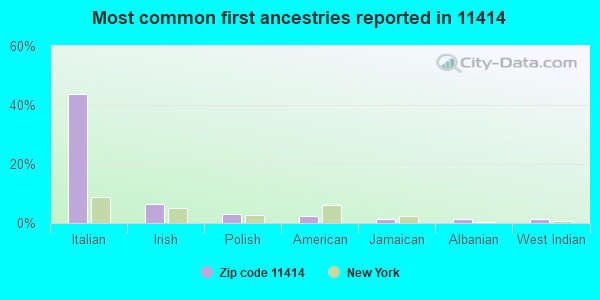
44%Italian
6%Irish
3%Polish
2%American
1%Jamaican
1%Albanian
1%West Indian
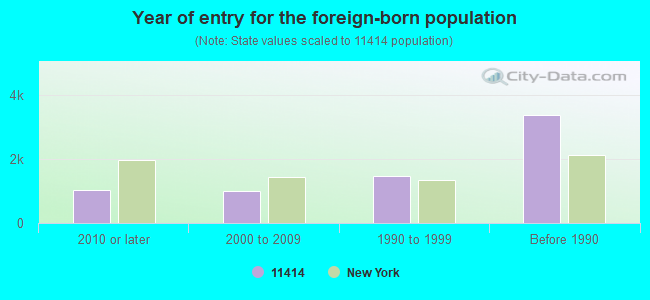
Year of entry for the foreign-born population
1,0162010 or later
1,0032000 to 2009
1,4721990 to 1999
3,376Before 1990
Facilities with environmental interests located in this zip code:
CONTINENTAL VALET CLEANERS (82-15 153RD AVE in HOWARD BEACH, NY)
AIR MINOR (AIRS/AFS) STATE MASTER (New York facility tracking) - AIR PROGRAM, HAZARDOUS WASTE PROGRAM Small Quantity Generators, between 100 kg and 1000 kg of hazardous waste/month (Resource Conservation and Recovery Act (tracking hazardous waste)) - notification Business SIC classification: DRYCLEANING PLANTS, EXCEPT RUG CLEANING Business NAICS classification: DRYCLEANING AND LAUNDRY SERVICES (EXCEPT COIN-OPERATED). Organizations: CHANG KYU KIM (CONTACT/OWNER)
, JM & BK INC (LEGALLY RESPONSIBLE PARTY)
AMOCO OIL CORPORATION (163-01 CROSSBAY BOULEVARD in HOWARD BEACH, NY)
AIR MINOR (AIRS/AFS) Small Quantity Generators, between 100 kg and 1000 kg of hazardous waste/month (Resource Conservation and Recovery Act (tracking hazardous waste)) - notification USED OIL PROGRAM (Resource Conservation and Recovery Act (tracking hazardous waste)) Business SIC classification: GASOLINE SERVICE STATIONS Organizations: SPARTAN PETROLEUM (CONTACT/OWNER)
Alternative names: JAMES KOLM, ON THE BAY AMOCO, ON THE BAY AMOCO
AMOCO SERVICE STATION 4364 (162-02 CROSSBAY BOULEVARD in HOWARD BEACH, NY)
AIR MINOR (AIRS/AFS) (Resource Conservation and Recovery Act (tracking hazardous waste)) Business SIC classification: GASOLINE SERVICE STATIONS Alternative names: AMOCO-4364, CROSSBAY SERVICE STATION
HOWARD PARK DRIVE IN CLEANERS (159-26 CROSS BAY BOULEVARD in HOWARD BEACH, NY)
AIR MINOR (AIRS/AFS) Small Quantity Generators, between 100 kg and 1000 kg of hazardous waste/month (Resource Conservation and Recovery Act (tracking hazardous waste)) Small Quantity Generators, between 100 kg and 1000 kg of hazardous waste/month (Resource Conservation and Recovery Act (tracking hazardous waste)) - notification Business SIC classification: DRYCLEANING PLANTS, EXCEPT RUG CLEANING Organizations: HWA-YUP LEE (CONTACT/OWNER)
GETTY SERVICE STATION 00181 (161-15 CROSSBAY BOULEVARD in HOWARD BEACH, NY)
AIR MINOR (AIRS/AFS) Small Quantity Generators, between 100 kg and 1000 kg of hazardous waste/month (Resource Conservation and Recovery Act (tracking hazardous waste)) Business SIC classification: GASOLINE SERVICE STATIONS Alternative names: GETTY REALTY CORP 00181, POWER TEST-GETTY
HESS #32582 (159-04 CROSS BAY BLVD in HOWARD BEACH, NY)
AIR MINOR (AIRS/AFS) Business SIC classification: GASOLINE SERVICE STATIONS Alternative names: SHELL station
I U O E LOCAL 15 APPRENTISES HIP FUND (S END OF LEFFERTS BLVD in HOWARD BEACH, NY)
(Resource Conservation and Recovery Act (tracking hazardous waste))
HOWARD BEACH TERMINAL (150-99 LEFFERTS BOULEVARD in HOWARD BEACH, NY)
OIL CONTROL (Facility Response Plan for oil discharge) Organizations: LEFFERTS OIL TERMINAL, INC. (CONTACT/GENERAL)
31-30 138TH STREET BUILDING (31-30 138TH ST in QUEENS, NY)
AIR SYNTHETIC MINOR (AIRS/AFS) Business SIC classification: OPERATORS OF APARTMENT BUILDINGS
Housing units lacking complete kitchen facilities: 0.1%
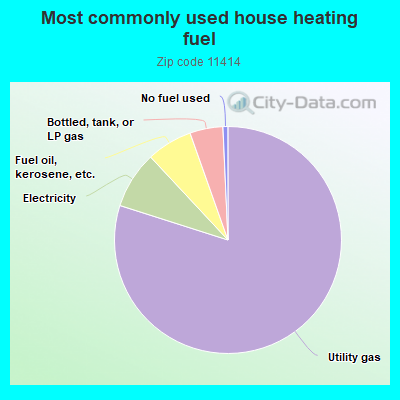
79.6%Utility gas
8.1%Electricity
6.5%Fuel oil, kerosene, etc.
4.7%Bottled, tank, or LP gas
0.7%No fuel used
Population in 1990: 27,256. Population change in the 1990s: +865 (+3.2%).
Place of birth for U.S.-born residents:
This state: 21,678
Northeast: 371
Midwest: 75
South: 544
West: 106
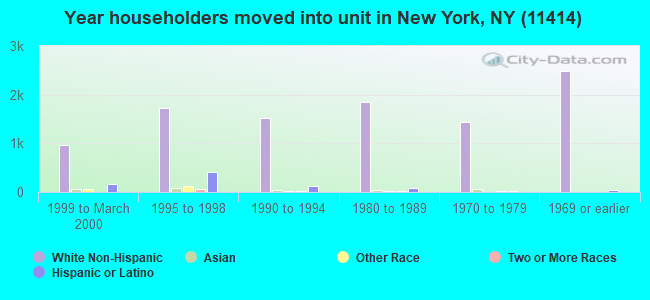
74% of the 11414 zip code residents lived in the same house 5 years ago. Out of people who lived in different houses, 69% lived in this county. Out of people who lived in different counties, 50% lived in New York.
94% of the 11414 zip code residents lived in the same house 1 year ago. Out of people who lived in different houses, 59% moved from this county. Out of people who lived in different houses, 14% moved from different county within same state. Out of people who lived in different houses, 19% moved from different state. Out of people who lived in different houses, 8% moved from abroad.
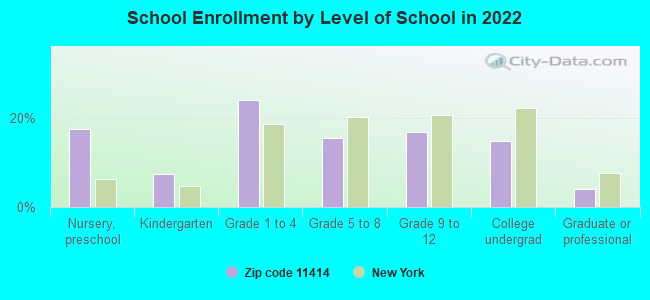
Private vs. public school enrollment:
Students in private schools in grades 1 to 8 (elementary and middle school): 286
Here:
11.2%
New York:
15.6%
Students in private schools in grades 9 to 12 (high school): 301
Here:
28.0%
New York:
15.0%
Students in private undergraduate colleges: 172
Here:
18.4%
New York:
39.2%
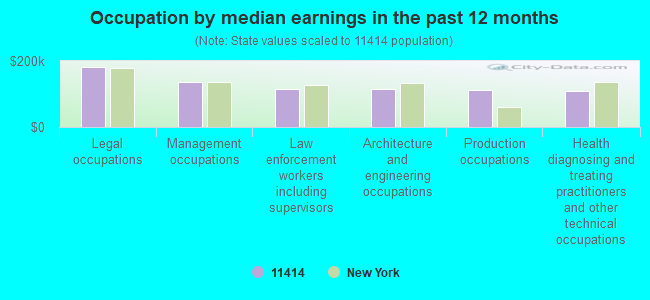
Occupation by median earnings in the past 12 months ($)
182,312Legal occupations
137,515Management occupations
115,361Law enforcement workers including supervisors
114,480Architecture and engineering occupations
111,418Production occupations
110,450Health diagnosing and treating practitioners and other technical occupations
Top industries in this zip code by the number of employees in 2005:
2007 - 2018 National Fire Incident Reporting System (NFIRS) incidents
According to the data from the years 2007 - 2018 the average number of fire incidents per year is 133. The highest number of reported fires - 157 took place in 2010, and the least - 53 in 2007. The data has an increasing trend.
When looking into fire subcategories, the most reports belonged to: Structure Fires (50.1%), and Outside Fires (32.0%).
Fire incident types reported to NFIRS in Zip Code 11414


 Nearest zip codes: 11417, 11416, 11208, 11420, 11239, 11419.


 According to the data from the years 2007 - 2018 the average number of fire incidents per year is 133. The highest number of reported fires - 157 took place in 2010, and the least - 53 in 2007. The data has an increasing trend.
 When looking into fire subcategories, the most reports belonged to: Structure Fires (50.1%), and Outside Fires (32.0%).