Estimated zip code population in 2022: 16,541 Zip code population in 2010: 13,393 Zip code population in 2000: 14,620
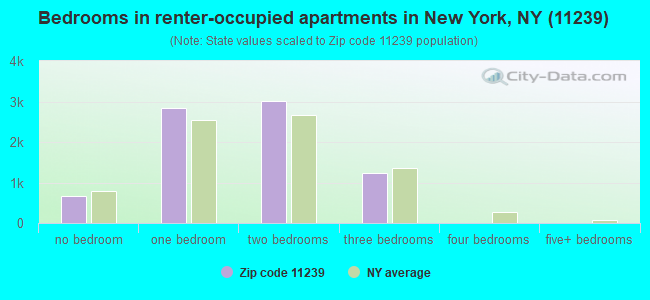
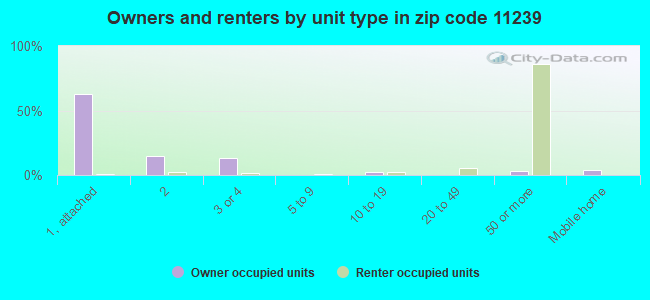
Houses and condos: 8,831 Renter-occupied apartments: 7,724
% of renters here:
90%
State:
46%
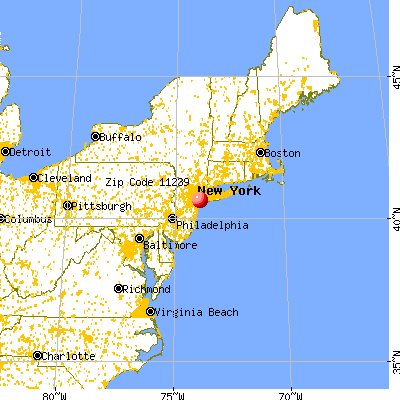
March 2022 cost of living index in zip code 11239: 154.2 (very high, U.S. average is 100)
Land area: 0.6 sq. mi. Water area: 0.0 sq. mi.
Population density: 28,304 people per square mile
(very high).
OSM Map
General Map
Google Map
MSN Map
OSM Map
General Map
Google Map
MSN Map
OSM Map
General Map
Google Map
MSN Map
OSM Map
General Map
Google Map
MSN Map
Please wait while loading the map...
Real estate property taxes paid for housing units in 2022:
This zip code:
0.5% ($2,242)
New York:
1.5% ($6,180)
Median real estate property taxes paid for housing units with mortgages in 2022: $2,042 (0.4%) Median real estate property taxes paid for housing units with no mortgage in 2022: $2,633 (0.6%)
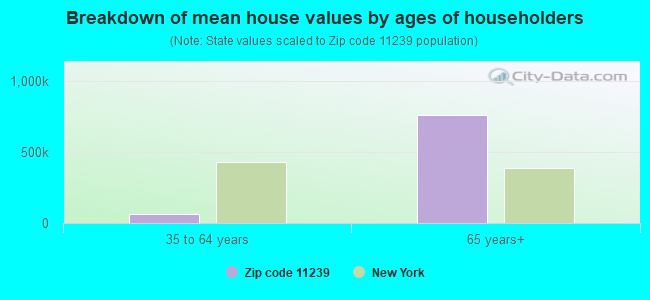
Estimated median house/condo value in 2022: $487,443
11239:
$487,443
New York:
$400,400
According to our research of New York and other state lists, there were 16 registered sex offenders living in 11239 zip code as of April 27, 2024. The ratio of all residents to sex offenders in zip code 11239 is 790 to 1. The ratio of registered sex offenders to all residents in this zip code is near the state average.
Median resident age:
This zip code:
46.5 years
New York median age:
40.0 years
Average household size:
This zip code:
1.9 people
New York:
2.5 people
Averages for the 2020 tax year for zip code 11239, filed in 2021:
Average Adjusted Gross Income (AGI) in 2020: $42,869 (Individual Income Tax Returns)
Here:
$42,869
State:
$90,930
Salary/wage: $41,584 (reported on 84.4% of returns)
Here:
$41,584
State:
$72,104
(% of AGI for various income ranges: 905.9% for AGIs below $25k, 3572.3% for AGIs $25k-50k, 6825.1% for AGIs $50k-75k, 10805.5% for AGIs $75k-100k, 15130.9% for AGIs $100k-200k)
Taxable interest for individuals: $237 (reported on 13.4% of returns)
This zip code:
$237
New York:
$3,075
(% of AGI for various income ranges: 2.2% for AGIs below $25k, 2.9% for AGIs $25k-50k, 3.4% for AGIs $50k-75k, 11.0% for AGIs $75k-100k, 16.4% for AGIs $100k-200k)
Ordinary dividends: $675 (reported on 4.3% of returns)
Here:
$675
State:
$11,095
(% of AGI for various income ranges: 1.2% for AGIs below $25k, 1.5% for AGIs $25k-50k, 6.2% for AGIs $50k-75k, 6.9% for AGIs $75k-100k, 21.8% for AGIs $100k-200k)
Net capital gain/loss in AGI: +$622 (reported on 4.9% of returns)
Here:
+$622
State:
+$44,925
(% of AGI for various income ranges: 8.2% for AGIs $50k-75k, 23.7% for AGIs $75k-100k, 34.5% for AGIs $100k-200k)
Profit/loss from business: +$1,551 (reported on 10.3% of returns)
Here:
+$1,551
State:
+$14,940
(% of AGI for various income ranges: 70.7% for AGIs below $25k, 7.6% for AGIs $25k-50k, 53.9% for AGIs $100k-200k)
Taxable individual retirement arrangement distribution: $9,924 (reported on 2.0% of returns)
11239:
$9,924
New York:
$19,609
(% of AGI for various income ranges: 19.5% for AGIs below $25k, 17.9% for AGIs $25k-50k, 35.5% for AGIs $50k-75k, 131.8% for AGIs $100k-200k)
Total itemized deductions: $22,150 (reported on 5.3% of returns)
Here:
$22,150
State:
$39,326
(% of AGI for various income ranges: 17.7% for AGIs below $25k, 42.2% for AGIs $25k-50k, 184.1% for AGIs $50k-75k, 592.7% for AGIs $75k-100k, 958.2% for AGIs $100k-200k)
Charity contributions: $6,589 (reported on 4.3% of returns)
Here:
$6,589
State:
$15,420
(% of AGI for various income ranges: 11.2% for AGIs $25k-50k, 43.4% for AGIs $50k-75k, 142.2% for AGIs $75k-100k, 263.9% for AGIs $100k-200k)
Taxes paid: $8,030 (reported on 5.2% of returns)
11239:
$8,030
State:
$9,183
(% of AGI for various income ranges: 14.0% for AGIs $25k-50k, 61.1% for AGIs $50k-75k, 226.9% for AGIs $75k-100k, 376.4% for AGIs $100k-200k)
Earned income credit: $1,985 (reported on 21.4% of returns)
Here:
$1,985
State:
$2,138
(% of AGI for various income ranges: 95.0% for AGIs below $25k, 66.5% for AGIs $25k-50k)
Percentage of individuals using paid preparers for their 2020 taxes: 94.1%
Here:
94%
State:
95%
(% for various income ranges: 93.2% for AGIs below $25k, 94.6% for AGIs $25k-50k, 94.8% for AGIs $50k-75k, 94.4% for AGIs $75k-100k, 93.6% for AGIs $100k-200k, 100.0% for AGIs over 200k)
Averages for the 2012 tax year for zip code 11239, filed in 2013:
Average Adjusted Gross Income (AGI) in 2012: $36,456 (Individual Income Tax Returns)
Here:
$36,456
State:
$77,088
Salary/wage: $36,525 (reported on 86.5% of returns)
Here:
$36,525
State:
$60,593
(% of AGI for various income ranges: 68.5% for AGIs below $25k, 90.3% for AGIs $25k-50k, 90.7% for AGIs $50k-75k, 91.6% for AGIs $75k-100k, 82.3% for AGIs $100k-200k)
Taxable interest for individuals: $269 (reported on 17.7% of returns)
This zip code:
$269
New York:
$3,125
(% of AGI for various income ranges: 0.3% for AGIs below $25k, 0.1% for AGIs $25k-50k, 0.1% for AGIs $100k-200k)
Ordinary dividends: $587 (reported on 4.5% of returns)
Here:
$587
State:
$10,299
(% of AGI for various income ranges: 0.1% for AGIs below $25k)
Profit/loss from business: +$5,021 (reported on 10.1% of returns)
Here:
+$5,021
State:
+$16,168
(% of AGI for various income ranges: 9.3% for AGIs below $25k, 0.1% for AGIs $25k-50k, 0.2% for AGIs $50k-75k)
Taxable individual retirement arrangement distribution: $9,879 (reported on 2.9% of returns)
11239:
$9,879
New York:
$17,621
(% of AGI for various income ranges: 0.9% for AGIs below $25k, 0.6% for AGIs $25k-50k, 0.7% for AGIs $50k-75k, 1.8% for AGIs $75k-100k)
Total itemized deductions: $16,538 (26% of AGI, reported on 27.5% of returns)
Here:
$16,538
State:
$34,985
Here:
26.3% of AGI
State:
21.3% of AGI
(% of AGI for various income ranges: 4.4% for AGIs below $25k, 9.9% for AGIs $25k-50k, 14.6% for AGIs $50k-75k, 17.8% for AGIs $75k-100k, 17.8% for AGIs $100k-200k)
Charity contributions: $3,687 (reported on 24.5% of returns)
Here:
$3,687
State:
$5,572
(% of AGI for various income ranges: 0.5% for AGIs below $25k, 2.1% for AGIs $25k-50k, 3.0% for AGIs $50k-75k, 3.6% for AGIs $75k-100k, 3.3% for AGIs $100k-200k)
Taxes paid: $5,658 (reported on 27.2% of returns)
11239:
$5,658
State:
$18,656
(% of AGI for various income ranges: 0.6% for AGIs below $25k, 2.3% for AGIs $25k-50k, 4.8% for AGIs $50k-75k, 7.7% for AGIs $75k-100k, 8.2% for AGIs $100k-200k)
Earned income credit: $1,964 (reported on 27.0% of returns)
Here:
$1,964
State:
$2,230
(% of AGI for various income ranges: 8.1% for AGIs below $25k, 1.0% for AGIs $25k-50k)
Percentage of individuals using paid preparers for their 2012 taxes: 65.2%
Here:
65%
State:
66%
(% for various income ranges: 61.9% for AGIs below $25k, 65.3% for AGIs $25k-50k, 69.1% for AGIs $50k-75k, 70.5% for AGIs $75k-100k, 76.2% for AGIs $100k-200k)
Averages for the 2004 tax year for zip code 11239, filed in 2005:
Average Adjusted Gross Income (AGI) in 2004: $30,630 (Individual Income Tax Returns)
Here:
$30,630
State:
$59,519
Salary/wage: $31,239 (reported on 88.4% of returns)
Here:
$31,239
State:
$50,673
(% of AGI for various income ranges: 74.4% for AGIs below $10k, 78.4% for AGIs $10k-25k, 93.7% for AGIs $25k-50k, 94.7% for AGIs $50k-75k, 89.7% for AGIs $75k-100k, 80.6% for AGIs over 100k)
Taxable interest for individuals: $357 (reported on 30.6% of returns)
This zip code:
$357
New York:
$2,377
(% of AGI for various income ranges: 2.0% for AGIs below $10k, 0.5% for AGIs $10k-25k, 0.3% for AGIs $25k-50k, 0.2% for AGIs $50k-75k, 0.2% for AGIs $75k-100k, 0.1% for AGIs over 100k)
Taxable dividends: $589 (reported on 6.3% of returns)
Here:
$589
State:
$5,394
(% of AGI for various income ranges: 1.0% for AGIs below $10k, 0.2% for AGIs $10k-25k, 0.1% for AGIs $25k-50k, 0.1% for AGIs $50k-75k, 0.1% for AGIs $75k-100k, 0.1% for AGIs over 100k)
Profit/loss from business: +$4,164 (reported on 10.4% of returns)
Here:
+$4,164
State:
+$13,809
(% of AGI for various income ranges: 16.7% for AGIs below $10k, 5.8% for AGIs $10k-25k, 0.1% for AGIs $25k-50k, -0.1% for AGIs $50k-75k, -0.3% for AGIs $75k-100k)
IRA payment deduction: $2,163 (reported on 1.6% of returns)
11239:
$2,163
New York:
$3,115
Total itemized deductions: $14,961 (30% of AGI, reported on 30.3% of returns)
Here:
$14,961
State:
$25,864
Here:
30.2% of AGI
State:
21.9% of AGI
(% of AGI for various income ranges: 3.0% for AGIs below $10k, 5.6% for AGIs $10k-25k, 15.1% for AGIs $25k-50k, 18.6% for AGIs $50k-75k, 20.4% for AGIs $75k-100k, 19.9% for AGIs over 100k)
Charity contributions deductions: $3,760 (8% of AGI, reported on 29.3% of returns)
Here:
$3,760
State:
$4,439
Here:
7.5% of AGI
State:
3.6% of AGI
(% of AGI for various income ranges: 0.4% for AGIs below $10k, 1.3% for AGIs $10k-25k, 3.7% for AGIs $25k-50k, 4.6% for AGIs $50k-75k, 4.5% for AGIs $75k-100k, 5.2% for AGIs over 100k)
Total tax: $2,954 (reported on 69.6% of returns)
11239:
$2,954
State:
$11,730
(% of AGI for various income ranges: 3.3% for AGIs below $10k, 3.4% for AGIs $10k-25k, 5.4% for AGIs $25k-50k, 8.8% for AGIs $50k-75k, 10.7% for AGIs $75k-100k, 14.1% for AGIs over 100k)
Earned income credit: $1,724 (reported on 26.1% of returns)
Here:
$1,724
State:
$1,757
Percentage of individuals using paid preparers for their 2004 taxes: 67.5%
Here:
68%
State:
67%
(% for various income ranges: 61.7% for AGIs below $10k, 69.6% for AGIs $10k-25k, 67.8% for AGIs $25k-50k, 68.7% for AGIs $50k-75k, 72.4% for AGIs $75k-100k, 78.0% for AGIs over 100k)
Household received Food Stamps/SNAP in the past 12 months: 4,044 Household did not receive Food Stamps/SNAP in the past 12 months: 4,820
Women who had a birth in the past 12 months: 71 (36 now married, 35 unmarried) Women who did not have a birth in the past 12 months: 3,858 (573 now married, 3,324 unmarried)
Housing units in zip code 11239 with a mortgage: 744 (15 second mortgage, 7 both second mortgage and home equity loan) Median monthly owner costs for units with a mortgage: $1,834 Median monthly owner costs for units without a mortgage: $665
Residents with income below the poverty level in 2022:
This zip code:
22.9%
Whole state:
14.3%
Residents with income below 50% of the poverty level in 2022:
This zip code:
15.6%
Whole state:
6.8%
Median number of rooms in houses and condos:
Here:
5.0
State:
6.3
Median number of rooms in apartments:
Here:
3.7
State:
3.8
Notable locations in this zip code not listed on our city pages
In group quarters: 187 (-1 institutionalized population)
Size of family households: 2,049 2-persons, 1,513 3-persons, 480 4-persons, 167 5-persons, 81 6-persons, 12 7-or-more-persons
Size of nonfamily households: 4,044 1-person, 132 2-persons, 102 3-persons
642 married couples with children.
1,651 single-parent households (106 men, 1,545 women).
68.0% of residents of 11239 zip code speak English at home.
9.5% of residents speak Spanish at home (71% very well, 12% well, 14% not well, 2% not at all).
16.9% of residents speak other Indo-European language at home (28% very well, 15% well, 37% not well, 19% not at all).
2.8% of residents speak Asian or Pacific Island language at home (9% very well, 16% well, 63% not well, 12% not at all).
2.6% of residents speak other language at home (80% very well, 17% well, 2% not at all).
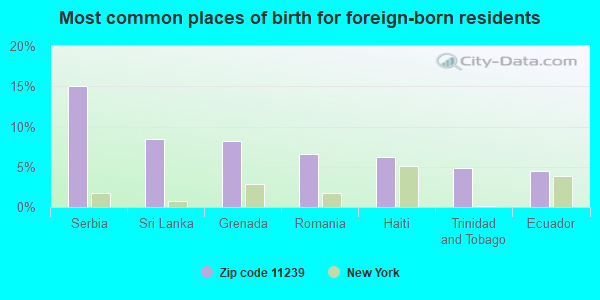
Foreign born population: 5,459 (33.0%) (88.9% of them are naturalized citizens)
This zip code:
33.0%
Whole state:
22.7%
15%Serbia
8%Sri Lanka
8%Grenada
7%Romania
6%Haiti
5%Trinidad and Tobago
4%Ecuador
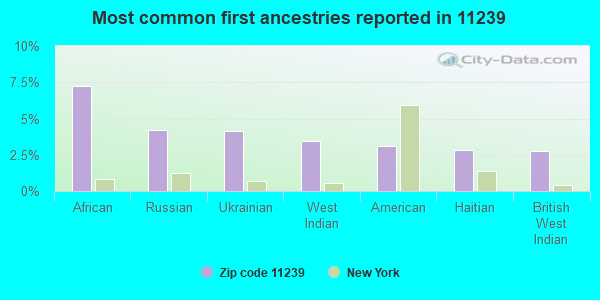
7%African
4%Russian
4%Ukrainian
3%West Indian
3%American
3%Haitian
3%British West Indian
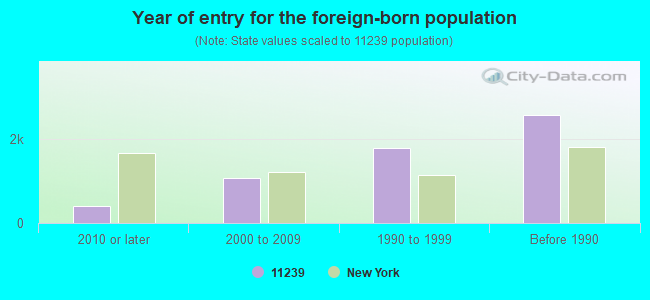
Year of entry for the foreign-born population
4142010 or later
1,0762000 to 2009
1,7731990 to 1999
2,564Before 1990
Facilities with environmental interests located in this zip code:
IS 364 GATEWAY IS ( in BROOKLYN, NY)
(National Center for Education Statistics) - STATE ID-331900010364 Organizations: NEW YORK CITY PUBLIC SCHOOLS (SCHOOL DISTRICT)
HOME DEPOT USA INC HD6152 (579 GATEWAY DR in BROOKLYN, NY)
Small Quantity Generators, between 100 kg and 1000 kg of hazardous waste/month (Resource Conservation and Recovery Act (tracking hazardous waste)) Alternative names: HOME DEPOT 6152 THE
Housing units lacking complete plumbing facilities: 0.2% Housing units lacking complete kitchen facilities: 0.4%
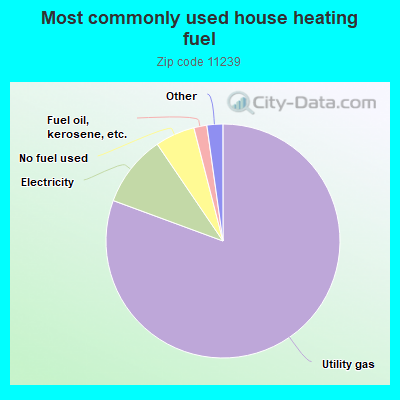
80.7%Utility gas
9.9%Electricity
5.5%No fuel used
1.8%Fuel oil, kerosene, etc.
0.8%Bottled, tank, or LP gas
0.8%Other fuel
0.5%Solar energy
Population in 1990: 14,948.
Place of birth for U.S.-born residents:
This state: 9,144
Northeast: 145
Midwest: 146
South: 781
West: 249
70% of the 11239 zip code residents lived in the same house 5 years ago. Out of people who lived in different houses, 80% lived in this county. Out of people who lived in different counties, 50% lived in New York.
96% of the 11239 zip code residents lived in the same house 1 year ago. Out of people who lived in different houses, 54% moved from this county. Out of people who lived in different houses, 35% moved from different county within same state. Out of people who lived in different houses, 8% moved from different state.
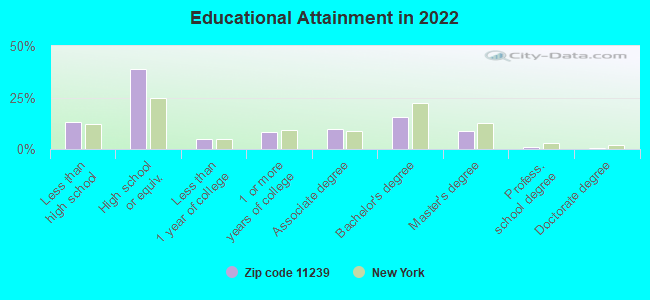
Private vs. public school enrollment:
Students in private schools in grades 1 to 8 (elementary and middle school): 323
Here:
21.0%
New York:
15.6%
Students in private schools in grades 9 to 12 (high school): 133
Here:
11.1%
New York:
15.0%
Students in private undergraduate colleges: 321
Here:
35.1%
New York:
39.2%
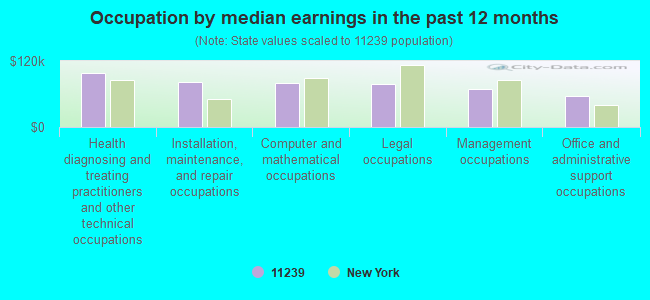
Occupation by median earnings in the past 12 months ($)
98,499Health diagnosing and treating practitioners and other technical occupations
82,090Installation, maintenance, and repair occupations
80,090Computer and mathematical occupations
77,989Legal occupations
68,846Management occupations
56,172Office and administrative support occupations
Top industries in this zip code by the number of employees in 2005:
Real Estate and Rental and Leasing: Lessors of Residential Buildings and Dwellings (250-499 employees: 1 establishment, 1-4 employees: 3 establishments)
Accommodation and Food Services: Full-Service Restaurants (100-249: 2, 1-4: 1)
Real Estate and Rental and Leasing: Residential Property Managers (100-249: 1, 1-4: 3)
Health Care and Social Assistance: Residential Mental Retardation Facilities (20-49: 3)
People in group quarters in 2010:
85 people in group homes intended for adults
27 people in correctional residential facilities
27 people in nursing facilities/skilled-nursing facilities
13 people in group homes for juveniles (non-correctional)
People in group quarters in 2000:
31 people in homes for the mentally retarded
25 people in homes for the physically handicapped
Fatal accident statistics in 2013:
Fatal accident count: 1
Vehicles involved in fatal accidents: 1
Fatal accidents caused by drunken drivers: 0
Fatalities: 1
Persons involved in fatal accidents: 1
Pedestrians involved in fatal accidents: 1
Fatal accident statistics in 2012:
Fatal accident count: 1
Vehicles involved in fatal accidents: 2
Fatal accidents caused by drunken drivers: 0
Fatalities: 1
Persons involved in fatal accidents: 4
Pedestrians involved in fatal accidents: 0
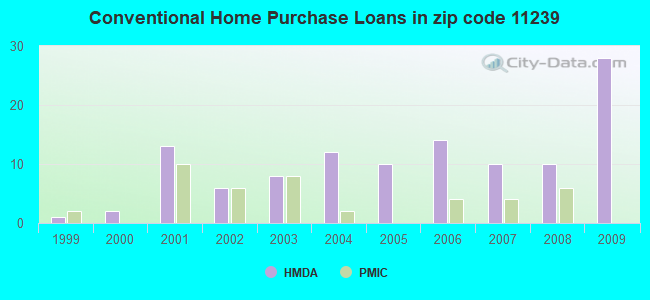
Home Mortgage Disclosure Act Aggregated Statistics For Year 2009 (Based on 2 full and 2 partial tracts)
A) FHA, FSA/RHS & VA Home Purchase Loans
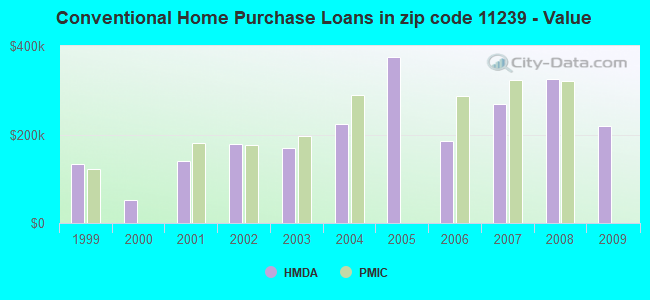
B) Conventional Home Purchase Loans
C) Refinancings
D) Home Improvement Loans
E) Loans on Dwellings For 5+ Families
F) Non-occupant Loans on < 5 Family Dwellings (A B C & D)
G) Loans On Manufactured Home Dwelling (A B C & D)
Number
Average Value
Number
Average Value
Number
Average Value
Number
Average Value
Number
Average Value
Number
Average Value
Number
Average Value
LOANS ORIGINATED
13
$498,304
28
$218,582
2
$289,775
2
$9,530
4
$95,319,048
0
$0
0
$0
APPLICATIONS APPROVED, NOT ACCEPTED
0
$0
1
$255,890
0
$0
0
$0
0
$0
0
$0
0
$0
APPLICATIONS DENIED
2
$505,195
11
$204,065
15
$196,359
6
$17,475
0
$0
6
$35,903
2
$53,380
APPLICATIONS WITHDRAWN
0
$0
0
$0
6
$199,855
0
$0
0
$0
2
$243,065
0
$0
FILES CLOSED FOR INCOMPLETENESS
0
$0
2
$214,470
4
$229,720
0
$0
0
$0
0
$0
0
$0
Aggregated Statistics For Year 2008 (Based on 2 full and 2 partial tracts)
B) Conventional Home Purchase Loans
C) Refinancings
D) Home Improvement Loans
F) Non-occupant Loans on < 5 Family Dwellings (A B C & D)
G) Loans On Manufactured Home Dwelling (A B C & D)
Number
Average Value
Number
Average Value
Number
Average Value
Number
Average Value
Number
Average Value
LOANS ORIGINATED
10
$324,469
10
$253,551
2
$331,715
2
$394,625
0
$0
APPLICATIONS APPROVED, NOT ACCEPTED
8
$341,901
8
$172,529
0
$0
0
$0
0
$0
APPLICATIONS DENIED
15
$384,203
11
$345,405
4
$97,702
0
$0
2
$50,520
APPLICATIONS WITHDRAWN
0
$0
2
$177,295
0
$0
0
$0
0
$0
FILES CLOSED FOR INCOMPLETENESS
0
$0
6
$231,945
0
$0
0
$0
0
$0
Aggregated Statistics For Year 2007 (Based on 2 full and 2 partial tracts)
A) FHA, FSA/RHS & VA Home Purchase Loans
B) Conventional Home Purchase Loans
C) Refinancings
D) Home Improvement Loans
F) Non-occupant Loans on < 5 Family Dwellings (A B C & D)
G) Loans On Manufactured Home Dwelling (A B C & D)
Number
Average Value
Number
Average Value
Number
Average Value
Number
Average Value
Number
Average Value
Number
Average Value
LOANS ORIGINATED
0
$0
10
$268,993
23
$251,396
4
$70,538
2
$357,450
0
$0
APPLICATIONS APPROVED, NOT ACCEPTED
0
$0
17
$356,272
6
$174,753
0
$0
0
$0
0
$0
APPLICATIONS DENIED
2
$388,905
12
$318,207
4
$414,638
10
$60,052
2
$4,765
2
$51,475
APPLICATIONS WITHDRAWN
0
$0
4
$252,598
4
$296,922
0
$0
0
$0
0
$0
FILES CLOSED FOR INCOMPLETENESS
0
$0
2
$362,215
4
$298,352
0
$0
0
$0
0
$0
Aggregated Statistics For Year 2006 (Based on 2 full and 2 partial tracts)
B) Conventional Home Purchase Loans
C) Refinancings
D) Home Improvement Loans
F) Non-occupant Loans on < 5 Family Dwellings (A B C & D)
Number
Average Value
Number
Average Value
Number
Average Value
Number
Average Value
LOANS ORIGINATED
14
$185,524
19
$216,126
15
$47,914
0
$0
APPLICATIONS APPROVED, NOT ACCEPTED
4
$149,175
8
$155,610
2
$8,580
0
$0
APPLICATIONS DENIED
6
$94,048
38
$244,220
15
$42,576
2
$9,530
APPLICATIONS WITHDRAWN
4
$110,095
19
$170,573
2
$19,065
4
$59,575
FILES CLOSED FOR INCOMPLETENESS
0
$0
6
$196,995
0
$0
0
$0
Aggregated Statistics For Year 2005 (Based on 2 full and 2 partial tracts)
B) Conventional Home Purchase Loans
C) Refinancings
D) Home Improvement Loans
F) Non-occupant Loans on < 5 Family Dwellings (A B C & D)
G) Loans On Manufactured Home Dwelling (A B C & D)
Number
Average Value
Number
Average Value
Number
Average Value
Number
Average Value
Number
Average Value
LOANS ORIGINATED
10
$374,791
33
$209,229
6
$12,073
2
$1,334,480
0
$0
APPLICATIONS APPROVED, NOT ACCEPTED
11
$180,242
4
$129,635
0
$0
6
$137,260
0
$0
APPLICATIONS DENIED
15
$180,854
27
$205,326
0
$0
2
$217,330
2
$66,725
APPLICATIONS WITHDRAWN
8
$317,415
11
$229,981
0
$0
2
$203,030
0
$0
FILES CLOSED FOR INCOMPLETENESS
4
$204,990
4
$225,908
0
$0
0
$0
0
$0
Aggregated Statistics For Year 2004 (Based on 2 full and 2 partial tracts)
B) Conventional Home Purchase Loans
C) Refinancings
D) Home Improvement Loans
F) Non-occupant Loans on < 5 Family Dwellings (A B C & D)
G) Loans On Manufactured Home Dwelling (A B C & D)
Number
Average Value
Number
Average Value
Number
Average Value
Number
Average Value
Number
Average Value
LOANS ORIGINATED
12
$224,036
35
$141,943
2
$9,530
0
$0
0
$0
APPLICATIONS APPROVED, NOT ACCEPTED
0
$0
10
$150,092
2
$119,150
0
$0
0
$0
APPLICATIONS DENIED
6
$196,360
23
$177,793
8
$39,796
2
$305,025
2
$45,755
APPLICATIONS WITHDRAWN
0
$0
17
$147,802
4
$16,680
2
$408,925
0
$0
FILES CLOSED FOR INCOMPLETENESS
2
$362,215
0
$0
0
$0
0
$0
0
$0
Aggregated Statistics For Year 2003 (Based on 2 full and 2 partial tracts)
A) FHA, FSA/RHS & VA Home Purchase Loans
B) Conventional Home Purchase Loans
C) Refinancings
D) Home Improvement Loans
F) Non-occupant Loans on < 5 Family Dwellings (A B C & D)
Number
Average Value
Number
Average Value
Number
Average Value
Number
Average Value
Number
Average Value
LOANS ORIGINATED
0
$0
8
$168,716
38
$158,382
4
$54,810
4
$141,550
APPLICATIONS APPROVED, NOT ACCEPTED
0
$0
0
$0
8
$145,601
0
$0
0
$0
APPLICATIONS DENIED
0
$0
4
$296,445
19
$173,301
4
$24,782
4
$114,385
APPLICATIONS WITHDRAWN
2
$250,690
4
$186,828
23
$178,124
0
$0
2
$250,690
FILES CLOSED FOR INCOMPLETENESS
0
$0
0
$0
0
$0
2
$40,990
0
$0
Aggregated Statistics For Year 2002 (Based on 2 full and 2 partial tracts)
B) Conventional Home Purchase Loans
C) Refinancings
D) Home Improvement Loans
F) Non-occupant Loans on < 5 Family Dwellings (A B C & D)
Number
Average Value
Number
Average Value
Number
Average Value
Number
Average Value
LOANS ORIGINATED
6
$178,567
32
$133,388
0
$0
0
$0
APPLICATIONS APPROVED, NOT ACCEPTED
2
$217,330
6
$142,662
0
$0
0
$0
APPLICATIONS DENIED
4
$234,965
11
$153,725
13
$17,598
2
$47,660
APPLICATIONS WITHDRAWN
6
$77,845
16
$114,116
4
$42,895
0
$0
FILES CLOSED FOR INCOMPLETENESS
0
$0
0
$0
0
$0
0
$0
Aggregated Statistics For Year 2001 (Based on 2 full and 2 partial tracts)
A) FHA, FSA/RHS & VA Home Purchase Loans
B) Conventional Home Purchase Loans
C) Refinancings
D) Home Improvement Loans
E) Loans on Dwellings For 5+ Families
F) Non-occupant Loans on < 5 Family Dwellings (A B C & D)
Number
Average Value
Number
Average Value
Number
Average Value
Number
Average Value
Number
Average Value
Number
Average Value
LOANS ORIGINATED
0
$0
13
$141,074
2
$161,090
2
$3,815
2
$619,580
2
$104,850
APPLICATIONS APPROVED, NOT ACCEPTED
0
$0
0
$0
8
$103,026
2
$14,300
0
$0
2
$64,820
APPLICATIONS DENIED
2
$74,350
6
$117,562
17
$147,636
10
$15,442
0
$0
0
$0
APPLICATIONS WITHDRAWN
4
$170,145
0
$0
8
$134,878
2
$7,625
0
$0
0
$0
FILES CLOSED FOR INCOMPLETENESS
0
$0
0
$0
4
$168,240
2
$25,735
0
$0
0
$0
Aggregated Statistics For Year 2000 (Based on 2 full and 2 partial tracts)
A) FHA, FSA/RHS & VA Home Purchase Loans
B) Conventional Home Purchase Loans
C) Refinancings
D) Home Improvement Loans
F) Non-occupant Loans on < 5 Family Dwellings (A B C & D)
Number
Average Value
Number
Average Value
Number
Average Value
Number
Average Value
Number
Average Value
LOANS ORIGINATED
2
$139,165
2
$52,425
2
$171,395
48
$993
0
$0
APPLICATIONS APPROVED, NOT ACCEPTED
0
$0
4
$103,422
0
$0
0
$0
2
$39,080
APPLICATIONS DENIED
0
$0
6
$111,413
29
$88,615
12
$18,192
0
$0
APPLICATIONS WITHDRAWN
0
$0
2
$171,575
7
$101,053
0
$0
0
$0
FILES CLOSED FOR INCOMPLETENESS
0
$0
0
$0
2
$47,660
2
$1,905
0
$0
Aggregated Statistics For Year 1999 (Based on 2 partial tracts)
Detailed PMIC statistics for the following Tracts:1058.00
, 1070.00
2007 - 2018 National Fire Incident Reporting System (NFIRS) incidents
According to the data from the years 2007 - 2018 the average number of fires per year is 62. The highest number of reported fires - 84 took place in 2015, and the least - 33 in 2011. The data has an increasing trend.
When looking into fire subcategories, the most reports belonged to: Structure Fires (59.8%), and Outside Fires (17.2%).
Fire incident types reported to NFIRS in Zip Code 11239


 Nearest zip codes: 11236, 11208, 11207, 11414, 11212, 11417.


 According to the data from the years 2007 - 2018 the average number of fires per year is 62. The highest number of reported fires - 84 took place in 2015, and the least - 33 in 2011. The data has an increasing trend.
 When looking into fire subcategories, the most reports belonged to: Structure Fires (59.8%), and Outside Fires (17.2%).