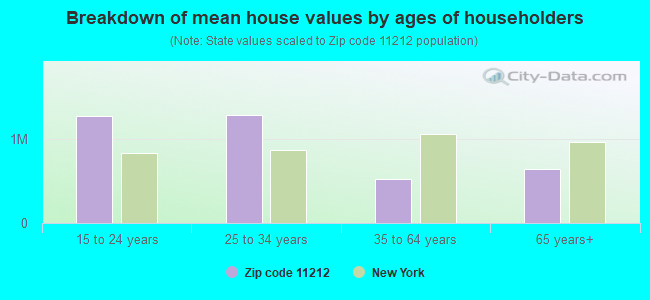
Estimated zip code population in 2022: 82,673 Zip code population in 2010: 84,500 Zip code population in 2000: 85,161
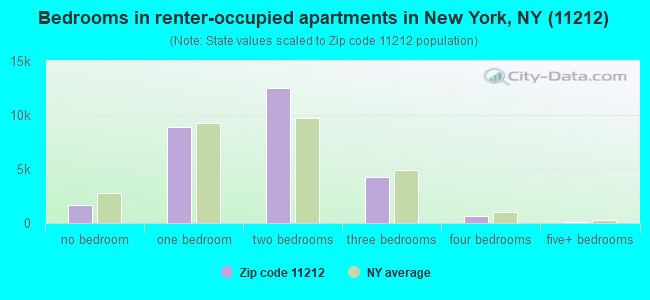
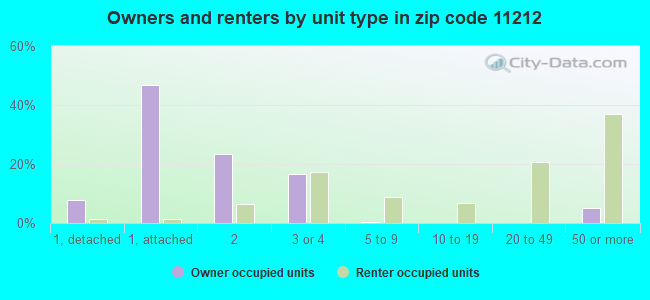
Houses and condos: 34,900 Renter-occupied apartments: 28,198
% of renters here:
86%
State:
46%
March 2022 cost of living index in zip code 11212: 160.7 (very high, U.S. average is 100)
Land area: 1.5 sq. mi. Water area: 0.0 sq. mi.
Population density: 53,756 people per square mile
(very high).
OSM Map
General Map
Google Map
MSN Map
OSM Map
General Map
Google Map
MSN Map
OSM Map
General Map
Google Map
MSN Map
OSM Map
General Map
Google Map
MSN Map
Please wait while loading the map...
Real estate property taxes paid for housing units in 2022:
This zip code:
0.7% ($4,102)
New York:
1.5% ($6,180)
Median real estate property taxes paid for housing units with mortgages in 2022: $3,648 (0.6%) Median real estate property taxes paid for housing units with no mortgage in 2022: $4,440 (0.8%)
Averages for the 2020 tax year for zip code 11212, filed in 2021:
Average Adjusted Gross Income (AGI) in 2020: $36,068 (Individual Income Tax Returns)
Here:
$36,068
State:
$90,930
Salary/wage: $35,455 (reported on 82.7% of returns)
Here:
$35,455
State:
$72,104
(% of AGI for various income ranges: 938.9% for AGIs below $25k, 3493.6% for AGIs $25k-50k, 6952.8% for AGIs $50k-75k, 10403.1% for AGIs $75k-100k, 16248.0% for AGIs $100k-200k, 60430.0% for AGIs over 200k)
Taxable interest for individuals: $239 (reported on 10.7% of returns)
This zip code:
$239
New York:
$3,075
(% of AGI for various income ranges: 1.6% for AGIs below $25k, 2.1% for AGIs $25k-50k, 4.8% for AGIs $50k-75k, 8.0% for AGIs $75k-100k, 22.0% for AGIs $100k-200k, 70.0% for AGIs over 200k)
Ordinary dividends: $926 (reported on 3.1% of returns)
Here:
$926
State:
$11,095
(% of AGI for various income ranges: 1.0% for AGIs below $25k, 1.5% for AGIs $25k-50k, 4.3% for AGIs $50k-75k, 14.6% for AGIs $75k-100k, 37.1% for AGIs $100k-200k, 173.3% for AGIs over 200k)
Net capital gain/loss in AGI: +$2,482 (reported on 3.5% of returns)
Here:
+$2,482
State:
+$44,925
(% of AGI for various income ranges: 0.2% for AGIs below $25k, 1.2% for AGIs $25k-50k, 4.8% for AGIs $50k-75k, 27.8% for AGIs $75k-100k, 154.2% for AGIs $100k-200k, 3803.3% for AGIs over 200k)
Profit/loss from business: +$5,068 (reported on 15.0% of returns)
Here:
+$5,068
State:
+$14,940
(% of AGI for various income ranges: 170.7% for AGIs below $25k, 38.6% for AGIs $25k-50k, 25.6% for AGIs $50k-75k, 60.5% for AGIs $75k-100k, 111.9% for AGIs $100k-200k)
Taxable individual retirement arrangement distribution: $9,884 (reported on 1.5% of returns)
11212:
$9,884
New York:
$19,609
(% of AGI for various income ranges: 8.7% for AGIs below $25k, 9.3% for AGIs $25k-50k, 30.5% for AGIs $50k-75k, 49.3% for AGIs $75k-100k, 147.6% for AGIs $100k-200k)
Total itemized deductions: $25,476 (reported on 4.1% of returns)
Here:
$25,476
State:
$39,326
(% of AGI for various income ranges: 12.3% for AGIs below $25k, 54.2% for AGIs $25k-50k, 224.3% for AGIs $50k-75k, 615.4% for AGIs $75k-100k, 1267.2% for AGIs $100k-200k, 5860.0% for AGIs over 200k)
Charity contributions: $6,733 (reported on 3.3% of returns)
Here:
$6,733
State:
$15,420
(% of AGI for various income ranges: 1.0% for AGIs below $25k, 9.0% for AGIs $25k-50k, 43.6% for AGIs $50k-75k, 139.6% for AGIs $75k-100k, 323.2% for AGIs $100k-200k, 1190.0% for AGIs over 200k)
Taxes paid: $8,319 (reported on 4.0% of returns)
11212:
$8,319
State:
$9,183
(% of AGI for various income ranges: 2.7% for AGIs below $25k, 14.6% for AGIs $25k-50k, 73.6% for AGIs $50k-75k, 224.1% for AGIs $75k-100k, 431.4% for AGIs $100k-200k, 1313.3% for AGIs over 200k)
Earned income credit: $2,393 (reported on 31.3% of returns)
Here:
$2,393
State:
$2,138
(% of AGI for various income ranges: 149.4% for AGIs below $25k, 85.3% for AGIs $25k-50k, 0.4% for AGIs $50k-75k)
Percentage of individuals using paid preparers for their 2020 taxes: 94.2%
Here:
94%
State:
95%
(% for various income ranges: 92.9% for AGIs below $25k, 95.9% for AGIs $25k-50k, 94.4% for AGIs $50k-75k, 93.8% for AGIs $75k-100k, 93.3% for AGIs $100k-200k, 88.9% for AGIs over 200k)
Averages for the 2012 tax year for zip code 11212, filed in 2013:
Average Adjusted Gross Income (AGI) in 2012: $28,184 (Individual Income Tax Returns)
Here:
$28,184
State:
$77,088
Salary/wage: $29,080 (reported on 82.7% of returns)
Here:
$29,080
State:
$60,593
(% of AGI for various income ranges: 70.1% for AGIs below $25k, 92.5% for AGIs $25k-50k, 90.9% for AGIs $50k-75k, 89.7% for AGIs $75k-100k, 85.6% for AGIs $100k-200k, 62.0% for AGIs over 200k)
Taxable interest for individuals: $256 (reported on 11.3% of returns)
This zip code:
$256
New York:
$3,125
(% of AGI for various income ranges: 0.1% for AGIs below $25k, 0.1% for AGIs $50k-75k, 0.1% for AGIs $75k-100k, 0.1% for AGIs $100k-200k)
Ordinary dividends: $962 (reported on 2.7% of returns)
Here:
$962
State:
$10,299
(% of AGI for various income ranges: 0.1% for AGIs $75k-100k, 0.2% for AGIs $100k-200k)
Profit/loss from business: +$7,845 (reported on 18.5% of returns)
Here:
+$7,845
State:
+$16,168
(% of AGI for various income ranges: 19.0% for AGIs below $25k, 0.4% for AGIs $25k-50k, 0.4% for AGIs $50k-75k, 0.2% for AGIs $75k-100k)
Taxable individual retirement arrangement distribution: $9,159 (reported on 1.7% of returns)
11212:
$9,159
New York:
$17,621
(% of AGI for various income ranges: 0.4% for AGIs below $25k, 0.4% for AGIs $25k-50k, 0.7% for AGIs $50k-75k, 0.8% for AGIs $75k-100k, 1.2% for AGIs $100k-200k)
Total itemized deductions: $17,535 (30% of AGI, reported on 19.0% of returns)
Here:
$17,535
State:
$34,985
Here:
30.0% of AGI
State:
21.3% of AGI
(% of AGI for various income ranges: 3.2% for AGIs below $25k, 10.5% for AGIs $25k-50k, 16.7% for AGIs $50k-75k, 20.1% for AGIs $75k-100k, 21.2% for AGIs $100k-200k, 15.2% for AGIs over 200k)
Charity contributions: $3,638 (reported on 16.4% of returns)
Here:
$3,638
State:
$5,572
(% of AGI for various income ranges: 0.4% for AGIs below $25k, 2.0% for AGIs $25k-50k, 3.2% for AGIs $50k-75k, 3.4% for AGIs $75k-100k, 3.7% for AGIs $100k-200k, 2.1% for AGIs over 200k)
Taxes paid: $5,663 (reported on 18.9% of returns)
11212:
$5,663
State:
$18,656
(% of AGI for various income ranges: 0.7% for AGIs below $25k, 2.6% for AGIs $25k-50k, 5.5% for AGIs $50k-75k, 7.8% for AGIs $75k-100k, 8.8% for AGIs $100k-200k, 7.8% for AGIs over 200k)
Earned income credit: $2,578 (reported on 44.9% of returns)
Here:
$2,578
State:
$2,230
(% of AGI for various income ranges: 13.8% for AGIs below $25k, 1.6% for AGIs $25k-50k)
Percentage of individuals using paid preparers for their 2012 taxes: 71.5%
Here:
71%
State:
66%
(% for various income ranges: 71.3% for AGIs below $25k, 71.3% for AGIs $25k-50k, 72.0% for AGIs $50k-75k, 75.4% for AGIs $75k-100k, 71.6% for AGIs $100k-200k, 66.7% for AGIs over 200k)
Averages for the 2004 tax year for zip code 11212, filed in 2005:
Average Adjusted Gross Income (AGI) in 2004: $24,962 (Individual Income Tax Returns)
Here:
$24,962
State:
$59,519
Salary/wage: $26,007 (reported on 87.1% of returns)
Here:
$26,007
State:
$50,673
(% of AGI for various income ranges: 67.8% for AGIs below $10k, 86.2% for AGIs $10k-25k, 96.0% for AGIs $25k-50k, 93.1% for AGIs $50k-75k, 92.4% for AGIs $75k-100k, 80.0% for AGIs over 100k)
Taxable interest for individuals: $314 (reported on 19.7% of returns)
This zip code:
$314
New York:
$2,377
(% of AGI for various income ranges: 0.5% for AGIs below $10k, 0.2% for AGIs $10k-25k, 0.2% for AGIs $25k-50k, 0.3% for AGIs $50k-75k, 0.3% for AGIs $75k-100k, 0.3% for AGIs over 100k)
Taxable dividends: $462 (reported on 4.1% of returns)
Here:
$462
State:
$5,394
(% of AGI for various income ranges: 0.1% for AGIs below $10k, 0.1% for AGIs $10k-25k, 0.0% for AGIs $25k-50k, 0.1% for AGIs $50k-75k, 0.1% for AGIs $75k-100k, 0.1% for AGIs over 100k)
Net capital gain/loss: +$2,287 (reported on 2.1% of returns)
Here:
+$2,287
State:
+$23,581
(% of AGI for various income ranges: -0.1% for AGIs below $10k, -0.0% for AGIs $10k-25k, -0.0% for AGIs $25k-50k, -0.0% for AGIs $50k-75k, 0.1% for AGIs $75k-100k, 5.0% for AGIs over 100k)
Profit/loss from business: +$6,498 (reported on 14.6% of returns)
Here:
+$6,498
State:
+$13,809
(% of AGI for various income ranges: 33.7% for AGIs below $10k, 7.7% for AGIs $10k-25k, 0.2% for AGIs $25k-50k, 0.2% for AGIs $50k-75k, 0.4% for AGIs $75k-100k, -0.0% for AGIs over 100k)
IRA payment deduction: $1,747 (reported on 1.0% of returns)
11212:
$1,747
New York:
$3,115
(% of AGI for various income ranges: 0.1% for AGIs below $10k, 0.1% for AGIs $10k-25k, 0.1% for AGIs $25k-50k, 0.1% for AGIs $50k-75k, 0.1% for AGIs $75k-100k)
Total itemized deductions: $15,768 (34% of AGI, reported on 24.8% of returns)
Here:
$15,768
State:
$25,864
Here:
34.4% of AGI
State:
21.9% of AGI
(% of AGI for various income ranges: 3.0% for AGIs below $10k, 6.4% for AGIs $10k-25k, 17.2% for AGIs $25k-50k, 23.6% for AGIs $50k-75k, 24.1% for AGIs $75k-100k, 20.7% for AGIs over 100k)
Charity contributions deductions: $3,678 (8% of AGI, reported on 23.3% of returns)
Here:
$3,678
State:
$4,439
Here:
7.9% of AGI
State:
3.6% of AGI
(% of AGI for various income ranges: 0.3% for AGIs below $10k, 1.3% for AGIs $10k-25k, 3.9% for AGIs $25k-50k, 5.2% for AGIs $50k-75k, 5.2% for AGIs $75k-100k, 4.7% for AGIs over 100k)
Total tax: $2,368 (reported on 58.4% of returns)
11212:
$2,368
State:
$11,730
(% of AGI for various income ranges: 5.2% for AGIs below $10k, 2.8% for AGIs $10k-25k, 4.5% for AGIs $25k-50k, 8.1% for AGIs $50k-75k, 9.9% for AGIs $75k-100k, 14.0% for AGIs over 100k)
Earned income credit: $2,050 (reported on 44.2% of returns)
Here:
$2,050
State:
$1,757
Percentage of individuals using paid preparers for their 2004 taxes: 73.5%
Here:
73%
State:
67%
(% for various income ranges: 72.9% for AGIs below $10k, 75.9% for AGIs $10k-25k, 71.9% for AGIs $25k-50k, 71.0% for AGIs $50k-75k, 72.8% for AGIs $75k-100k, 72.8% for AGIs over 100k)
Likely homosexual households (counted as self-reported same-sex unmarried-partner households)
Lesbian couples: 0.1% of all households
Gay men: 0.0% of all households
Household received Food Stamps/SNAP in the past 12 months: 15,869 Household did not receive Food Stamps/SNAP in the past 12 months: 18,172
Women who had a birth in the past 12 months: 1,529 (506 now married, 1,053 unmarried) Women who did not have a birth in the past 12 months: 20,837 (4,993 now married, 15,969 unmarried)
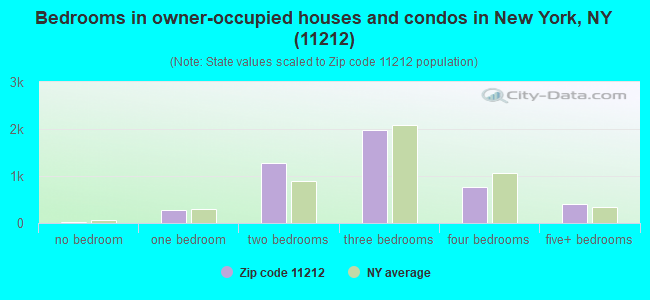
Housing units in zip code 11212 with a mortgage: 2,734 (82 second mortgage, 4 home equity loan, 62 both second mortgage and home equity loan) Houses without a mortgage: 179
Median monthly owner costs for units with a mortgage: $2,709 Median monthly owner costs for units without a mortgage: $899
Residents with income below the poverty level in 2022:
This zip code:
35.1%
Whole state:
14.3%
Residents with income below 50% of the poverty level in 2022:
This zip code:
12.9%
Whole state:
6.8%
Median number of rooms in houses and condos:
Here:
5.2
State:
6.3
Median number of rooms in apartments:
Here:
3.8
State:
3.8
Notable locations in this zip code not listed on our city pages
Notable locations in zip code 11212: Stone Avenue Branch Brooklyn Public Library (A), Brownsville Branch Brooklyn Public Library (B), East Flatbush Branch Brooklyn Public Library (C), Fire Department New York Engine 231 Ladder 120 Battalion 44 (D), New York Ladder Company 120 (E), Brownsville Boys Club (F), Brownsville Recreation Center (G), Schwartz Pavilion (H), Seventythird Precinct Police Station (I), Fire Department New York Engine 283 Division 15 (J). Display/hide their locations on the map
Churches in zip code 11212 include: Triumphant Church of God (A), Rescue Mission Church (B), Clarkson Avenue Church of God (C), Assembly of the First Born (D), Pentecostal Circle Tabernacle (E), Holy Love Pentecostal Church (F), House of God Mission (G), Saint John's Wesleyan Methodist Church (H), Fellowship Baptist Church (I). Display/hide their locations on the map
Parks in zip code 11212 include: Betsy Head Memorial Playground (1), Howard Playground (2), Houston Playground (3), Powell Playground (4), Chester Playground (5), Zion Triangle (6), Public School 125 Playground (7), Doctor Richard Greene Playground (8), Brownsville I Ura Park (9). Display/hide their locations on the map
4,554 married couples with children.
9,536 single-parent households (553 men, 8,983 women).
77.8% of residents of 11212 zip code speak English at home.
13.9% of residents speak Spanish at home (54% very well, 16% well, 16% not well, 14% not at all).
4.6% of residents speak other Indo-European language at home (58% very well, 22% well, 14% not well, 6% not at all).
0.4% of residents speak Asian or Pacific Island language at home (10% very well, 16% well, 16% not well, 58% not at all).
3.1% of residents speak other language at home (56% very well, 33% well, 9% not well, 2% not at all).
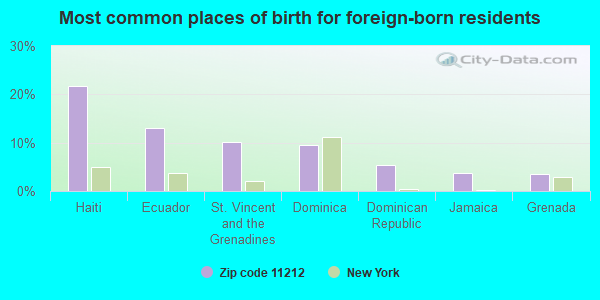
Foreign born population: 27,933 (33.8%) (61.0% of them are naturalized citizens)
This zip code:
33.8%
Whole state:
22.7%
22%Haiti
13%Ecuador
10%St. Vincent and the Grenadines
9%Dominica
5%Dominican Republic
4%Jamaica
3%Grenada
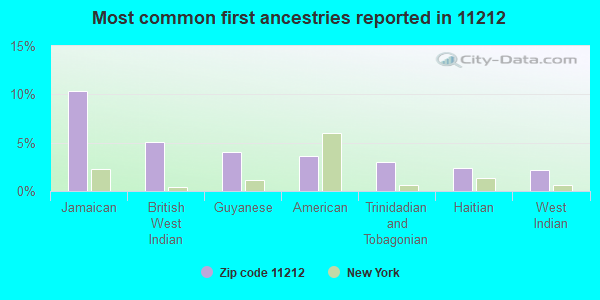
10%Jamaican
5%British West Indian
4%Guyanese
4%American
3%Trinidadian and Tobagonian
2%Haitian
2%West Indian
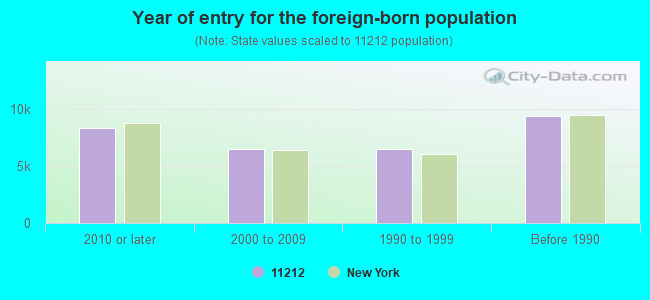
Year of entry for the foreign-born population
8,3602010 or later
6,4722000 to 2009
6,4811990 to 1999
9,379Before 1990
Major facilities with environmental interests located in this zip code:
ALEX SERVICE CLEANERS (977 LENOX RD in BROOKLYN, NY)
AIR MINOR (AIRS/AFS) STATE MASTER (New York facility tracking) - AIR PROGRAM (Resource Conservation and Recovery Act (tracking hazardous waste)) Business SIC classification: DRYCLEANING PLANTS, EXCEPT RUG CLEANING Business NAICS classification: DRYCLEANING AND LAUNDRY SERVICES (EXCEPT COIN-OPERATED). Organizations: ALEX SERVICE CLEANERS INC, JOE BACK EXPRESS INC (LEGALLY RESPONSIBLE PARTY)
Alternative names: 977 SERVICE CLEANER, WOO SUNG CLEANER
CREST LOCK CO-342 HERZL ST (342 HERZL STREET in BROOKLYN, NY)
AIR MINOR (AIRS/AFS) STATE MASTER (New York facility tracking) - AIR PROGRAM, (Resource Conservation and Recovery Act (tracking hazardous waste)) Business SIC classification: COATING, ENGRAVING, AND ALLIED SERVICES Organizations: CREST LOCK COMPANY (LEGALLY RESPONSIBLE PARTY)
Alternative names: CREST LOCK CO INC
HS REDIRECTION ( in BROOKLYN, NY)
(National Center for Education Statistics) - STATE ID-337700010565 Organizations: NEW YORK CITY PUBLIC SCHOOLS (SCHOOL DISTRICT)
IS 252 ARTHUR SOMERS IS ( in BROOKLYN, NY)
(National Center for Education Statistics) - STATE ID-331800010252 Organizations: NEW YORK CITY PUBLIC SCHOOLS (SCHOOL DISTRICT)
IS 392 ( in BROOKLYN, NY)
(National Center for Education Statistics) - STATE ID-332300010392 Organizations: NEW YORK CITY PUBLIC SCHOOLS (SCHOOL DISTRICT)
CROSSROADS JUVENILE CENTER ( in BROOKLYN, NY)
(National Center for Education Statistics) - STATE ID-332300950003 Organizations: NEW YORK CITY PUBLIC SCHOOLS (SCHOOL DISTRICT)
GSD GASOLINE CORPORATION (524 VANDERBUILT AVENUE in BROOKLYN, NY)
AIR MINOR (AIRS/AFS) (Resource Conservation and Recovery Act (tracking hazardous waste)) Business SIC classification: GASOLINE SERVICE STATIONS Organizations: NON REGULATED (CONTACT/OWNER)
Alternative names: CITY GAS, D.B.P. GARAGE
CONSOLIDATED EDISON COMPANY OF NY (745 LIVONIA AVENUE in BROOKLYN, NY)
HAZARDOUS WASTE BIENNIAL REPORTER (Resource Conservation and Recovery Act (tracking hazardous waste)) (Resource Conservation and Recovery Act (tracking hazardous waste)) Small Quantity Generators, between 100 kg and 1000 kg of hazardous waste/month (Resource Conservation and Recovery Act (tracking hazardous waste)) - notification Organizations: CONSOLIDATED EDISON CO OF NY (CONTACT/OWNER)
Alternative names: CON ED, CON EDISON LIVONIA SUBSTATION
460 STONE AVENUE (460 STONE AVE in BROOKLYN, NY)
(Resource Conservation and Recovery Act (tracking hazardous waste)) Organizations: BILL WOLF PETROLEUM CORP (CONTACT/OWNER)
, ROUTE 109 SERVICE STATION INC (CONTACT/OWNER)
CON EDISON - MH 67411 (OPP B/L #102-10 FARRAGUT ROAD in BROOKLYN, NY)
Large Quantity Generators, more that 1000 kg of hazardous waste/month (Resource Conservation and Recovery Act (tracking hazardous waste)) Organizations: CONSOLIDATED EDISON COMPANY OF NY, INC. (CONTACT/OPERATOR)
GRANT CLEANERS (1029 RUTLAND RD in BROOKLYN, NY)
AIR MINOR (AIRS/AFS) Small Quantity Generators, between 100 kg and 1000 kg of hazardous waste/month (Resource Conservation and Recovery Act (tracking hazardous waste)) Business SIC classification: DRYCLEANING PLANTS, EXCEPT RUG CLEANING Alternative names: RUTLAND CLEANERS
IS 252 ARTHUR SOMERS (1084 LENOX RD in BROOKLYN, NY)
HAZARDOUS WASTE BIENNIAL REPORTER (Resource Conservation and Recovery Act (tracking hazardous waste)) Large Quantity Generators, more that 1000 kg of hazardous waste/month (Resource Conservation and Recovery Act (tracking hazardous waste)) Alternative names: I.S 252K, NYC SCHOOL CONSTRUCTION AUTH - IS 252
CON ED - MH 3739 (LIBERTY AVE & ATKINS AVE in BROOKLYN, NY)
HAZARDOUS WASTE BIENNIAL REPORTER (Resource Conservation and Recovery Act (tracking hazardous waste)) (Resource Conservation and Recovery Act (tracking hazardous waste))
Housing units lacking complete plumbing facilities: 1.1% Housing units lacking complete kitchen facilities: 1.7%
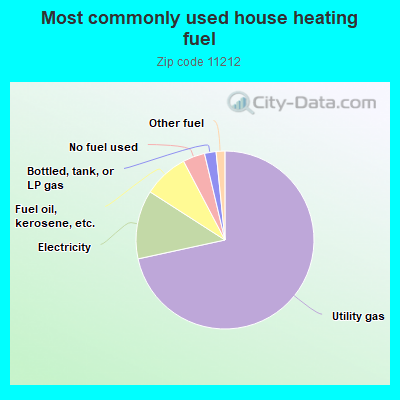
71.6%Utility gas
12.5%Electricity
8.2%Fuel oil, kerosene, etc.
4.0%No fuel used
2.1%Bottled, tank, or LP gas
1.6%Other fuel
Population in 1990: 87,079.
Place of birth for U.S.-born residents:
This state: 45,680
Northeast: 1,006
Midwest: 313
South: 4,541
West: 266
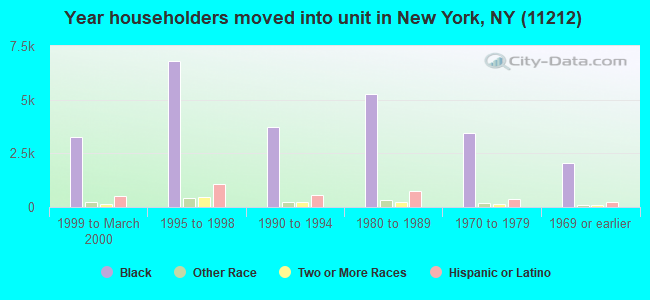
68% of the 11212 zip code residents lived in the same house 5 years ago. Out of people who lived in different houses, 80% lived in this county. Out of people who lived in different counties, 50% lived in New York.
89% of the 11212 zip code residents lived in the same house 1 year ago. Out of people who lived in different houses, 65% moved from this county. Out of people who lived in different houses, 23% moved from different county within same state. Out of people who lived in different houses, 6% moved from different state. Out of people who lived in different houses, 5% moved from abroad.
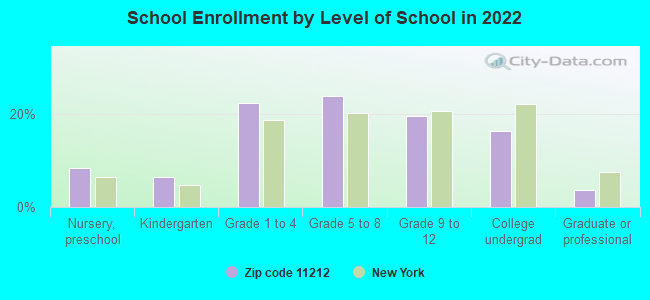
Private vs. public school enrollment:
Students in private schools in grades 1 to 8 (elementary and middle school): 1,205
Here:
13.2%
New York:
15.6%
Students in private schools in grades 9 to 12 (high school): 384
Here:
9.9%
New York:
15.0%
Students in private undergraduate colleges: 715
Here:
22.4%
New York:
39.2%
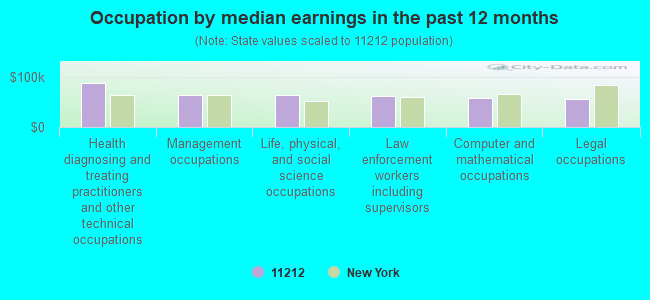
Occupation by median earnings in the past 12 months ($)
87,311Health diagnosing and treating practitioners and other technical occupations
64,121Management occupations
62,619Life, physical, and social science occupations
62,366Law enforcement workers including supervisors
56,767Computer and mathematical occupations
56,496Legal occupations
Companies with federal contracts located in this zip code:
GRUNER BRASS FITTINGS CORP (173 GLENMORE AVEENUE in BROOKLYN, NY; small business) : $95,368 in 10 contractsfrom 2002 to 2005
Contracts for Hose, Pipe, Tube, Lubrication, and Railing Fittings by Defense Logistics Agency Signed by year:2000: $0; 2001: $0; 2002: $44,051; 2003: $0; 2004: $10,107; 2005: $41,210; 2006: $0.
Biggest contracts:
$44,051 with Defense Logistics Agency for Hose, Pipe, Tube, Lubrication, and Railing Fittings. Signed on 2002-03-06. Completion date: 2002-03-20.
$10,575, same as above.Signed on 2005-03-28. Completion date: 2005-06-28.
$7,583, same as above.Signed on 2005-02-09. Completion date: 2005-05-11.
$7,536, same as above.Signed on 2005-03-02. Completion date: 2005-06-01.
brookdale university hospital (1 BROOKDALE PLAZA in BROOKLYN, NY)
$1,500 with Bureau of Prisoners/Federal Prison System for Medical/Psychiatric Consultation Services. Signed on 2005-07-13. Completion date: 2005-07-13.
Top industries in this zip code by the number of employees in 2005:
Health Care and Social Assistance: General Medical and Surgical Hospitals (over 1000 employees: 1 establishment)
Health Care and Social Assistance: Home Health Care Services (500-999: 1, 20-49: 1)
Health Care and Social Assistance: Nursing Care Facilities (250-499: 1)
Health Care and Social Assistance: Services for the Elderly and Persons with Disabilities (100-249: 2, 5-9: 2, 1-4: 1)
Health Care and Social Assistance: Child Day Care Services (50-99: 1, 20-49: 3, 10-19: 7, 5-9: 4, 1-4: 14)
2007 - 2018 National Fire Incident Reporting System (NFIRS) incidents
According to the data from the years 2007 - 2018 the average number of fire incidents per year is 561. The highest number of reported fire incidents - 717 took place in 2008, and the least - 503 in 2018. The data has a declining trend.
When looking into fire subcategories, the most reports belonged to: Structure Fires (74.0%), and Outside Fires (16.6%).
Fire incident types reported to NFIRS in Zip Code 11212

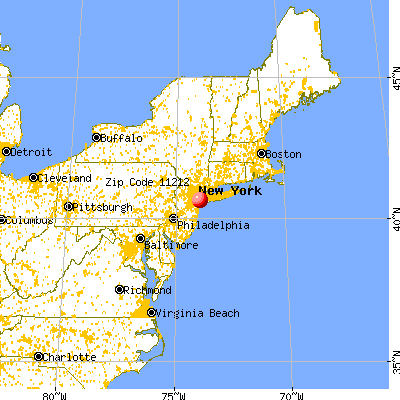


 Nearest zip codes: 11233, 11207, 11213, 11203, 11236, 11221.


 According to the data from the years 2007 - 2018 the average number of fire incidents per year is 561. The highest number of reported fire incidents - 717 took place in 2008, and the least - 503 in 2018. The data has a declining trend.
 When looking into fire subcategories, the most reports belonged to: Structure Fires (74.0%), and Outside Fires (16.6%).