Estimated zip code population in 2022: 89,788 Zip code population in 2010: 78,895 Zip code population in 2000: 76,363
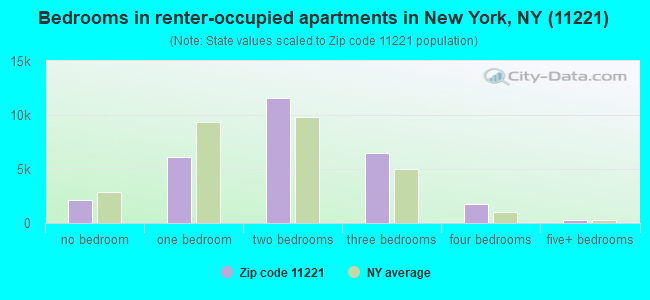
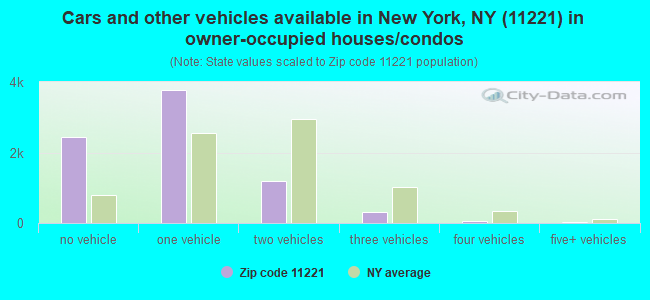
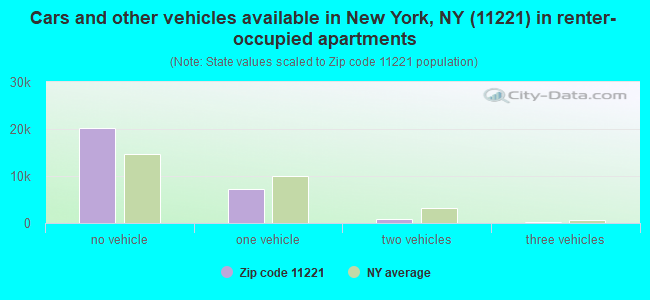
Houses and condos: 38,370 Renter-occupied apartments: 28,525
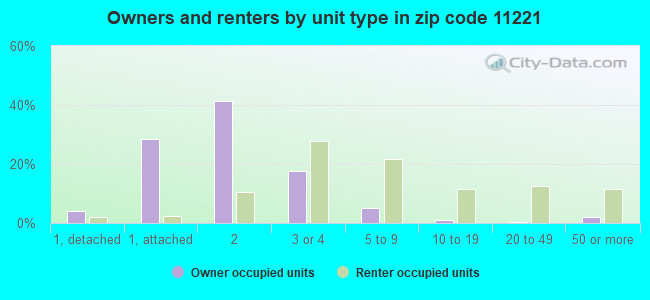
% of renters here:
79%
State:
46%
March 2022 cost of living index in zip code 11221: 160.5 (very high, U.S. average is 100)
Land area: 1.4 sq. mi. Water area: 0.0 sq. mi.
Population density: 64,907 people per square mile
(very high).
OSM Map
General Map
Google Map
MSN Map
OSM Map
General Map
Google Map
MSN Map
OSM Map
General Map
Google Map
MSN Map
OSM Map
General Map
Google Map
MSN Map
Please wait while loading the map...
Real estate property taxes paid for housing units in 2022:
This zip code:
0.3% ($3,841)
New York:
1.5% ($6,180)
Median real estate property taxes paid for housing units with mortgages in 2022: $3,717 (0.3%) Median real estate property taxes paid for housing units with no mortgage in 2022: $4,352 (0.4%)
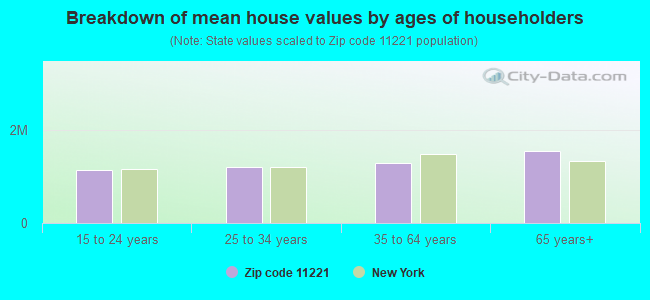
Estimated median house/condo value in 2022: $1,128,125
11221:
$1,128,125
New York:
$400,400
According to our research of New York and other state lists, there were 85 registered sex offenders living in 11221 zip code as of April 27, 2024. The ratio of all residents to sex offenders in zip code 11221 is 1,003 to 1. The ratio of registered sex offenders to all residents in this zip code is near the state average.
Median resident age:
This zip code:
32.9 years
New York median age:
40.0 years
Average household size:
This zip code:
2.4 people
New York:
2.5 people
Averages for the 2020 tax year for zip code 11221, filed in 2021:
Average Adjusted Gross Income (AGI) in 2020: $49,899 (Individual Income Tax Returns)
Here:
$49,899
State:
$90,930
Salary/wage: $47,927 (reported on 84.4% of returns)
Here:
$47,927
State:
$72,104
(% of AGI for various income ranges: 976.9% for AGIs below $25k, 3501.3% for AGIs $25k-50k, 6961.6% for AGIs $50k-75k, 10963.9% for AGIs $75k-100k, 18938.1% for AGIs $100k-200k, 82154.0% for AGIs over 200k)
Taxable interest for individuals: $496 (reported on 14.6% of returns)
This zip code:
$496
New York:
$3,075
(% of AGI for various income ranges: 3.7% for AGIs below $25k, 4.8% for AGIs $25k-50k, 5.4% for AGIs $50k-75k, 13.4% for AGIs $75k-100k, 30.8% for AGIs $100k-200k, 325.3% for AGIs over 200k)
Ordinary dividends: $1,891 (reported on 9.8% of returns)
Here:
$1,891
State:
$11,095
(% of AGI for various income ranges: 5.5% for AGIs below $25k, 8.9% for AGIs $25k-50k, 20.6% for AGIs $50k-75k, 42.6% for AGIs $75k-100k, 91.9% for AGIs $100k-200k, 832.3% for AGIs over 200k)
Net capital gain/loss in AGI: +$7,613 (reported on 10.1% of returns)
Here:
+$7,613
State:
+$44,925
(% of AGI for various income ranges: 7.3% for AGIs below $25k, 17.7% for AGIs $25k-50k, 31.0% for AGIs $50k-75k, 127.5% for AGIs $75k-100k, 257.0% for AGIs $100k-200k, 6871.3% for AGIs over 200k)
Profit/loss from business: +$8,739 (reported on 20.6% of returns)
Here:
+$8,739
State:
+$14,940
(% of AGI for various income ranges: 204.7% for AGIs below $25k, 160.3% for AGIs $25k-50k, 149.7% for AGIs $50k-75k, 285.0% for AGIs $75k-100k, 592.2% for AGIs $100k-200k, 3725.0% for AGIs over 200k)
Taxable individual retirement arrangement distribution: $11,878 (reported on 1.4% of returns)
11221:
$11,878
New York:
$19,609
(% of AGI for various income ranges: 6.5% for AGIs below $25k, 10.7% for AGIs $25k-50k, 20.0% for AGIs $50k-75k, 53.7% for AGIs $75k-100k, 92.4% for AGIs $100k-200k, 366.3% for AGIs over 200k)
Self-employed (Keogh) retirement plans: $19,760 (reported on 0.4% of returns)
11221:
$19,760
New York:
$32,497
(% of AGI for various income ranges: 3.1% for AGIs $25k-50k, 14.5% for AGIs $75k-100k, 25.6% for AGIs $100k-200k, 610.3% for AGIs over 200k)
Total itemized deductions: $26,730 (reported on 5.2% of returns)
Here:
$26,730
State:
$39,326
(% of AGI for various income ranges: 21.2% for AGIs below $25k, 52.6% for AGIs $25k-50k, 154.4% for AGIs $50k-75k, 425.1% for AGIs $75k-100k, 923.7% for AGIs $100k-200k, 5089.7% for AGIs over 200k)
Charity contributions: $5,812 (reported on 4.0% of returns)
Here:
$5,812
State:
$15,420
(% of AGI for various income ranges: 1.7% for AGIs below $25k, 7.3% for AGIs $25k-50k, 29.6% for AGIs $50k-75k, 74.4% for AGIs $75k-100k, 175.8% for AGIs $100k-200k, 734.3% for AGIs over 200k)
Taxes paid: $8,306 (reported on 5.2% of returns)
11221:
$8,306
State:
$9,183
(% of AGI for various income ranges: 3.5% for AGIs below $25k, 13.3% for AGIs $25k-50k, 45.6% for AGIs $50k-75k, 147.8% for AGIs $75k-100k, 342.8% for AGIs $100k-200k, 1346.7% for AGIs over 200k)
Earned income credit: $1,908 (reported on 18.8% of returns)
Here:
$1,908
State:
$2,138
(% of AGI for various income ranges: 89.8% for AGIs below $25k, 50.4% for AGIs $25k-50k, 0.3% for AGIs $50k-75k)
Percentage of individuals using paid preparers for their 2020 taxes: 94.6%
Here:
95%
State:
95%
(% for various income ranges: 93.1% for AGIs below $25k, 95.2% for AGIs $25k-50k, 95.7% for AGIs $50k-75k, 95.8% for AGIs $75k-100k, 95.2% for AGIs $100k-200k, 97.6% for AGIs over 200k)
Averages for the 2012 tax year for zip code 11221, filed in 2013:
Average Adjusted Gross Income (AGI) in 2012: $30,619 (Individual Income Tax Returns)
Here:
$30,619
State:
$77,088
Salary/wage: $32,026 (reported on 83.7% of returns)
Here:
$32,026
State:
$60,593
(% of AGI for various income ranges: 72.4% for AGIs below $25k, 93.9% for AGIs $25k-50k, 93.2% for AGIs $50k-75k, 92.4% for AGIs $75k-100k, 88.2% for AGIs $100k-200k, 71.0% for AGIs over 200k)
Taxable interest for individuals: $311 (reported on 12.5% of returns)
This zip code:
$311
New York:
$3,125
(% of AGI for various income ranges: 0.1% for AGIs below $25k, 0.1% for AGIs $50k-75k, 0.1% for AGIs $75k-100k, 0.1% for AGIs $100k-200k, 0.4% for AGIs over 200k)
Ordinary dividends: $1,775 (reported on 3.9% of returns)
Here:
$1,775
State:
$10,299
(% of AGI for various income ranges: 0.4% for AGIs below $25k, 0.1% for AGIs $25k-50k, 0.2% for AGIs $50k-75k, 0.1% for AGIs $75k-100k, 0.2% for AGIs $100k-200k, 0.5% for AGIs over 200k)
Net capital gain/loss in AGI: +$2,021 (reported on 2.8% of returns)
Here:
+$2,021
State:
+$42,474
(% of AGI for various income ranges: 0.5% for AGIs $100k-200k, 4.8% for AGIs over 200k)
Profit/loss from business: +$7,596 (reported on 20.3% of returns)
Here:
+$7,596
State:
+$16,168
(% of AGI for various income ranges: 18.3% for AGIs below $25k, 1.5% for AGIs $25k-50k, 1.0% for AGIs $50k-75k, 0.9% for AGIs $75k-100k, 1.2% for AGIs $100k-200k, 0.5% for AGIs over 200k)
Taxable individual retirement arrangement distribution: $10,470 (reported on 1.3% of returns)
11221:
$10,470
New York:
$17,621
(% of AGI for various income ranges: 0.3% for AGIs below $25k, 0.3% for AGIs $25k-50k, 0.6% for AGIs $50k-75k, 0.5% for AGIs $75k-100k, 0.7% for AGIs $100k-200k)
Total itemized deductions: $17,838 (28% of AGI, reported on 20.0% of returns)
Here:
$17,838
State:
$34,985
Here:
27.8% of AGI
State:
21.3% of AGI
(% of AGI for various income ranges: 3.9% for AGIs below $25k, 9.5% for AGIs $25k-50k, 15.0% for AGIs $50k-75k, 18.7% for AGIs $75k-100k, 19.3% for AGIs $100k-200k, 16.1% for AGIs over 200k)
Charity contributions: $3,072 (reported on 15.7% of returns)
Here:
$3,072
State:
$5,572
(% of AGI for various income ranges: 0.4% for AGIs below $25k, 1.3% for AGIs $25k-50k, 2.2% for AGIs $50k-75k, 2.5% for AGIs $75k-100k, 2.5% for AGIs $100k-200k, 2.0% for AGIs over 200k)
Taxes paid: $6,195 (reported on 19.9% of returns)
11221:
$6,195
State:
$18,656
(% of AGI for various income ranges: 0.7% for AGIs below $25k, 2.2% for AGIs $25k-50k, 5.2% for AGIs $50k-75k, 7.8% for AGIs $75k-100k, 8.8% for AGIs $100k-200k, 9.4% for AGIs over 200k)
Earned income credit: $2,413 (reported on 35.4% of returns)
Here:
$2,413
State:
$2,230
(% of AGI for various income ranges: 10.7% for AGIs below $25k, 1.2% for AGIs $25k-50k)
Percentage of individuals using paid preparers for their 2012 taxes: 63.9%
Here:
64%
State:
66%
(% for various income ranges: 62.8% for AGIs below $25k, 62.9% for AGIs $25k-50k, 66.5% for AGIs $50k-75k, 70.3% for AGIs $75k-100k, 75.3% for AGIs $100k-200k, 66.7% for AGIs over 200k)
Averages for the 2004 tax year for zip code 11221, filed in 2005:
Average Adjusted Gross Income (AGI) in 2004: $25,409 (Individual Income Tax Returns)
Here:
$25,409
State:
$59,519
Salary/wage: $27,055 (reported on 87.1% of returns)
Here:
$27,055
State:
$50,673
(% of AGI for various income ranges: 73.5% for AGIs below $10k, 86.8% for AGIs $10k-25k, 97.9% for AGIs $25k-50k, 96.1% for AGIs $50k-75k, 92.6% for AGIs $75k-100k, 84.1% for AGIs over 100k)
Taxable interest for individuals: $294 (reported on 18.0% of returns)
This zip code:
$294
New York:
$2,377
(% of AGI for various income ranges: 0.6% for AGIs below $10k, 0.2% for AGIs $10k-25k, 0.2% for AGIs $25k-50k, 0.3% for AGIs $50k-75k, 0.2% for AGIs $75k-100k, 0.2% for AGIs over 100k)
Taxable dividends: $438 (reported on 3.7% of returns)
Here:
$438
State:
$5,394
(% of AGI for various income ranges: 0.1% for AGIs below $10k, 0.0% for AGIs $10k-25k, 0.1% for AGIs $25k-50k, 0.1% for AGIs $50k-75k, 0.1% for AGIs $75k-100k, 0.1% for AGIs over 100k)
Net capital gain/loss: +$2,998 (reported on 2.1% of returns)
Here:
+$2,998
State:
+$23,581
(% of AGI for various income ranges: -0.1% for AGIs below $10k, -0.0% for AGIs $10k-25k, -0.0% for AGIs $25k-50k, 0.0% for AGIs $50k-75k, 0.8% for AGIs $75k-100k, 4.3% for AGIs over 100k)
Profit/loss from business: +$6,511 (reported on 15.4% of returns)
Here:
+$6,511
State:
+$13,809
(% of AGI for various income ranges: 31.9% for AGIs below $10k, 9.0% for AGIs $10k-25k, 0.5% for AGIs $25k-50k, 0.4% for AGIs $50k-75k, 0.2% for AGIs $75k-100k, -0.1% for AGIs over 100k)
IRA payment deduction: $1,523 (reported on 1.1% of returns)
11221:
$1,523
New York:
$3,115
(% of AGI for various income ranges: 0.1% for AGIs below $10k, 0.1% for AGIs $10k-25k, 0.1% for AGIs $25k-50k, 0.1% for AGIs $50k-75k, 0.1% for AGIs $75k-100k)
Total itemized deductions: $16,038 (35% of AGI, reported on 25.3% of returns)
Here:
$16,038
State:
$25,864
Here:
34.9% of AGI
State:
21.9% of AGI
(% of AGI for various income ranges: 3.9% for AGIs below $10k, 8.1% for AGIs $10k-25k, 16.9% for AGIs $25k-50k, 22.6% for AGIs $50k-75k, 22.8% for AGIs $75k-100k, 22.1% for AGIs over 100k)
Charity contributions deductions: $3,298 (7% of AGI, reported on 23.0% of returns)
Here:
$3,298
State:
$4,439
Here:
7.1% of AGI
State:
3.6% of AGI
(% of AGI for various income ranges: 0.3% for AGIs below $10k, 1.3% for AGIs $10k-25k, 3.3% for AGIs $25k-50k, 4.4% for AGIs $50k-75k, 4.3% for AGIs $75k-100k, 4.0% for AGIs over 100k)
Total tax: $2,498 (reported on 59.7% of returns)
11221:
$2,498
State:
$11,730
(% of AGI for various income ranges: 5.1% for AGIs below $10k, 3.1% for AGIs $10k-25k, 4.8% for AGIs $25k-50k, 8.2% for AGIs $50k-75k, 10.3% for AGIs $75k-100k, 14.0% for AGIs over 100k)
Earned income credit: $2,021 (reported on 41.9% of returns)
Here:
$2,021
State:
$1,757
Percentage of individuals using paid preparers for their 2004 taxes: 72.0%
Here:
72%
State:
67%
(% for various income ranges: 69.7% for AGIs below $10k, 75.1% for AGIs $10k-25k, 70.5% for AGIs $25k-50k, 71.6% for AGIs $50k-75k, 71.3% for AGIs $75k-100k, 76.8% for AGIs over 100k)
Likely homosexual households (counted as self-reported same-sex unmarried-partner households)
Lesbian couples: 0.3% of all households
Gay men: 0.6% of all households
Household received Food Stamps/SNAP in the past 12 months: 8,647 Household did not receive Food Stamps/SNAP in the past 12 months: 27,711
Women who had a birth in the past 12 months: 697 (385 now married, 317 unmarried) Women who did not have a birth in the past 12 months: 28,193 (5,969 now married, 22,431 unmarried)
Housing units in zip code 11221 with a mortgage: 5,345 (683 second mortgage, 51 home equity loan, 519 both second mortgage and home equity loan) Houses without a mortgage: 48
Median monthly owner costs for units with a mortgage: $3,520 Median monthly owner costs for units without a mortgage: $932
Residents with income below the poverty level in 2022:
This zip code:
22.7%
Whole state:
14.3%
Residents with income below 50% of the poverty level in 2022:
This zip code:
9.8%
Whole state:
6.8%
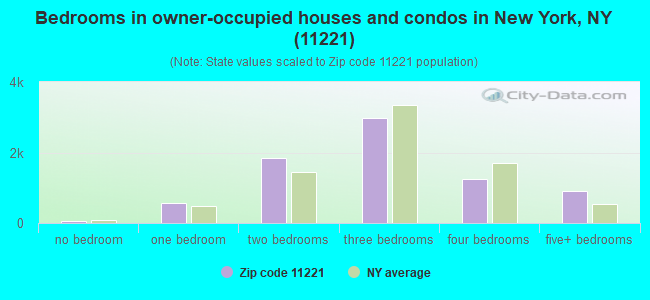
Median number of rooms in houses and condos:
Here:
5.5
State:
6.3
Median number of rooms in apartments:
Here:
3.9
State:
3.8
Notable locations in this zip code not listed on our city pages
Notable locations in zip code 11221: Seventyninth Precinct Station House (A), Tompkins Park Recreation Center (B), Eightyfirst Precinct Police Station (C), Saint John's Bread And Life Center (D), Fire Department New York Engine 217 (E), Fire Department New York Engine 218 (F), Fire Department New York Engine 222 Battalion 37 (G), Fire Department New York City Engine 277 Ladder 112 (H), New York Ladder Company 112 (I), Ridgewood/Bushwick Community Youth Center (J). Display/hide their locations on the map
Churches in zip code 11221 include: Saint Paul's Church of Christ Disciples (A), Pilgrim Baptist Church (B), Trinity Tabernacle Pentecostal (C), Church of God of Prophecy (D), Kingdom Hall of Jehovahs Witnesses (E), Missionary Church of Christ (F), Universal Baptist Church (G), Bridge Street African Methodist Episcopal Church (H), Saints Stephen And Martin Episcopal Church (I). Display/hide their locations on the map
Parks in zip code 11221 include: Stuyvesant Park (1), Israel Putnam Playground (2), Police Officer Reinaldo Salgado Playground (3), Goodwin Gardens (4), Heckscher Playground (5), Bushwick Playground (6), Fermi Playground (7), Beattie Triangle (8), Freedom Square (9). Display/hide their locations on the map
5,499 married couples with children.
6,324 single-parent households (907 men, 5,417 women).
64.7% of residents of 11221 zip code speak English at home.
24.3% of residents speak Spanish at home (60% very well, 17% well, 15% not well, 8% not at all).
5.5% of residents speak other Indo-European language at home (73% very well, 20% well, 7% not well).
2.6% of residents speak Asian or Pacific Island language at home (58% very well, 13% well, 16% not well, 12% not at all).
2.3% of residents speak other language at home (64% very well, 31% well, 5% not well).
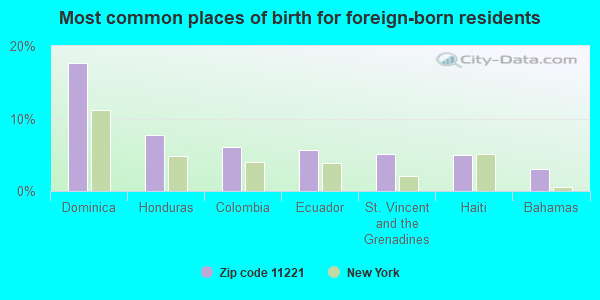
Foreign born population: 22,735 (25.3%) (57.3% of them are naturalized citizens)
This zip code:
25.3%
Whole state:
22.7%
18%Dominica
8%Honduras
6%Colombia
6%Ecuador
5%St. Vincent and the Grenadines
5%Haiti
3%Bahamas
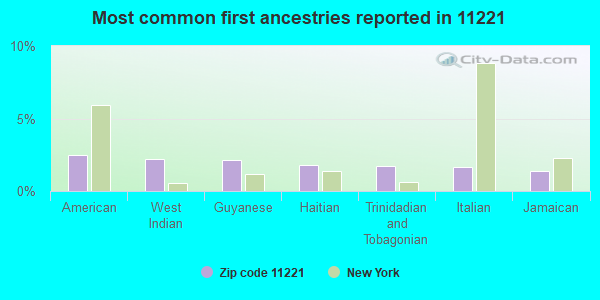
2%American
2%West Indian
2%Guyanese
2%Haitian
2%Trinidadian and Tobagonian
2%Italian
1%Jamaican
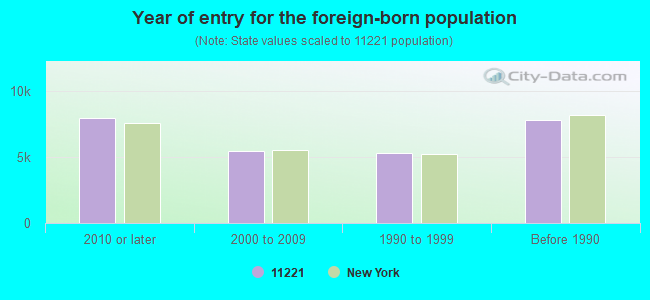
Year of entry for the foreign-born population
7,9632010 or later
5,4612000 to 2009
5,2641990 to 1999
7,761Before 1990
Facilities with environmental interests located in this zip code:
I.S. 291 (231 PALMETTO ST in BROOKLYN, NY)
STATE MASTER (New York facility tracking) - AIR PROGRAM (Integrated Compliance Information System) - ICIS-02-1999-1116, FORMAL ENFORCEMENT ACTION Business SIC classification: SPECIAL TRADE CONTRACTORS; ELEMENTARY AND SECONDARY SCHOOLS Business NAICS classification: ELEMENTARY AND SECONDARY SCHOOLS. Organizations: NYC DEPT OF EDUCATION (LEGALLY RESPONSIBLE PARTY)
Alternative names: INTERMEDIATE SCH 291, IS 291 ROLAND HAYES SCHOOL
BETTY BRITE CLEANERS (318 LEWIS AVENUE in BROOKLYN, NY)
AIR MINOR (AIRS/AFS) STATE MASTER (New York facility tracking) - AIR PROGRAM, HAZARDOUS WASTE PROGRAM (Resource Conservation and Recovery Act (tracking hazardous waste)) Business SIC classification: DRYCLEANING PLANTS, EXCEPT RUG CLEANING Business NAICS classification: DRYCLEANING AND LAUNDRY SERVICES (EXCEPT COIN-OPERATED). Organizations: VNL CORP (LEGALLY RESPONSIBLE PARTY)
IS 111 (35 STARR ST in BROOKLYN, NY)
STATE MASTER (New York facility tracking) - AIR PROGRAM Small Quantity Generators, between 100 kg and 1000 kg of hazardous waste/month (Resource Conservation and Recovery Act (tracking hazardous waste)) - notification Business SIC and NAICS classification: ELEMENTARY AND SECONDARY SCHOOLS Organizations: NYC BOARD OF EDUCATION (CONTACT/OWNER)
, NYC DEPT OF EDUCATION (LEGALLY RESPONSIBLE PARTY)
Alternative names: NYC BD OF ED - IS 111K, NYC BD OF ED - PUBLIC SCHOOL 111 BKLYN
IS 347 SCHOOL FOR HUMANITIES ( in BROOKLYN, NY)
(National Center for Education Statistics) - STATE ID-333200010347 Organizations: NEW YORK CITY PUBLIC SCHOOLS (SCHOOL DISTRICT)
I.S. 57 - K (125 STUYVESANT AVENUE in BROOKLYN, NY)
(Integrated Compliance Information System) - ICIS-02-1988-0588, FORMAL ENFORCEMENT ACTION, ICIS-02-1994-0052, Business SIC classification: WRECKING AND DEMOLITION WORK
BETTER HOUSE CORP (1245 BROADWAY in BROOKLYN, NY)
COMPLIANCE ACTIVITY (Tracking inspections of insecticide, fungicide, and rodenticide, and toxic substances)
J A PROFESSIONAL DRY CLEANERS (769 SARATOGA AVE in BROOKLYN, NY)
Small Quantity Generators, between 100 kg and 1000 kg of hazardous waste/month (Resource Conservation and Recovery Act (tracking hazardous waste)) - notification Organizations: JOSHUA GOLDSON (CONTACT/OWNER)
Housing units lacking complete plumbing facilities: 1.4% Housing units lacking complete kitchen facilities: 1.8%
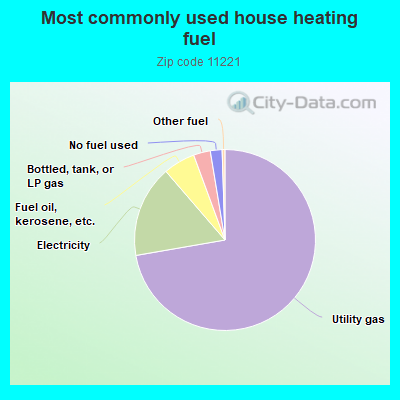
72.2%Utility gas
16.4%Electricity
5.7%Fuel oil, kerosene, etc.
3.0%Bottled, tank, or LP gas
2.1%No fuel used
0.5%Other fuel
Population in 1990: 70,583. Population change in the 1990s: +5,780 (+8.2%).
Place of birth for U.S.-born residents:
This state: 43,772
Northeast: 4,841
Midwest: 2,723
South: 7,933
West: 4,396
63% of the 11221 zip code residents lived in the same house 5 years ago. Out of people who lived in different houses, 80% lived in this county. Out of people who lived in different counties, 50% lived in New York.
86% of the 11221 zip code residents lived in the same house 1 year ago. Out of people who lived in different houses, 59% moved from this county. Out of people who lived in different houses, 22% moved from different county within same state. Out of people who lived in different houses, 15% moved from different state. Out of people who lived in different houses, 4% moved from abroad.
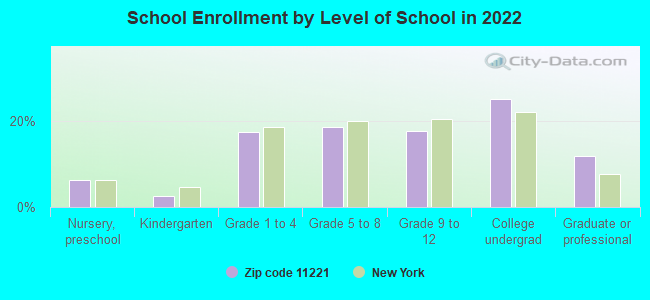
Private vs. public school enrollment:
Students in private schools in grades 1 to 8 (elementary and middle school): 675
Here:
9.5%
New York:
15.6%
Students in private schools in grades 9 to 12 (high school): 480
Here:
13.7%
New York:
15.0%
Students in private undergraduate colleges: 2,303
Here:
46.2%
New York:
39.2%
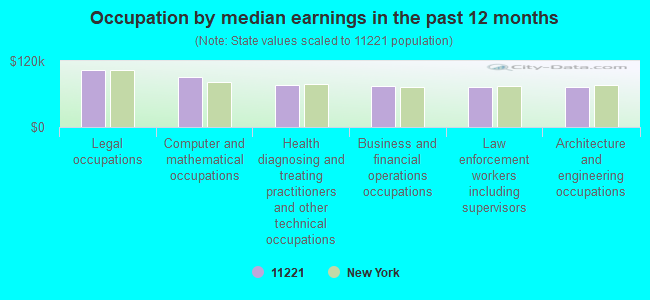
Occupation by median earnings in the past 12 months ($)
102,835Legal occupations
90,284Computer and mathematical occupations
75,534Health diagnosing and treating practitioners and other technical occupations
74,991Business and financial operations occupations
73,314Law enforcement workers including supervisors
71,948Architecture and engineering occupations
Companies with federal contracts located in this zip code:
WOLF CONDENSER WORKS INC (709 HART ST in BROOKLYN, NY; small business) : $44,195 in 3 contractsfrom 2004 to 2005
$24,220 with Navy for Heat Exchangers and Steam Condensers. Signed on 2005-05-02. Completion date: 2005-08-19.
$19,750 with Navy for Maintenance, Repair and Rebuilding of Equipment -- Tires and Tubes. Signed on 2004-12-14. Completion date: 2005-01-06.
$225, same as above.Signed on 2004-12-14. Completion date: 2005-01-06.
Top industries in this zip code by the number of employees in 2005:
Health Care and Social Assistance: Home Health Care Services (500-999 employees: 1 establishment, 1-4 employees: 1 establishment)
Health Care and Social Assistance: Nursing Care Facilities (250-499: 2, 1-4: 1)
Health Care and Social Assistance: Child Day Care Services (20-49: 8, 10-19: 7, 5-9: 4, 1-4: 14)
Other Services (except Public Administration): Religious Organizations (100-249: 1, 10-19: 2, 5-9: 6, 1-4: 16)
Wholesale Trade: Plumbing and Heating Equipment and Supplies (Hydronics) Merchant Wholesalers (100-249: 1)
2007 - 2018 National Fire Incident Reporting System (NFIRS) incidents
According to the data from the years 2007 - 2018 the average number of fires per year is 441. The highest number of reported fires - 562 took place in 2009, and the least - 350 in 2017. The data has a decreasing trend.
When looking into fire subcategories, the most reports belonged to: Structure Fires (75.4%), and Outside Fires (16.6%).
Fire incident types reported to NFIRS in Zip Code 11221

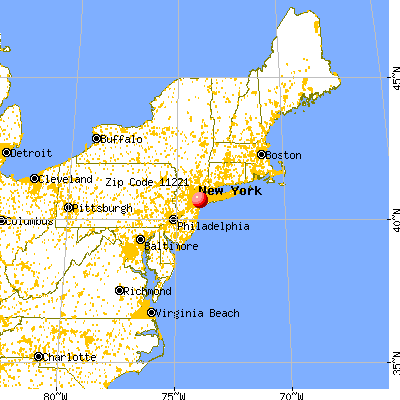


 Nearest zip codes: 11237, 11233, 11206, 11213, 11216, 11212.


 According to the data from the years 2007 - 2018 the average number of fires per year is 441. The highest number of reported fires - 562 took place in 2009, and the least - 350 in 2017. The data has a decreasing trend.
 When looking into fire subcategories, the most reports belonged to: Structure Fires (75.4%), and Outside Fires (16.6%).