Estimated zip code population in 2022: 88,521 Zip code population in 2010: 81,677 Zip code population in 2000: 69,032
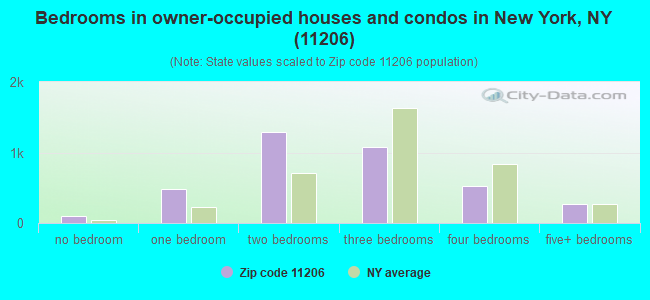
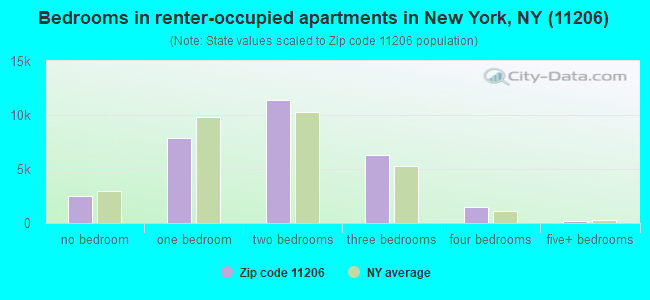
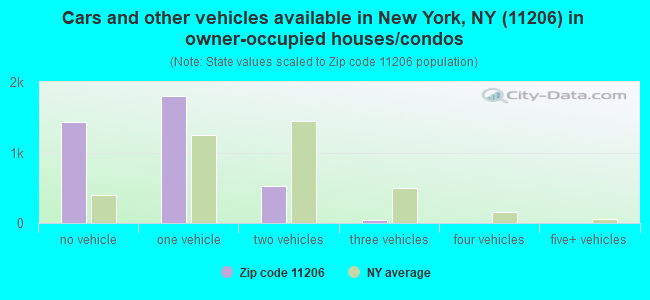
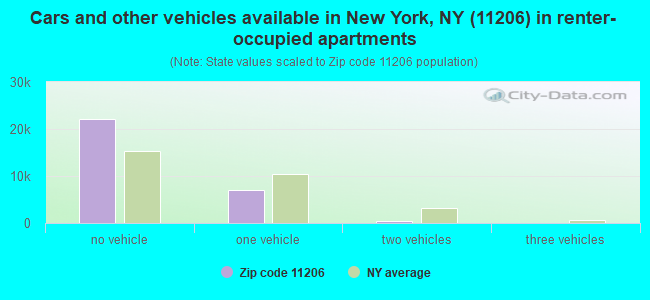
Houses and condos: 34,428 Renter-occupied apartments: 29,851
% of renters here:
89%
State:
46%
March 2022 cost of living index in zip code 11206: 162.9 (very high, U.S. average is 100)
Land area: 1.4 sq. mi. Water area: 0.0 sq. mi.
Population density: 61,711 people per square mile
(very high).
OSM Map
General Map
Google Map
MSN Map
OSM Map
General Map
Google Map
MSN Map
OSM Map
General Map
Google Map
MSN Map
OSM Map
General Map
Google Map
MSN Map
Please wait while loading the map...
Real estate property taxes paid for housing units in 2022:
This zip code:
0.5% ($4,280)
New York:
1.5% ($6,180)
Median real estate property taxes paid for housing units with mortgages in 2022: $4,270 (0.5%) Median real estate property taxes paid for housing units with no mortgage in 2022: $4,456 (0.6%)
Estimated median house/condo value in 2022: $885,446
11206:
$885,446
New York:
$400,400
According to our research of New York and other state lists, there were 38 registered sex offenders living in 11206 zip code as of April 27, 2024. The ratio of all residents to sex offenders in zip code 11206 is 2,309 to 1. The ratio of registered sex offenders to all residents in this zip code is lower than the state average.
Median resident age:
This zip code:
30.9 years
New York median age:
40.0 years
Average household size:
This zip code:
2.6 people
New York:
2.5 people
Averages for the 2020 tax year for zip code 11206, filed in 2021:
Average Adjusted Gross Income (AGI) in 2020: $47,325 (Individual Income Tax Returns)
Here:
$47,325
State:
$90,930
Salary/wage: $44,140 (reported on 84.4% of returns)
Here:
$44,140
State:
$72,104
(% of AGI for various income ranges: 991.3% for AGIs below $25k, 3426.9% for AGIs $25k-50k, 6844.7% for AGIs $50k-75k, 10442.8% for AGIs $75k-100k, 18503.8% for AGIs $100k-200k, 89581.6% for AGIs over 200k)
Taxable interest for individuals: $758 (reported on 14.3% of returns)
This zip code:
$758
New York:
$3,075
(% of AGI for various income ranges: 2.6% for AGIs below $25k, 4.0% for AGIs $25k-50k, 9.0% for AGIs $50k-75k, 21.6% for AGIs $75k-100k, 30.9% for AGIs $100k-200k, 1145.8% for AGIs over 200k)
Ordinary dividends: $1,947 (reported on 10.0% of returns)
Here:
$1,947
State:
$11,095
(% of AGI for various income ranges: 4.6% for AGIs below $25k, 8.0% for AGIs $25k-50k, 21.0% for AGIs $50k-75k, 45.1% for AGIs $75k-100k, 80.6% for AGIs $100k-200k, 1627.4% for AGIs over 200k)
Net capital gain/loss in AGI: +$8,660 (reported on 10.4% of returns)
Here:
+$8,660
State:
+$44,925
(% of AGI for various income ranges: 5.0% for AGIs below $25k, 12.5% for AGIs $25k-50k, 37.5% for AGIs $50k-75k, 138.0% for AGIs $75k-100k, 348.3% for AGIs $100k-200k, 12060.5% for AGIs over 200k)
Profit/loss from business: +$10,420 (reported on 17.6% of returns)
Here:
+$10,420
State:
+$14,940
(% of AGI for various income ranges: 170.7% for AGIs below $25k, 145.0% for AGIs $25k-50k, 194.2% for AGIs $50k-75k, 278.7% for AGIs $75k-100k, 735.6% for AGIs $100k-200k, 5794.7% for AGIs over 200k)
Taxable individual retirement arrangement distribution: $10,362 (reported on 1.2% of returns)
11206:
$10,362
New York:
$19,609
(% of AGI for various income ranges: 7.1% for AGIs below $25k, 8.2% for AGIs $25k-50k, 18.1% for AGIs $50k-75k, 28.0% for AGIs $75k-100k, 82.8% for AGIs $100k-200k, 232.1% for AGIs over 200k)
Self-employed (Keogh) retirement plans: $16,800 (reported on 0.3% of returns)
11206:
$16,800
New York:
$32,497
(% of AGI for various income ranges: 1.0% for AGIs below $25k, 8.4% for AGIs $50k-75k, 36.3% for AGIs $100k-200k, 472.6% for AGIs over 200k)
Total itemized deductions: $44,767 (reported on 3.9% of returns)
Here:
$44,767
State:
$39,326
(% of AGI for various income ranges: 8.8% for AGIs below $25k, 29.7% for AGIs $25k-50k, 116.7% for AGIs $50k-75k, 270.8% for AGIs $75k-100k, 903.0% for AGIs $100k-200k, 20175.8% for AGIs over 200k)
Charity contributions: $33,691 (reported on 2.8% of returns)
Here:
$33,691
State:
$15,420
(% of AGI for various income ranges: 5.6% for AGIs $25k-50k, 25.3% for AGIs $50k-75k, 69.8% for AGIs $75k-100k, 296.8% for AGIs $100k-200k, 15368.9% for AGIs over 200k)
Taxes paid: $7,594 (reported on 3.9% of returns)
11206:
$7,594
State:
$9,183
(% of AGI for various income ranges: 2.0% for AGIs below $25k, 7.5% for AGIs $25k-50k, 32.7% for AGIs $50k-75k, 90.3% for AGIs $75k-100k, 271.6% for AGIs $100k-200k, 1382.1% for AGIs over 200k)
Earned income credit: $2,638 (reported on 25.1% of returns)
Here:
$2,638
State:
$2,138
(% of AGI for various income ranges: 144.3% for AGIs below $25k, 94.4% for AGIs $25k-50k, 1.3% for AGIs $50k-75k)
Percentage of individuals using paid preparers for their 2020 taxes: 95.0%
Here:
95%
State:
95%
(% for various income ranges: 93.8% for AGIs below $25k, 95.7% for AGIs $25k-50k, 96.4% for AGIs $50k-75k, 95.2% for AGIs $75k-100k, 95.3% for AGIs $100k-200k, 97.2% for AGIs over 200k)
Averages for the 2012 tax year for zip code 11206, filed in 2013:
Average Adjusted Gross Income (AGI) in 2012: $31,350 (Individual Income Tax Returns)
Here:
$31,350
State:
$77,088
Salary/wage: $31,013 (reported on 85.3% of returns)
Here:
$31,013
State:
$60,593
(% of AGI for various income ranges: 75.4% for AGIs below $25k, 92.3% for AGIs $25k-50k, 91.8% for AGIs $50k-75k, 90.4% for AGIs $75k-100k, 85.3% for AGIs $100k-200k, 46.7% for AGIs over 200k)
Taxable interest for individuals: $585 (reported on 13.6% of returns)
This zip code:
$585
New York:
$3,125
(% of AGI for various income ranges: 0.2% for AGIs below $25k, 0.2% for AGIs $25k-50k, 0.2% for AGIs $50k-75k, 0.2% for AGIs $75k-100k, 0.3% for AGIs $100k-200k, 1.1% for AGIs over 200k)
Ordinary dividends: $1,736 (reported on 6.0% of returns)
Here:
$1,736
State:
$10,299
(% of AGI for various income ranges: 0.2% for AGIs below $25k, 0.2% for AGIs $25k-50k, 0.3% for AGIs $50k-75k, 0.4% for AGIs $75k-100k, 0.4% for AGIs $100k-200k, 1.2% for AGIs over 200k)
Net capital gain/loss in AGI: +$4,011 (reported on 4.7% of returns)
Here:
+$4,011
State:
+$42,474
(% of AGI for various income ranges: 1.2% for AGIs $100k-200k, 6.8% for AGIs over 200k)
Profit/loss from business: +$8,941 (reported on 20.7% of returns)
Here:
+$8,941
State:
+$16,168
(% of AGI for various income ranges: 16.2% for AGIs below $25k, 2.8% for AGIs $25k-50k, 2.5% for AGIs $50k-75k, 2.6% for AGIs $75k-100k, 3.2% for AGIs $100k-200k, 4.5% for AGIs over 200k)
Taxable individual retirement arrangement distribution: $8,626 (reported on 1.5% of returns)
11206:
$8,626
New York:
$17,621
(% of AGI for various income ranges: 0.5% for AGIs below $25k, 0.3% for AGIs $25k-50k, 0.5% for AGIs $50k-75k, 0.3% for AGIs $75k-100k, 0.8% for AGIs $100k-200k)
Self-employment retirement plans: $11,560 (reported on 0.1% of returns)
11206:
$11,560
New York:
$27,330
Total itemized deductions: $19,522 (26% of AGI, reported on 16.4% of returns)
Here:
$19,522
State:
$34,985
Here:
25.9% of AGI
State:
21.3% of AGI
(% of AGI for various income ranges: 2.6% for AGIs below $25k, 7.3% for AGIs $25k-50k, 11.4% for AGIs $50k-75k, 14.6% for AGIs $75k-100k, 17.3% for AGIs $100k-200k, 27.8% for AGIs over 200k)
Charity contributions: $5,809 (reported on 12.3% of returns)
Here:
$5,809
State:
$5,572
(% of AGI for various income ranges: 0.2% for AGIs below $25k, 1.1% for AGIs $25k-50k, 1.7% for AGIs $50k-75k, 2.0% for AGIs $75k-100k, 3.2% for AGIs $100k-200k, 15.4% for AGIs over 200k)
Taxes paid: $7,117 (reported on 16.3% of returns)
11206:
$7,117
State:
$18,656
(% of AGI for various income ranges: 0.7% for AGIs below $25k, 1.7% for AGIs $25k-50k, 4.2% for AGIs $50k-75k, 6.9% for AGIs $75k-100k, 8.4% for AGIs $100k-200k, 9.5% for AGIs over 200k)
Earned income credit: $2,676 (reported on 37.0% of returns)
Here:
$2,676
State:
$2,230
(% of AGI for various income ranges: 12.3% for AGIs below $25k, 1.2% for AGIs $25k-50k)
Percentage of individuals using paid preparers for their 2012 taxes: 62.2%
Here:
62%
State:
66%
(% for various income ranges: 63.1% for AGIs below $25k, 59.9% for AGIs $25k-50k, 59.4% for AGIs $50k-75k, 64.0% for AGIs $75k-100k, 70.1% for AGIs $100k-200k, 82.4% for AGIs over 200k)
Averages for the 2004 tax year for zip code 11206, filed in 2005:
Average Adjusted Gross Income (AGI) in 2004: $24,775 (Individual Income Tax Returns)
Here:
$24,775
State:
$59,519
Salary/wage: $23,976 (reported on 87.2% of returns)
Here:
$23,976
State:
$50,673
(% of AGI for various income ranges: 76.5% for AGIs below $10k, 85.6% for AGIs $10k-25k, 95.0% for AGIs $25k-50k, 92.7% for AGIs $50k-75k, 88.7% for AGIs $75k-100k, 32.5% for AGIs over 100k)
Taxable interest for individuals: $608 (reported on 20.4% of returns)
This zip code:
$608
New York:
$2,377
(% of AGI for various income ranges: 1.1% for AGIs below $10k, 0.4% for AGIs $10k-25k, 0.3% for AGIs $25k-50k, 0.4% for AGIs $50k-75k, 0.6% for AGIs $75k-100k, 1.1% for AGIs over 100k)
Taxable dividends: $1,451 (reported on 5.5% of returns)
Here:
$1,451
State:
$5,394
(% of AGI for various income ranges: 0.4% for AGIs below $10k, 0.1% for AGIs $10k-25k, 0.1% for AGIs $25k-50k, 0.3% for AGIs $50k-75k, 0.4% for AGIs $75k-100k, 1.4% for AGIs over 100k)
Net capital gain/loss: +$5,291 (reported on 3.6% of returns)
Here:
+$5,291
State:
+$23,581
(% of AGI for various income ranges: -0.4% for AGIs below $10k, -0.1% for AGIs $10k-25k, 0.0% for AGIs $25k-50k, 0.2% for AGIs $50k-75k, 1.4% for AGIs $75k-100k, 6.8% for AGIs over 100k)
Profit/loss from business: +$6,380 (reported on 16.1% of returns)
Here:
+$6,380
State:
+$13,809
(% of AGI for various income ranges: 23.9% for AGIs below $10k, 7.9% for AGIs $10k-25k, 1.1% for AGIs $25k-50k, 1.2% for AGIs $50k-75k, 1.5% for AGIs $75k-100k, 0.8% for AGIs over 100k)
IRA payment deduction: $2,499 (reported on 1.5% of returns)
11206:
$2,499
New York:
$3,115
(% of AGI for various income ranges: 0.1% for AGIs below $10k, 0.1% for AGIs $10k-25k, 0.2% for AGIs $25k-50k, 0.1% for AGIs $50k-75k, 0.1% for AGIs $75k-100k, 0.1% for AGIs over 100k)
Self-employed pension: $5,200 (reported on 0.1% of returns)
Here:
$5,200
New York:
$19,016
Total itemized deductions: $17,238 (32% of AGI, reported on 18.0% of returns)
Here:
$17,238
State:
$25,864
Here:
31.5% of AGI
State:
21.9% of AGI
(% of AGI for various income ranges: 1.6% for AGIs below $10k, 4.9% for AGIs $10k-25k, 12.4% for AGIs $25k-50k, 17.5% for AGIs $50k-75k, 18.5% for AGIs $75k-100k, 26.7% for AGIs over 100k)
Charity contributions deductions: $4,234 (8% of AGI, reported on 16.3% of returns)
Here:
$4,234
State:
$4,439
Here:
8.0% of AGI
State:
3.6% of AGI
(% of AGI for various income ranges: 0.1% for AGIs below $10k, 0.8% for AGIs $10k-25k, 2.5% for AGIs $25k-50k, 3.7% for AGIs $50k-75k, 3.8% for AGIs $75k-100k, 8.3% for AGIs over 100k)
Total tax: $3,057 (reported on 59.2% of returns)
11206:
$3,057
State:
$11,730
(% of AGI for various income ranges: 4.3% for AGIs below $10k, 3.3% for AGIs $10k-25k, 5.7% for AGIs $25k-50k, 9.1% for AGIs $50k-75k, 11.5% for AGIs $75k-100k, 19.6% for AGIs over 100k)
Earned income credit: $2,087 (reported on 42.5% of returns)
Here:
$2,087
State:
$1,757
Percentage of individuals using paid preparers for their 2004 taxes: 66.0%
Here:
66%
State:
67%
(% for various income ranges: 62.2% for AGIs below $10k, 67.8% for AGIs $10k-25k, 66.7% for AGIs $25k-50k, 65.9% for AGIs $50k-75k, 71.6% for AGIs $75k-100k, 79.1% for AGIs over 100k)
Likely homosexual households (counted as self-reported same-sex unmarried-partner households)
Lesbian couples: 0.1% of all households
Gay men: 0.4% of all households
Household received Food Stamps/SNAP in the past 12 months: 12,744 Household did not receive Food Stamps/SNAP in the past 12 months: 21,539
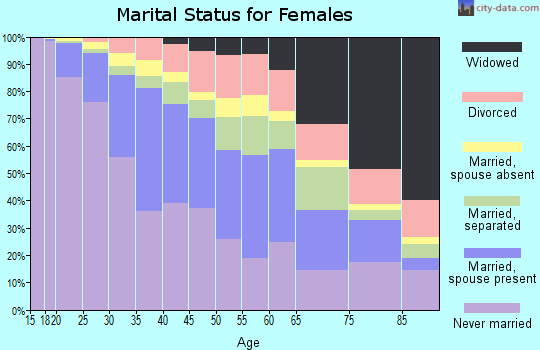
Women who had a birth in the past 12 months: 1,197 (793 now married, 406 unmarried) Women who did not have a birth in the past 12 months: 23,845 (6,185 now married, 17,780 unmarried)
Housing units in zip code 11206 with a mortgage: 2,304 (102 second mortgage, 103 both second mortgage and home equity loan) Houses without a mortgage: 23
Median monthly owner costs for units with a mortgage: $2,963 Median monthly owner costs for units without a mortgage: $932
Residents with income below the poverty level in 2022:
This zip code:
35.9%
Whole state:
14.3%
Residents with income below 50% of the poverty level in 2022:
This zip code:
21.2%
Whole state:
6.8%
Median number of rooms in houses and condos:
Here:
4.9
State:
6.3
Median number of rooms in apartments:
Here:
3.8
State:
3.8
Notable locations in this zip code not listed on our city pages
Notable locations in zip code 11206: Edward Block Square (A), Bushwick Yards (B), Saint Vincent's Building (C), Saint Joseph's Building (D), Bushwick Branch Brooklyn Public Library (E), Saint Josephs Hall (F), Fire Department New York Engine 230 (G), Fire Department New York Engine 237 (H), Grace Theatre (I), Arion Hall (J). Display/hide their locations on the map
Churches in zip code 11206 include: Love Chapel (A), People's Church of Apostolic Faith (B), All Saints Roman Catholic Church (C), Holy Cross Convent (D), Saint Mary of the Immaculate Conception Roman Catholic Church (E), Holy Trinity Roman Catholic Church (F), Little Zion Baptist Church (G), Iglesia Pentecostal Misionera (H), Saint Mark's Lutheran Church (I). Display/hide their locations on the map
Parks in zip code 11206 include: Harmony Triangle (1), Sternberg Park (2), Ramirez Playground (3), Green Central Knoll Playground (4), Garden Playground (5), Sumner Playground (6), Pulaski Playground (7), Marcy Playground (8), Willoughby Playground (9). Display/hide their locations on the map
13,137 married couples with children.
6,913 single-parent households (620 men, 6,293 women).
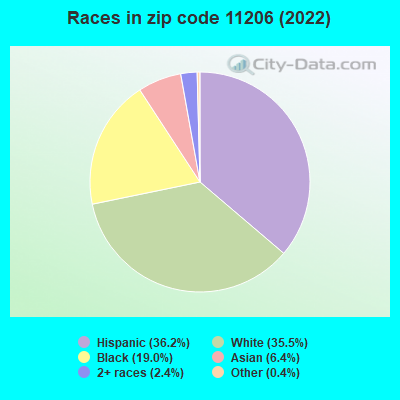
43.6% of residents of 11206 zip code speak English at home.
29.9% of residents speak Spanish at home (60% very well, 16% well, 17% not well, 7% not at all).
20.0% of residents speak other Indo-European language at home (57% very well, 22% well, 13% not well, 8% not at all).
5.4% of residents speak Asian or Pacific Island language at home (46% very well, 12% well, 18% not well, 24% not at all).
0.9% of residents speak other language at home (84% very well, 4% well, 11% not well).
Foreign born population: 18,045 (20.4%) (56.4% of them are naturalized citizens)
This zip code:
20.4%
Whole state:
22.7%
22%Dominica
9%Honduras
4%Grenada
4%Colombia
4%Chile
3%North Macedonia (Macedonia)
3%Belgium
7%Hungarian
4%American
3%European
2%Polish
1%Haitian
1%Italian
1%Eastern European
Year of entry for the foreign-born population
6,2052010 or later
3,8692000 to 2009
4,2281990 to 1999
8,797Before 1990
Major facilities with environmental interests located in this zip code:
ARLINGTON PRESS-191 HARRISON AVE (191 HARRISON AVE in BROOKLYN, NY)
STATE MASTER (New York facility tracking) - AIR PROGRAM, Small Quantity Generators, between 100 kg and 1000 kg of hazardous waste/month (Resource Conservation and Recovery Act (tracking hazardous waste)) - notification - ICIS-, ENFORCEMENT/COMPLIANCE ACTIVITY Business SIC classification: COMMERCIAL PRINTING, LITHOGRAPHIC Organizations: ARLINGTON PRESS INC (CONTACT/OWNER)
HARRISON DRY CLEANERS (209 HARRISON AVENUE in BROOKLYN, NY)
AIR MINOR (AIRS/AFS) STATE MASTER (New York facility tracking) - AIR PROGRAM (Resource Conservation and Recovery Act (tracking hazardous waste)) Business SIC classification: DRYCLEANING PLANTS, EXCEPT RUG CLEANING Organizations: YORK TOWN DRY CLEANERS Alternative names: ACE RAPID CLEANERS, YORK TOWN DRY CLEANERS
ARTISTIC WOOD CARVINGS INC (630 BROADWAY in BROOKLYN, NY)
AIR MINOR (AIRS/AFS) STATE MASTER (New York facility tracking) - AIR PROGRAM, Business SIC classification: WOOD PRODUCTS Organizations: KATZ PICTURE FRAMES INC (LEGALLY RESPONSIBLE PARTY)
COOPER TANK-203-205 MOORE ST (203-205 MOORE STREET in BROOKLYN, NY)
AIR MINOR (AIRS/AFS) AIR SYNTHETIC MINOR (AIRS/AFS) STATE MASTER (New York facility tracking) - AIR PROGRAM, Business SIC classification: FABRICATED PLATE WORK (BOILER SHOPS); COATING, ENGRAVING, AND ALLIED SERVICES Organizations: COOPER TANK & WELDING CORP (LEGALLY RESPONSIBLE PARTY)
Alternative names: COOPER TANK AND WELDING CORP, COOPER TANK & WELDING CORPORATION
IS 318 (101 WALTON ST in BROOKLYN, NY)
STATE MASTER (New York facility tracking) - AIR PROGRAM (Resource Conservation and Recovery Act (tracking hazardous waste)) Business SIC and NAICS classification: ELEMENTARY AND SECONDARY SCHOOLS Organizations: NYC DEPT OF EDUCATION (LEGALLY RESPONSIBLE PARTY)
Alternative names: INTERMEDIATE SCHOOL 318
IS 33 (70 TOMPKINS AVE in BROOKLYN, NY)
STATE MASTER (New York facility tracking) - AIR PROGRAM (Resource Conservation and Recovery Act (tracking hazardous waste)) Business SIC and NAICS classification: ELEMENTARY AND SECONDARY SCHOOLS Organizations: NYC DEPT OF EDUCATION (LEGALLY RESPONSIBLE PARTY)
Alternative names: NYC BD OF ED - INTERMEDIATE SCHOOL 33
IS 49 (223 GRAHAM AVE in BROOKLYN, NY)
STATE MASTER (New York facility tracking) - AIR PROGRAM (Resource Conservation and Recovery Act (tracking hazardous waste)) Business SIC and NAICS classification: ELEMENTARY AND SECONDARY SCHOOLS Organizations: NYC DEPT OF EDUCATION (LEGALLY RESPONSIBLE PARTY)
Alternative names: NYC BD OF ED - INTERMEDIATE SCHOOL 49
IS 33 MARK HOPKINS IS ( in BROOKLYN, NY)
(National Center for Education Statistics) - STATE ID-331400010033 Organizations: NEW YORK CITY PUBLIC SCHOOLS (SCHOOL DISTRICT)
IS 49 W.J. GAYNOR IS ( in BROOKLYN, NY)
(National Center for Education Statistics) - STATE ID-331400010049 Organizations: NEW YORK CITY PUBLIC SCHOOLS (SCHOOL DISTRICT)
IS 71 JUAN MOREL CAMPOS IS ( in BROOKLYN, NY)
(National Center for Education Statistics) - STATE ID-331400010071 Organizations: NEW YORK CITY PUBLIC SCHOOLS (SCHOOL DISTRICT)
IS 318 E.M. DEHOSTOS IS ( in BROOKLYN, NY)
(National Center for Education Statistics) - STATE ID-331400010318 Organizations: NEW YORK CITY PUBLIC SCHOOLS (SCHOOL DISTRICT)
CON EDISON - MH 8303 (S/S NOBLE ST. 65` W/O WEST ST. in BROOKLYN, NY)
Large Quantity Generators, more that 1000 kg of hazardous waste/month (Resource Conservation and Recovery Act (tracking hazardous waste)) Organizations: CONSOLIDATED EDISON COMPANY OF NY, INC. (CONTACT/OPERATOR)
CON EDISON - TM 1358 (THROOP AVE & LORIMER ST in BROOKLYN, NY)
Large Quantity Generators, more that 1000 kg of hazardous waste/month (Resource Conservation and Recovery Act (tracking hazardous waste)) Organizations: CONSOLIDATED EDISON COMPANY OF NY, INC. (CONTACT/OPERATOR)
Housing units lacking complete plumbing facilities: 0.4% Housing units lacking complete kitchen facilities: 0.7%
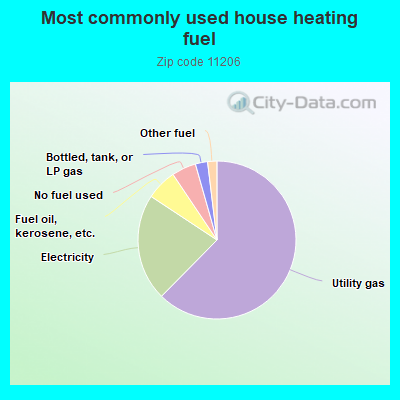
62.4%Utility gas
21.9%Electricity
6.3%Fuel oil, kerosene, etc.
5.0%No fuel used
2.5%Bottled, tank, or LP gas
1.9%Other fuel
Population in 1990: 74,825.
Place of birth for U.S.-born residents:
This state: 52,382
Northeast: 3,340
Midwest: 2,253
South: 4,576
West: 2,907
67% of the 11206 zip code residents lived in the same house 5 years ago. Out of people who lived in different houses, 74% lived in this county. Out of people who lived in different counties, 50% lived in New York.
89% of the 11206 zip code residents lived in the same house 1 year ago. Out of people who lived in different houses, 58% moved from this county. Out of people who lived in different houses, 17% moved from different county within same state. Out of people who lived in different houses, 20% moved from different state. Out of people who lived in different houses, 6% moved from abroad.
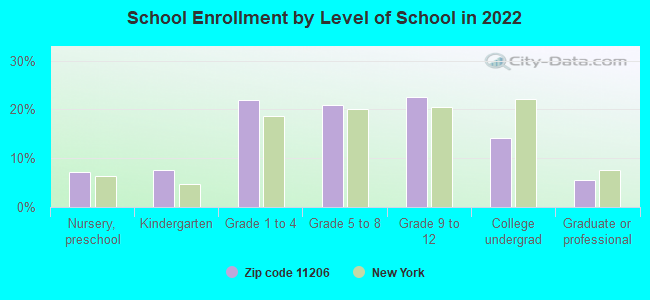
Private vs. public school enrollment:
Students in private schools in grades 1 to 8 (elementary and middle school): 4,894
Here:
45.8%
New York:
15.6%
Students in private schools in grades 9 to 12 (high school): 1,873
Here:
33.6%
New York:
15.0%
Students in private undergraduate colleges: 1,469
Here:
41.8%
New York:
39.2%
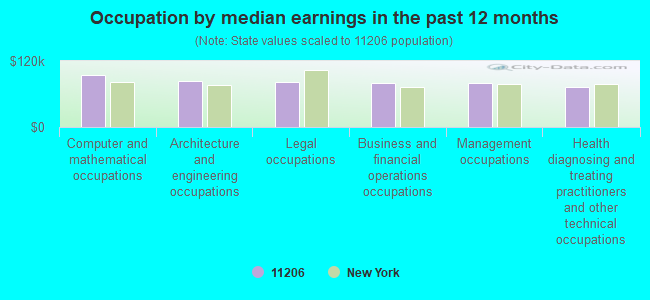
Occupation by median earnings in the past 12 months ($)
95,045Computer and mathematical occupations
83,535Architecture and engineering occupations
81,743Legal occupations
80,628Business and financial operations occupations
79,688Management occupations
73,471Health diagnosing and treating practitioners and other technical occupations
Companies with federal contracts located in this zip code (BROOKLYN, NY):
COMPONENTS INTERNATIONAL INC (157 HARRISON AVE; small business) : $221,717 in 17 contractsfrom 2004 to 2006
Contracts for Connectors, Electrical, Resistors, Microcircuits, Electronic, Miscellaneous Electrical and Electronic Components, and moreby Army, Navy, Defense Logistics Agency Signed by year:2000: $0; 2001: $0; 2002: $0; 2003: $0; 2004: $63,074; 2005: $107,489; 2006: $51,154.
Biggest contracts:
$80,685 with Army for Connectors, Electrical. Taking place in PA. Signed on 2006-03-09. Completion date: 2006-03-31.
$32,080 with Navy for Resistors. Signed on 2005-12-28. Completion date: 2006-03-22.
$30,750 with Army for Microcircuits, Electronic. Taking place in PA. Signed on 2004-11-15. Completion date: 2005-01-26.
$30,066 with Army for Connectors, Electrical. Signed on 2006-07-11. Completion date: 2006-09-11.
MOBILESTEAM BOILER RENTAL CORP (182 MONTROSE AVE; small business) : $173,300 in 3 contractsfrom 2001 to 2003
$63,850 with Army for Industrial Boilers. Signed on 2003-05-14. Completion date: 2003-06-06.
$61,950, same as above.Signed on 2002-05-23. Completion date: 2002-06-02.
$47,500 with Army for Lease or Rental of Equipment -- Special Industry Machinery. Signed on 2001-05-03. Completion date: 2001-06-18.
ROYAL TECHNOLOGY CORPORATION (199 VARET STREET; small business) : $108,969 in 2 contractsin 2000
$75,286 with Defense Logistics Agency for Valves, Nonpowered. Signed on 2000-10-20. Completion date: 2001-06-18.
$33,683, same as above.Signed on 2000-12-20. Completion date: 2001-07-08.
BURNEY PRODUCTS CORPORATION (314 SCHOLES STREET; small business)
$67,780 with Defense Logistics Agency for Memorials: Cemeterial and Mortuary Equipment and Supplies. Taking place in PA. Signed on 2000-07-13. Completion date: 2000-07-18.
2007 - 2018 National Fire Incident Reporting System (NFIRS) incidents
Based on the data from the years 2007 - 2018 the average number of fires per year is 454. The highest number of fires - 546 took place in 2010, and the least - 410 in 2018. The data has a dropping trend.
When looking into fire subcategories, the most incidents belonged to: Structure Fires (70.6%), and Outside Fires (20.8%).
Fire incident types reported to NFIRS in Zip Code 11206

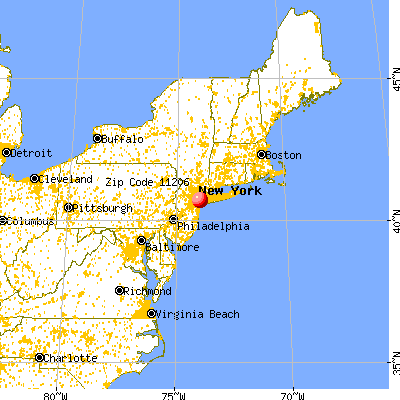


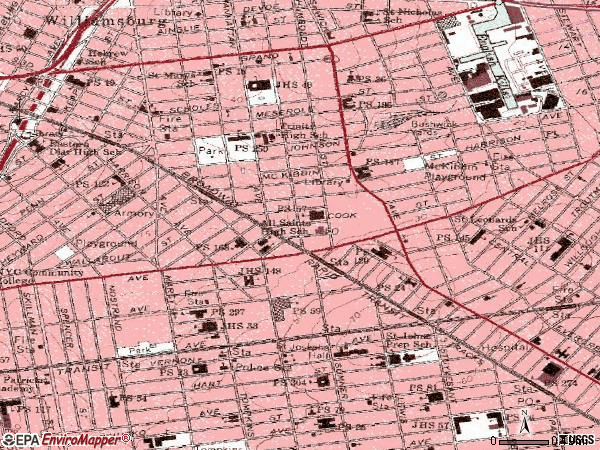
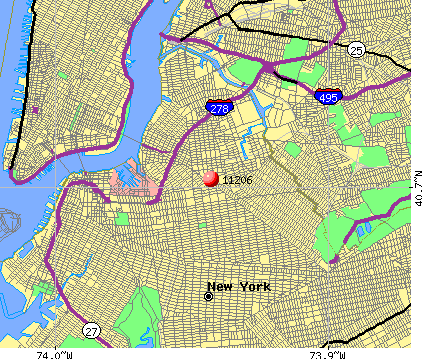 Nearest zip codes: 11211, 11221, 11237, 11216, 11205, 11222.
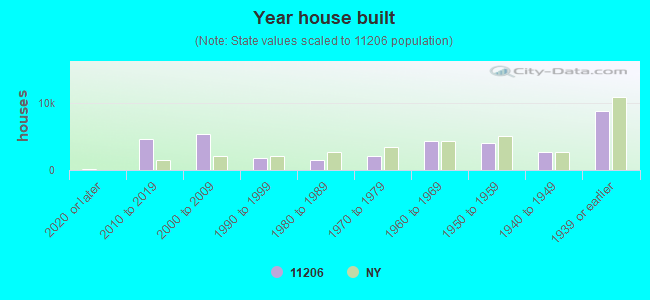


 Based on the data from the years 2007 - 2018 the average number of fires per year is 454. The highest number of fires - 546 took place in 2010, and the least - 410 in 2018. The data has a dropping trend.
 When looking into fire subcategories, the most incidents belonged to: Structure Fires (70.6%), and Outside Fires (20.8%).