Estimated zip code population in 2022: 46,434 Zip code population in 2010: 49,896 Zip code population in 2000: 48,910
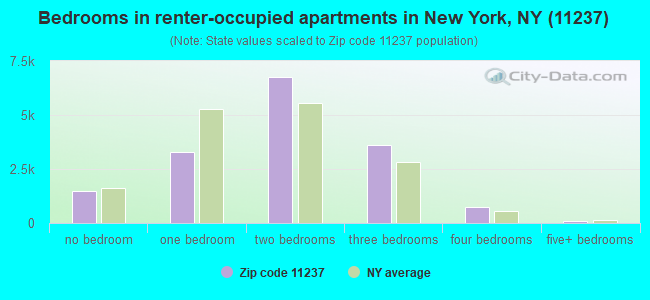
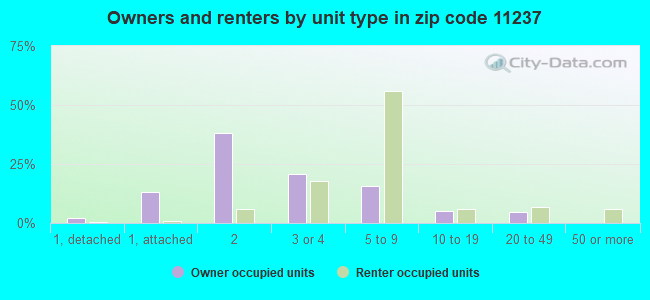
Houses and condos: 18,926 Renter-occupied apartments: 16,025
% of renters here:
89%
State:
46%
March 2022 cost of living index in zip code 11237: 157.6 (very high, U.S. average is 100)
Land area: 1.0 sq. mi. Water area: 0.0 sq. mi.
Population density: 47,393 people per square mile
(very high).
OSM Map
General Map
Google Map
MSN Map
OSM Map
General Map
Google Map
MSN Map
OSM Map
General Map
Google Map
MSN Map
OSM Map
General Map
Google Map
MSN Map
Please wait while loading the map...
Real estate property taxes paid for housing units in 2022:
This zip code:
0.4% ($4,444)
New York:
1.5% ($6,180)
Median real estate property taxes paid for housing units with mortgages in 2022: $4,137 (0.4%) Median real estate property taxes paid for housing units with no mortgage in 2022: $4,921 (0.5%)
Estimated median house/condo value in 2022: $990,002
11237:
$990,002
New York:
$400,400
According to our research of New York and other state lists, there were 22 registered sex offenders living in 11237 zip code as of April 26, 2024. The ratio of all residents to sex offenders in zip code 11237 is 2,475 to 1. The ratio of registered sex offenders to all residents in this zip code is much lower than the state average.
Median resident age:
This zip code:
33.2 years
New York median age:
40.0 years
Average household size:
This zip code:
2.5 people
New York:
2.5 people
Averages for the 2020 tax year for zip code 11237, filed in 2021:
Average Adjusted Gross Income (AGI) in 2020: $43,347 (Individual Income Tax Returns)
Here:
$43,347
State:
$90,930
Salary/wage: $43,123 (reported on 80.8% of returns)
Here:
$43,123
State:
$72,104
(% of AGI for various income ranges: 1033.7% for AGIs below $25k, 3583.7% for AGIs $25k-50k, 6973.4% for AGIs $50k-75k, 10852.1% for AGIs $75k-100k, 19317.7% for AGIs $100k-200k, 102233.8% for AGIs over 200k)
Taxable interest for individuals: $473 (reported on 13.5% of returns)
This zip code:
$473
New York:
$3,075
(% of AGI for various income ranges: 3.3% for AGIs below $25k, 4.2% for AGIs $25k-50k, 6.5% for AGIs $50k-75k, 16.6% for AGIs $75k-100k, 42.2% for AGIs $100k-200k, 451.2% for AGIs over 200k)
Ordinary dividends: $1,802 (reported on 9.6% of returns)
Here:
$1,802
State:
$11,095
(% of AGI for various income ranges: 6.4% for AGIs below $25k, 10.3% for AGIs $25k-50k, 22.7% for AGIs $50k-75k, 35.3% for AGIs $75k-100k, 85.3% for AGIs $100k-200k, 1743.8% for AGIs over 200k)
Net capital gain/loss in AGI: +$6,388 (reported on 9.8% of returns)
Here:
+$6,388
State:
+$44,925
(% of AGI for various income ranges: 5.3% for AGIs below $25k, 19.5% for AGIs $25k-50k, 40.5% for AGIs $50k-75k, 94.9% for AGIs $75k-100k, 348.0% for AGIs $100k-200k, 10592.5% for AGIs over 200k)
Profit/loss from business: +$9,590 (reported on 24.4% of returns)
Here:
+$9,590
State:
+$14,940
(% of AGI for various income ranges: 363.3% for AGIs below $25k, 220.7% for AGIs $25k-50k, 225.6% for AGIs $50k-75k, 394.5% for AGIs $75k-100k, 639.5% for AGIs $100k-200k, 6508.8% for AGIs over 200k)
Taxable individual retirement arrangement distribution: $10,121 (reported on 1.0% of returns)
11237:
$10,121
New York:
$19,609
(% of AGI for various income ranges: 5.4% for AGIs below $25k, 8.6% for AGIs $25k-50k, 10.6% for AGIs $50k-75k, 34.4% for AGIs $75k-100k, 103.6% for AGIs $100k-200k)
Self-employed (Keogh) retirement plans: $11,200 (reported on 0.3% of returns)
11237:
$11,200
New York:
$32,497
(% of AGI for various income ranges: 15.0% for AGIs $50k-75k, 53.9% for AGIs $100k-200k)
Total itemized deductions: $25,033 (reported on 2.4% of returns)
Here:
$25,033
State:
$39,326
(% of AGI for various income ranges: 10.3% for AGIs below $25k, 29.1% for AGIs $25k-50k, 65.4% for AGIs $50k-75k, 192.7% for AGIs $75k-100k, 488.5% for AGIs $100k-200k, 4855.0% for AGIs over 200k)
Charity contributions: $7,224 (reported on 1.7% of returns)
Here:
$7,224
State:
$15,420
(% of AGI for various income ranges: 6.4% for AGIs $25k-50k, 12.8% for AGIs $50k-75k, 38.8% for AGIs $75k-100k, 74.3% for AGIs $100k-200k, 1417.5% for AGIs over 200k)
Taxes paid: $7,978 (reported on 2.4% of returns)
11237:
$7,978
State:
$9,183
(% of AGI for various income ranges: 1.6% for AGIs below $25k, 7.4% for AGIs $25k-50k, 20.1% for AGIs $50k-75k, 69.2% for AGIs $75k-100k, 196.0% for AGIs $100k-200k, 1291.2% for AGIs over 200k)
Earned income credit: $1,922 (reported on 17.9% of returns)
Here:
$1,922
State:
$2,138
(% of AGI for various income ranges: 88.4% for AGIs below $25k, 49.7% for AGIs $25k-50k, 0.4% for AGIs $50k-75k)
Percentage of individuals using paid preparers for their 2020 taxes: 93.3%
Here:
93%
State:
95%
(% for various income ranges: 89.1% for AGIs below $25k, 95.5% for AGIs $25k-50k, 96.5% for AGIs $50k-75k, 96.3% for AGIs $75k-100k, 96.5% for AGIs $100k-200k, 100.0% for AGIs over 200k)
Averages for the 2012 tax year for zip code 11237, filed in 2013:
Average Adjusted Gross Income (AGI) in 2012: $28,083 (Individual Income Tax Returns)
Here:
$28,083
State:
$77,088
Salary/wage: $29,945 (reported on 81.4% of returns)
Here:
$29,945
State:
$60,593
(% of AGI for various income ranges: 74.0% for AGIs below $25k, 93.9% for AGIs $25k-50k, 93.8% for AGIs $50k-75k, 90.8% for AGIs $75k-100k, 87.1% for AGIs $100k-200k, 54.5% for AGIs over 200k)
Taxable interest for individuals: $290 (reported on 12.0% of returns)
This zip code:
$290
New York:
$3,125
(% of AGI for various income ranges: 0.1% for AGIs below $25k, 0.1% for AGIs $25k-50k, 0.1% for AGIs $50k-75k, 0.2% for AGIs $75k-100k, 0.2% for AGIs $100k-200k)
Ordinary dividends: $1,394 (reported on 4.5% of returns)
Here:
$1,394
State:
$10,299
(% of AGI for various income ranges: 0.2% for AGIs below $25k, 0.2% for AGIs $25k-50k, 0.2% for AGIs $50k-75k, 0.4% for AGIs $75k-100k, 0.4% for AGIs $100k-200k)
Net capital gain/loss in AGI: +$2,805 (reported on 3.6% of returns)
Here:
+$2,805
State:
+$42,474
(% of AGI for various income ranges: 0.2% for AGIs $50k-75k, 0.2% for AGIs $75k-100k, 2.9% for AGIs $100k-200k)
Profit/loss from business: +$8,204 (reported on 25.8% of returns)
Here:
+$8,204
State:
+$16,168
(% of AGI for various income ranges: 20.8% for AGIs below $25k, 3.2% for AGIs $25k-50k, 1.6% for AGIs $50k-75k, 3.5% for AGIs $75k-100k, 4.8% for AGIs $100k-200k)
Taxable individual retirement arrangement distribution: $10,385 (reported on 0.9% of returns)
11237:
$10,385
New York:
$17,621
(% of AGI for various income ranges: 0.2% for AGIs below $25k, 0.2% for AGIs $25k-50k, 0.5% for AGIs $50k-75k, 1.1% for AGIs $100k-200k)
Self-employment retirement plans: $17,900 (reported on 0.1% of returns)
11237:
$17,900
New York:
$27,330
Total itemized deductions: $16,302 (25% of AGI, reported on 14.2% of returns)
Here:
$16,302
State:
$34,985
Here:
25.3% of AGI
State:
21.3% of AGI
(% of AGI for various income ranges: 2.7% for AGIs below $25k, 6.8% for AGIs $25k-50k, 10.7% for AGIs $50k-75k, 14.2% for AGIs $75k-100k, 16.6% for AGIs $100k-200k, 13.2% for AGIs over 200k)
Charity contributions: $2,364 (reported on 10.1% of returns)
Here:
$2,364
State:
$5,572
(% of AGI for various income ranges: 0.2% for AGIs below $25k, 0.8% for AGIs $25k-50k, 1.2% for AGIs $50k-75k, 1.4% for AGIs $75k-100k, 1.5% for AGIs $100k-200k, 1.1% for AGIs over 200k)
Taxes paid: $6,051 (reported on 14.0% of returns)
11237:
$6,051
State:
$18,656
(% of AGI for various income ranges: 0.4% for AGIs below $25k, 1.6% for AGIs $25k-50k, 4.0% for AGIs $50k-75k, 6.6% for AGIs $75k-100k, 8.5% for AGIs $100k-200k, 8.7% for AGIs over 200k)
Earned income credit: $2,241 (reported on 30.1% of returns)
Here:
$2,241
State:
$2,230
(% of AGI for various income ranges: 8.0% for AGIs below $25k, 1.0% for AGIs $25k-50k)
Percentage of individuals using paid preparers for their 2012 taxes: 61.1%
Here:
61%
State:
66%
(% for various income ranges: 61.3% for AGIs below $25k, 59.4% for AGIs $25k-50k, 61.5% for AGIs $50k-75k, 64.2% for AGIs $75k-100k, 71.1% for AGIs $100k-200k, 80.0% for AGIs over 200k)
Averages for the 2004 tax year for zip code 11237, filed in 2005:
Average Adjusted Gross Income (AGI) in 2004: $22,002 (Individual Income Tax Returns)
Here:
$22,002
State:
$59,519
Salary/wage: $23,745 (reported on 83.7% of returns)
Here:
$23,745
State:
$50,673
(% of AGI for various income ranges: 66.6% for AGIs below $10k, 86.3% for AGIs $10k-25k, 96.7% for AGIs $25k-50k, 96.1% for AGIs $50k-75k, 90.8% for AGIs $75k-100k, 78.3% for AGIs over 100k)
Taxable interest for individuals: $437 (reported on 18.5% of returns)
This zip code:
$437
New York:
$2,377
(% of AGI for various income ranges: 0.8% for AGIs below $10k, 0.3% for AGIs $10k-25k, 0.3% for AGIs $25k-50k, 0.3% for AGIs $50k-75k, 0.5% for AGIs $75k-100k, 0.5% for AGIs over 100k)
Taxable dividends: $994 (reported on 3.2% of returns)
Here:
$994
State:
$5,394
(% of AGI for various income ranges: 0.3% for AGIs below $10k, 0.1% for AGIs $10k-25k, 0.1% for AGIs $25k-50k, 0.2% for AGIs $50k-75k, 0.2% for AGIs $75k-100k, 0.4% for AGIs over 100k)
Net capital gain/loss: +$5,820 (reported on 2.4% of returns)
Here:
+$5,820
State:
+$23,581
(% of AGI for various income ranges: -0.2% for AGIs below $10k, -0.0% for AGIs $10k-25k, 0.0% for AGIs $25k-50k, 0.5% for AGIs $50k-75k, 1.3% for AGIs $75k-100k, 11.0% for AGIs over 100k)
Profit/loss from business: +$6,525 (reported on 20.9% of returns)
Here:
+$6,525
State:
+$13,809
(% of AGI for various income ranges: 35.5% for AGIs below $10k, 10.5% for AGIs $10k-25k, 1.3% for AGIs $25k-50k, 0.6% for AGIs $50k-75k, 1.6% for AGIs $75k-100k)
IRA payment deduction: $2,155 (reported on 1.2% of returns)
11237:
$2,155
New York:
$3,115
(% of AGI for various income ranges: 0.1% for AGIs below $10k, 0.1% for AGIs $10k-25k, 0.1% for AGIs $25k-50k, 0.2% for AGIs $50k-75k, 0.2% for AGIs over 100k)
Total itemized deductions: $14,720 (34% of AGI, reported on 17.5% of returns)
Here:
$14,720
State:
$25,864
Here:
33.9% of AGI
State:
21.9% of AGI
(% of AGI for various income ranges: 2.9% for AGIs below $10k, 6.1% for AGIs $10k-25k, 13.9% for AGIs $25k-50k, 17.9% for AGIs $50k-75k, 17.5% for AGIs $75k-100k, 15.8% for AGIs over 100k)
Charity contributions deductions: $2,505 (6% of AGI, reported on 15.6% of returns)
Here:
$2,505
State:
$4,439
Here:
5.6% of AGI
State:
3.6% of AGI
(% of AGI for various income ranges: 0.2% for AGIs below $10k, 0.8% for AGIs $10k-25k, 2.1% for AGIs $25k-50k, 2.8% for AGIs $50k-75k, 3.0% for AGIs $75k-100k, 2.4% for AGIs over 100k)
Total tax: $2,189 (reported on 58.5% of returns)
11237:
$2,189
State:
$11,730
(% of AGI for various income ranges: 5.6% for AGIs below $10k, 3.3% for AGIs $10k-25k, 4.9% for AGIs $25k-50k, 8.5% for AGIs $50k-75k, 10.4% for AGIs $75k-100k, 16.1% for AGIs over 100k)
Earned income credit: $2,032 (reported on 42.3% of returns)
Here:
$2,032
State:
$1,757
Percentage of individuals using paid preparers for their 2004 taxes: 67.7%
Here:
68%
State:
67%
(% for various income ranges: 64.5% for AGIs below $10k, 69.6% for AGIs $10k-25k, 67.9% for AGIs $25k-50k, 68.8% for AGIs $50k-75k, 72.4% for AGIs $75k-100k, 75.2% for AGIs over 100k)
Likely homosexual households (counted as self-reported same-sex unmarried-partner households)
Lesbian couples: 0.1% of all households
Gay men: 0.6% of all households
Household received Food Stamps/SNAP in the past 12 months: 3,874 Household did not receive Food Stamps/SNAP in the past 12 months: 14,141
Women who had a birth in the past 12 months: 497 (213 now married, 291 unmarried) Women who did not have a birth in the past 12 months: 13,919 (3,424 now married, 10,574 unmarried)
Housing units in zip code 11237 with a mortgage: 890 (123 second mortgage, 106 both second mortgage and home equity loan) Houses without a mortgage: 26
Median monthly owner costs for units with a mortgage: $3,486 Median monthly owner costs for units without a mortgage: $978
Residents with income below the poverty level in 2022:
This zip code:
23.7%
Whole state:
14.3%
Residents with income below 50% of the poverty level in 2022:
This zip code:
10.7%
Whole state:
6.8%
Median number of rooms in houses and condos:
Here:
4.5
State:
6.3
Median number of rooms in apartments:
Here:
3.9
State:
3.8
Notable locations in this zip code not listed on our city pages
Notable locations in zip code 11237: Fire Department New York Engine 271 Ladder 124 Battalion 28 (A), New York Ladder Company 124 (B), Eightythird Precinct Police Station (C). Display/hide their locations on the map
Churches in zip code 11237 include: Iglesia Bautista Central (A), Iglesia Pentecostal (B), Saint Brigid's Roman Catholic Church (C), Knickerbocker United Church (D). Display/hide their locations on the map
2,530 married couples with children.
3,308 single-parent households (739 men, 2,569 women).
43.3% of residents of 11237 zip code speak English at home.
45.9% of residents speak Spanish at home (52% very well, 22% well, 18% not well, 8% not at all).
4.0% of residents speak other Indo-European language at home (66% very well, 20% well, 10% not well, 4% not at all).
4.8% of residents speak Asian or Pacific Island language at home (46% very well, 21% well, 28% not well, 5% not at all).
1.5% of residents speak other language at home (48% very well, 31% well, 9% not well, 12% not at all).
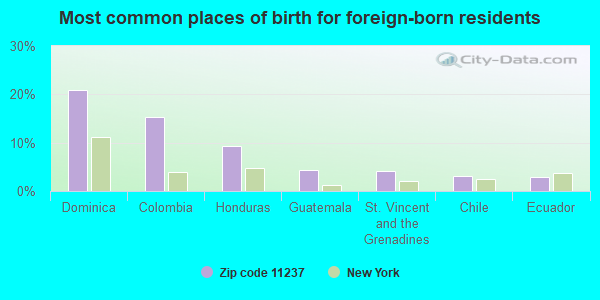
Foreign born population: 15,433 (33.2%) (46.0% of them are naturalized citizens)
This zip code:
33.2%
Whole state:
22.7%
21%Dominica
15%Colombia
9%Honduras
4%Guatemala
4%St. Vincent and the Grenadines
3%Chile
3%Ecuador
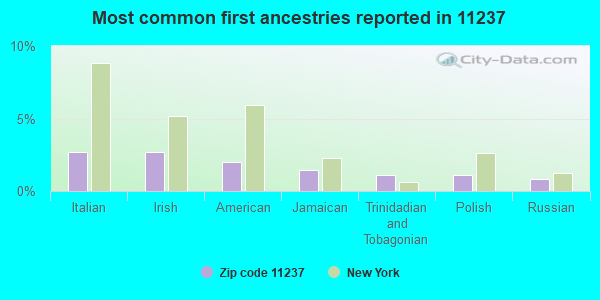
3%Italian
3%Irish
2%American
1%Jamaican
1%Trinidadian and Tobagonian
1%Polish
1%Russian
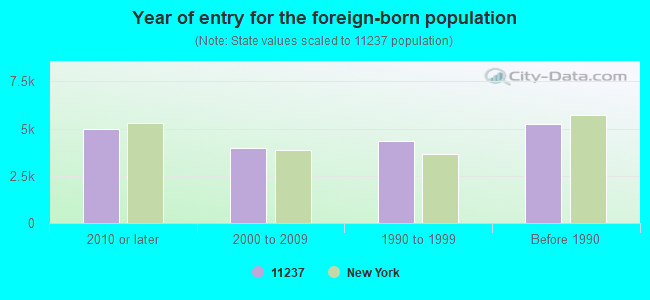
Year of entry for the foreign-born population
4,9592010 or later
3,9942000 to 2009
4,3671990 to 1999
5,227Before 1990
Major facilities with environmental interests located in this zip code:
CONSOLIDATED PACKAGING GROUP INC-1250 METROPOLITA (1250 METROPOLITAN AVENUE in BROOKLYN, NY)
AIR MAJOR (AIRS/AFS) AIR SYNTHETIC MINOR (AIRS/AFS) STATE MASTER (New York facility tracking) - AIR PROGRAM, AIR MAJOR, HAZARDOUS WASTE PROGRAM, (Integrated Compliance Information System) - ICIS-02-1996-0143, FORMAL ENFORCEMENT ACTION CRITERIA AND HAZARDOUS AIR POLLUTANT INVENTORY (Inventory of air pollution sources) HAZARDOUS WASTE BIENNIAL REPORTER (Resource Conservation and Recovery Act (tracking hazardous waste)) - ICIS-, ENFORCEMENT/COMPLIANCE ACTIVITY Large Quantity Generators, more that 1000 kg of hazardous waste/month (Resource Conservation and Recovery Act (tracking hazardous waste)) - ICIS-, ENFORCEMENT/COMPLIANCE ACTIVITY Business SIC classification: COMMERCIAL PRINTING Business NAICS classification: COMMERCIAL FLEXOGRAPHIC PRINTING.; ALL OTHER PLASTICS PRODUCT MANUFACTURING. Organizations: RELIABLE POLY PACKAGING CO INC (AIR PERMIT CONTACT)
, CONSOLIDATED PACKAGING GROUP LLC (CONTACT/OPERATOR)
, RELIABLE POLY PACKAGING CO - ALEX GROSS (CONTACT/OWNER)
, RELIABLE POLY PACKAGING CO INC (LEGALLY RESPONSIBLE PARTY)
Alternative names: RELIABLE POLY PACKAGING CO INC, RELIABLE POLY PACKAGING 1250 METROPOLITA
BFI SCOTT AVE RECYCLING & TRANS STA (575 SCHOLES STREET in BROOKLYN, NY)
AIR MINOR (AIRS/AFS) STATE MASTER (New York facility tracking) - SOLID WASTE PROGRAM, REFUSE DISPOSAL, SOLID WASTE PROGRAM, National Pollutant Discharge Elimination System Permit, Business SIC classification: LOCAL TRUCKING WITHOUT STORAGE Organizations: GANNETT FLEMING ENGINEERS & ARCHITECTS (FACILITY APPLICATION CONTACT)
, JAMES VAN WOERT (FACILITY PERMIT CONTACT)
, B F I WASTE SYSTEMS OF NORTH AMERICA INC (LEGALLY RESPONSIBLE PARTY)
, JOSEPH LOSTRITTO COMPANY (LEGALLY RESPONSIBLE PARTY)
, BFI WASTE SYSTEMS OF NEW JERSEY INC (LEGALLY RESPONSIBLE PARTY)
GRAND CHROMIUM PLATING (209 MORGAN AVENUE in BROOKLYN, NY)
AIR MINOR (AIRS/AFS) (Integrated Compliance Information System) - ICIS-02-1985-0016, FORMAL ENFORCEMENT ACTION (Resource Conservation and Recovery Act (tracking hazardous waste)) TRI REPORTER (Tracking of toxic chemicals releasing facilities) Business SIC classification: SPECIALTY CLEANING, POLISHING, AND SANITATION PREPARATIONS; ELECTROPLATING, PLATING, POLISHING, ANODIZING, AND COLORING Business NAICS classification: ELECTROPLATING, PLATING, POLISHING, ANODIZING, AND COLORING.
HAPPY CLEANERS (123 WYCKOFF AVE in BROOKLYN, NY)
AIR MINOR (AIRS/AFS) STATE MASTER (New York facility tracking) - AIR PROGRAM Conditionally Exempt Small Quantity Generators, less than 100 kg/month of hazardous waste (Resource Conservation and Recovery Act (tracking hazardous waste)) - notification Business SIC classification: DRYCLEANING PLANTS, EXCEPT RUG CLEANING Business NAICS classification: DRYCLEANING AND LAUNDRY SERVICES (EXCEPT COIN-OPERATED). Organizations: BYONGKIL CHO (CONTACT/OWNER)
, HAPPY DRY CLEANERS CORP (LEGALLY RESPONSIBLE PARTY)
ALFRED CHEMICAL CORPORATION (111 GARDNER AVENUE in BROOKLYN, NY)
(Integrated Compliance Information System) - ICIS-02-1989-0282, FORMAL ENFORCEMENT ACTION COMPLIANCE ACTIVITY (Tracking inspections of insecticide, fungicide, and rodenticide, and toxic substances) Conditionally Exempt Small Quantity Generators, less than 100 kg/month of hazardous waste (Resource Conservation and Recovery Act (tracking hazardous waste)) TRI REPORTER (Tracking of toxic chemicals releasing facilities) Business SIC classification: SOAP AND OTHER DETERGENTS, EXCEPT SPECIALTY CLEANERS; SPECIALTY CLEANING, POLISHING, AND SANITATION PREPARATIONS
ALLSTATE POWER VAC INC (180 VARICK ST in BROOKLYN, NY)
ENFORCEMENT/COMPLIANCE ACTIVITY (Integrated Compliance Information System) STATE MASTER (New Jersey environmental info) - NJEMS-213603, REFUSE DISPOSAL, NJEMS-NJD003812047A, TRANSPORTER Conditionally Exempt Small Quantity Generators, less than 100 kg/month of hazardous waste (Resource Conservation and Recovery Act (tracking hazardous waste)) Business SIC classification: TERMINAL AND JOINT TERMINAL MAINTENANCE FACILITIES FOR MOTOR FREIGHT TRANSPORTATION Alternative names: ALL STATE POWER, ALL STATE POWER VAC
APOLLO WINDOWS & DOORS INC (333 STARR STREET in BROOKLYN, NY)
AIR SYNTHETIC MINOR (AIRS/AFS) STATE MASTER (New York facility tracking) - AIR PROGRAM, Business SIC classification: EQUIPMENT RENTAL AND LEASING Organizations: SERVICE PARTY RENTAL INC (LEGALLY RESPONSIBLE PARTY)
Alternative names: SERVICE PARTY RENTAL INC
GREEN OFFICE SYSTEMS (154 MORGAN AVE in BROOKLYN, NY)
AIR SYNTHETIC MINOR (AIRS/AFS) STATE MASTER (New York facility tracking) - AIR PROGRAM Business SIC classification: OFFICE FURNITURE, EXCEPT WOOD; OFFICE AND STORE FIXTURES, PARTITIONS, SHELVING, AND LOCKERS, EXCEPT WOOD Organizations: ARROW DESIGN INC (LEGALLY RESPONSIBLE PARTY)
, GREEN OFFICE SYSTEMS INC (LEGALLY RESPONSIBLE PARTY)
16 TONS INC (27 KNICKERBOCKER AVE in BROOKLYN, NY)
AIR SYNTHETIC MINOR (AIRS/AFS) STATE MASTER (New York facility tracking) - AIR PROGRAM Business SIC classification: WOOD HOUSEHOLD FURNITURE, EXCEPT UPHOLSTERED
IS 162 WILLOUGHBY IS ( in BROOKLYN, NY)
(National Center for Education Statistics) - STATE ID-333200010162 Organizations: NEW YORK CITY PUBLIC SCHOOLS (SCHOOL DISTRICT)
IS 383 PHILIPPA SCHUYLER SCHOOL ( in BROOKLYN, NY)
(National Center for Education Statistics) - STATE ID-333200010383 Organizations: NEW YORK CITY PUBLIC SCHOOLS (SCHOOL DISTRICT)
CORNISH KNIT GOODS (121 INGRAHAM STREET in BROOKLYN, NY)
CRITERIA AND HAZARDOUS AIR POLLUTANT INVENTORY (Inventory of air pollution sources) Large Quantity Generators, more that 1000 kg of hazardous waste/month (Resource Conservation and Recovery Act (tracking hazardous waste)) Organizations: THE DOE FUND INC/HERB S STRENG (CONTACT/OPERATOR)
, THE DOE FUND INC (CONTACT/OWNER)
Alternative names: CORNISH KNITGOODS MANUFAC, CORNISH KNITGOODS MANUFACTORING CORP
72 SCOTT AVE ( in BROOKLYN, NY)
National Pollutant Discharge Elimination System NON-MAJOR (Tracking pollutant discharge elimination systems) - permit Business SIC classification: LOCAL TRUCKING WITHOUT STORAGE Organizations: BROWNING FERRIS INDUSTRIES/NY (CONTACT/OWNER)
Housing units lacking complete plumbing facilities: 1.4% Housing units lacking complete kitchen facilities: 1.0%
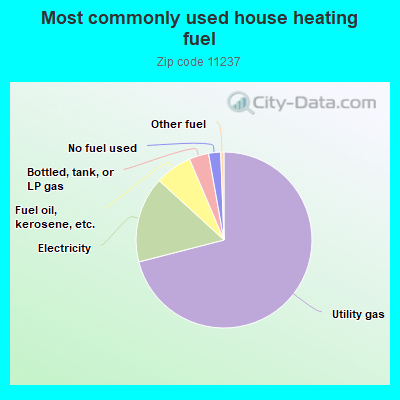
71.0%Utility gas
15.8%Electricity
6.8%Fuel oil, kerosene, etc.
3.6%Bottled, tank, or LP gas
2.2%No fuel used
0.6%Other fuel
Population in 1990: 48,339. Population change in the 1990s: +571 (+1.2%).
Place of birth for U.S.-born residents:
This state: 18,847
Northeast: 2,840
Midwest: 1,497
South: 2,676
West: 2,151
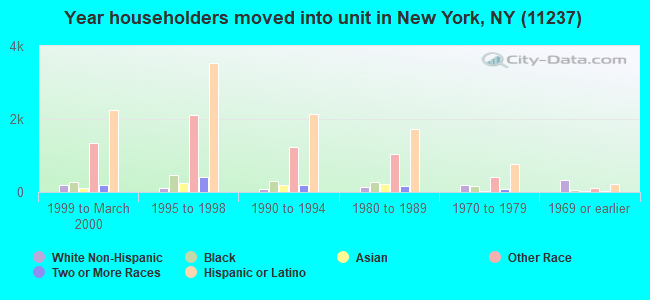
64% of the 11237 zip code residents lived in the same house 5 years ago. Out of people who lived in different houses, 73% lived in this county. Out of people who lived in different counties, 50% lived in New York.
84% of the 11237 zip code residents lived in the same house 1 year ago. Out of people who lived in different houses, 60% moved from this county. Out of people who lived in different houses, 19% moved from different county within same state. Out of people who lived in different houses, 17% moved from different state. Out of people who lived in different houses, 4% moved from abroad.
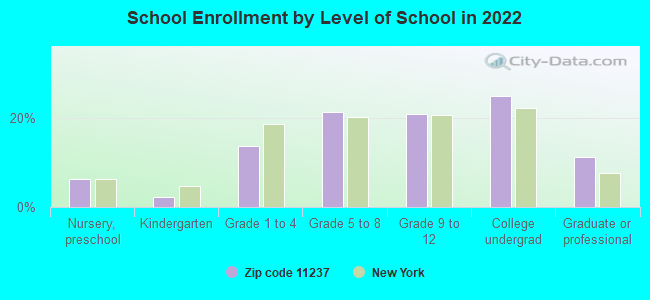
Private vs. public school enrollment:
Students in private schools in grades 1 to 8 (elementary and middle school): 308
Here:
9.4%
New York:
15.6%
Students in private schools in grades 9 to 12 (high school): 118
Here:
6.0%
New York:
15.0%
Students in private undergraduate colleges: 678
Here:
29.1%
New York:
39.2%
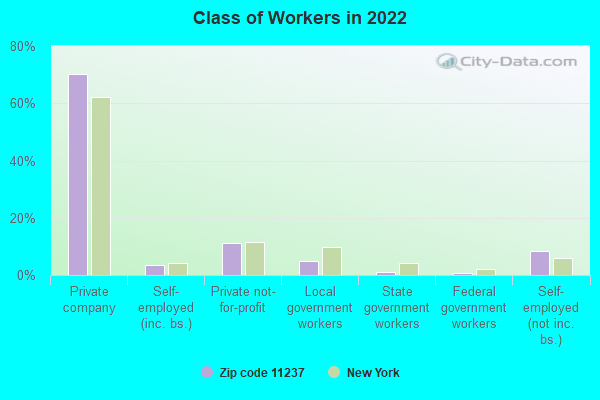
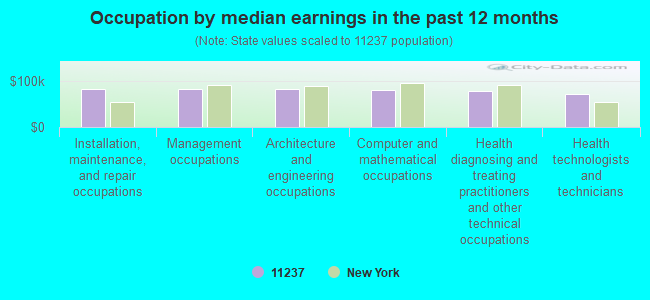
Occupation by median earnings in the past 12 months ($)
83,004Installation, maintenance, and repair occupations
81,732Management occupations
81,118Architecture and engineering occupations
79,593Computer and mathematical occupations
77,774Health diagnosing and treating practitioners and other technical occupations
70,979Health technologists and technicians
Companies with federal contracts located in this zip code:
WASTE MANAGEMENT OF NEW YORK, (123 VARICK AVE in BROOKLYN, NY) : $373,122 in 21 contractsfrom 2002 to 2006
Contracts for Food Items For Resale, Trash/Garbage Collection Services - Including Portable Sanitation Services, Radiology Services by Army, Department of Veterans Affairs, Bureau of Prisoners/Federal Prison System Signed by year:2000: $0; 2001: $0; 2002: $135,302; 2003: $14,686; 2004: $144,143; 2005: $85,847; 2006: -$6,856.
Biggest contracts:
$99,736 with Army for Food Items For Resale. Signed on 2002-09-09. Completion date: 2003-08-31.
$90,953 with Army for Trash/Garbage Collection Services - Including Portable Sanitation Services. Signed on 2004-04-01. Completion date: 2005-03-31.
$41,696, same as above.Signed on 2005-11-23. Completion date: 2005-11-14.
$39,602, same as above.Signed on 2004-11-10. Completion date: 2005-11-14.
BROWNING-FERRIS INDUSTRIES OF (72 SCOTT AVENUE in BROOKLYN, NY)
$54,524 with Army for Trash/Garbage Collection Services - Including Portable Sanitation Services. Signed on 2001-03-15. Completion date: 2002-02-28.
Top industries in this zip code by the number of employees in 2005:
Health Care and Social Assistance: Services for the Elderly and Persons with Disabilities (over 1000 employees: 1 establishment, 10-19 employees: 1 establishment)
Health Care and Social Assistance: General Medical and Surgical Hospitals (over 1000: 1)
Administrative and Support and Waste Management and Remediation Services: Solid Waste Collection (500-999: 1, 50-99: 1, 20-49: 2, 10-19: 1, 1-4: 1)
Health Care and Social Assistance: Child Day Care Services (50-99: 2, 20-49: 3, 5-9: 1, 1-4: 4)
Health Care and Social Assistance: Temporary Shelters (100-249: 1, 50-99: 1, 10-19: 1)
2007 - 2018 National Fire Incident Reporting System (NFIRS) incidents
According to the data from the years 2007 - 2018 the average number of fires per year is 248. The highest number of reported fires - 332 took place in 2008, and the least - 190 in 2013. The data has a decreasing trend.
When looking into fire subcategories, the most reports belonged to: Structure Fires (63.9%), and Outside Fires (23.0%).
Fire incident types reported to NFIRS in Zip Code 11237


 Nearest zip codes: 11221, 11206, 11378, 11233, 11385, 11211.


 According to the data from the years 2007 - 2018 the average number of fires per year is 248. The highest number of reported fires - 332 took place in 2008, and the least - 190 in 2013. The data has a decreasing trend.
 When looking into fire subcategories, the most reports belonged to: Structure Fires (63.9%), and Outside Fires (23.0%).