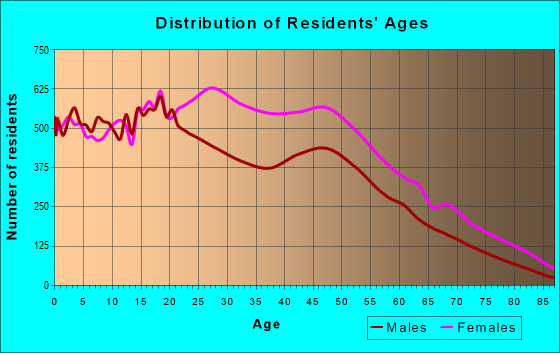
Estimated zip code population in 2022: 81,806 Zip code population in 2010: 67,053 Zip code population in 2000: 61,955
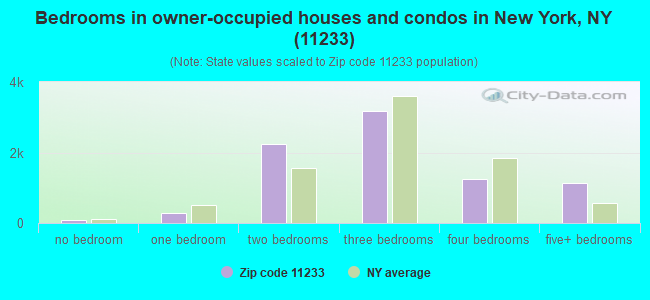
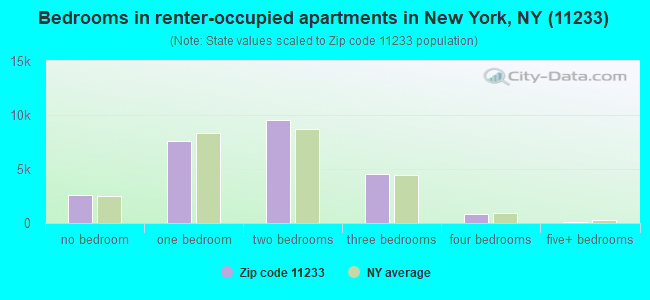
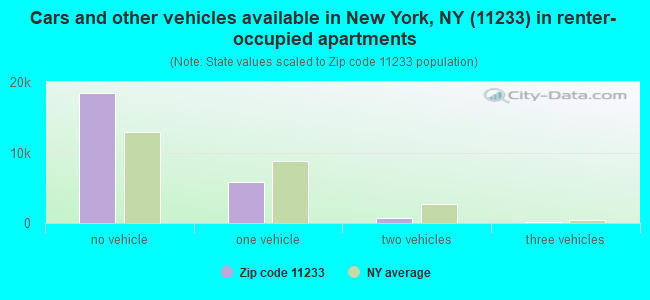
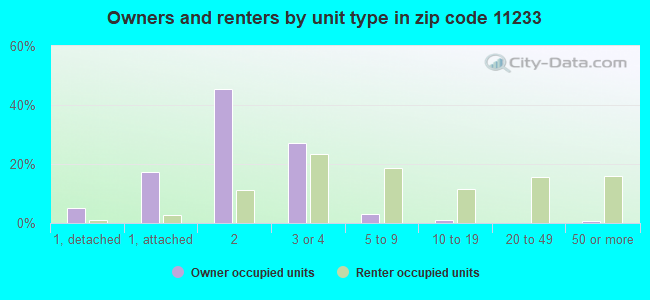
Houses and condos: 34,614 Renter-occupied apartments: 25,152
% of renters here:
75%
State:
46%
March 2022 cost of living index in zip code 11233: 164.3 (very high, U.S. average is 100)
Land area: 1.3 sq. mi. Water area: 0.0 sq. mi.
Population density: 60,692 people per square mile
(very high).
OSM Map
General Map
Google Map
MSN Map
OSM Map
General Map
Google Map
MSN Map
OSM Map
General Map
Google Map
MSN Map
OSM Map
General Map
Google Map
MSN Map
Please wait while loading the map...
Real estate property taxes paid for housing units in 2022:
This zip code:
0.4% ($3,689)
New York:
1.5% ($6,180)
Median real estate property taxes paid for housing units with mortgages in 2022: $3,850 (0.3%) Median real estate property taxes paid for housing units with no mortgage in 2022: $3,348 (0.4%)
Averages for the 2020 tax year for zip code 11233, filed in 2021:
Average Adjusted Gross Income (AGI) in 2020: $48,345 (Individual Income Tax Returns)
Here:
$48,345
State:
$90,930
Salary/wage: $46,402 (reported on 84.4% of returns)
Here:
$46,402
State:
$72,104
(% of AGI for various income ranges: 950.8% for AGIs below $25k, 3521.6% for AGIs $25k-50k, 7007.3% for AGIs $50k-75k, 10891.7% for AGIs $75k-100k, 18451.9% for AGIs $100k-200k, 69473.8% for AGIs over 200k)
Taxable interest for individuals: $520 (reported on 14.3% of returns)
This zip code:
$520
New York:
$3,075
(% of AGI for various income ranges: 1.9% for AGIs below $25k, 2.6% for AGIs $25k-50k, 7.2% for AGIs $50k-75k, 14.3% for AGIs $75k-100k, 18.7% for AGIs $100k-200k, 529.6% for AGIs over 200k)
Ordinary dividends: $1,590 (reported on 6.9% of returns)
Here:
$1,590
State:
$11,095
(% of AGI for various income ranges: 3.1% for AGIs below $25k, 5.5% for AGIs $25k-50k, 10.0% for AGIs $50k-75k, 21.5% for AGIs $75k-100k, 40.4% for AGIs $100k-200k, 638.8% for AGIs over 200k)
Net capital gain/loss in AGI: +$9,810 (reported on 7.2% of returns)
Here:
+$9,810
State:
+$44,925
(% of AGI for various income ranges: 2.0% for AGIs below $25k, 5.5% for AGIs $25k-50k, 21.2% for AGIs $50k-75k, 46.5% for AGIs $75k-100k, 237.0% for AGIs $100k-200k, 7495.0% for AGIs over 200k)
Profit/loss from business: +$7,321 (reported on 17.8% of returns)
Here:
+$7,321
State:
+$14,940
(% of AGI for various income ranges: 156.7% for AGIs below $25k, 76.5% for AGIs $25k-50k, 96.6% for AGIs $50k-75k, 183.7% for AGIs $75k-100k, 420.6% for AGIs $100k-200k, 3918.3% for AGIs over 200k)
Taxable individual retirement arrangement distribution: $12,258 (reported on 1.6% of returns)
11233:
$12,258
New York:
$19,609
(% of AGI for various income ranges: 8.5% for AGIs below $25k, 13.1% for AGIs $25k-50k, 27.0% for AGIs $50k-75k, 33.4% for AGIs $75k-100k, 87.6% for AGIs $100k-200k, 675.8% for AGIs over 200k)
Self-employed (Keogh) retirement plans: $16,256 (reported on 0.3% of returns)
11233:
$16,256
New York:
$32,497
(% of AGI for various income ranges: 6.1% for AGIs $50k-75k, 25.8% for AGIs $100k-200k, 351.7% for AGIs over 200k)
Total itemized deductions: $27,465 (reported on 6.4% of returns)
Here:
$27,465
State:
$39,326
(% of AGI for various income ranges: 26.5% for AGIs below $25k, 66.7% for AGIs $25k-50k, 228.9% for AGIs $50k-75k, 529.1% for AGIs $75k-100k, 1240.2% for AGIs $100k-200k, 6119.6% for AGIs over 200k)
Charity contributions: $6,753 (reported on 5.2% of returns)
Here:
$6,753
State:
$15,420
(% of AGI for various income ranges: 1.7% for AGIs below $25k, 12.7% for AGIs $25k-50k, 51.5% for AGIs $50k-75k, 121.3% for AGIs $75k-100k, 265.1% for AGIs $100k-200k, 1046.7% for AGIs over 200k)
Taxes paid: $8,313 (reported on 6.4% of returns)
11233:
$8,313
State:
$9,183
(% of AGI for various income ranges: 5.3% for AGIs below $25k, 17.9% for AGIs $25k-50k, 72.8% for AGIs $50k-75k, 181.8% for AGIs $75k-100k, 436.7% for AGIs $100k-200k, 1467.1% for AGIs over 200k)
Earned income credit: $2,201 (reported on 23.0% of returns)
Here:
$2,201
State:
$2,138
(% of AGI for various income ranges: 120.1% for AGIs below $25k, 67.2% for AGIs $25k-50k, 0.3% for AGIs $50k-75k)
Percentage of individuals using paid preparers for their 2020 taxes: 94.3%
Here:
94%
State:
95%
(% for various income ranges: 92.9% for AGIs below $25k, 95.8% for AGIs $25k-50k, 94.5% for AGIs $50k-75k, 95.5% for AGIs $75k-100k, 93.3% for AGIs $100k-200k, 95.2% for AGIs over 200k)
Averages for the 2012 tax year for zip code 11233, filed in 2013:
Average Adjusted Gross Income (AGI) in 2012: $33,075 (Individual Income Tax Returns)
Here:
$33,075
State:
$77,088
Salary/wage: $33,946 (reported on 84.2% of returns)
Here:
$33,946
State:
$60,593
(% of AGI for various income ranges: 70.7% for AGIs below $25k, 93.2% for AGIs $25k-50k, 91.9% for AGIs $50k-75k, 90.6% for AGIs $75k-100k, 86.7% for AGIs $100k-200k, 68.8% for AGIs over 200k)
Taxable interest for individuals: $257 (reported on 13.8% of returns)
This zip code:
$257
New York:
$3,125
(% of AGI for various income ranges: 0.1% for AGIs below $25k, 0.1% for AGIs $100k-200k, 0.2% for AGIs over 200k)
Ordinary dividends: $1,292 (reported on 3.9% of returns)
Here:
$1,292
State:
$10,299
(% of AGI for various income ranges: 0.2% for AGIs below $25k, 0.2% for AGIs $50k-75k, 0.3% for AGIs $100k-200k, 0.3% for AGIs over 200k)
Net capital gain/loss in AGI: +$5,491 (reported on 2.8% of returns)
Here:
+$5,491
State:
+$42,474
(% of AGI for various income ranges: 0.4% for AGIs $100k-200k, 11.1% for AGIs over 200k)
Profit/loss from business: +$7,863 (reported on 18.4% of returns)
Here:
+$7,863
State:
+$16,168
(% of AGI for various income ranges: 18.1% for AGIs below $25k, 0.7% for AGIs $25k-50k, 0.7% for AGIs $50k-75k, 0.4% for AGIs $75k-100k, 1.3% for AGIs $100k-200k, 5.4% for AGIs over 200k)
Taxable individual retirement arrangement distribution: $10,470 (reported on 1.9% of returns)
11233:
$10,470
New York:
$17,621
(% of AGI for various income ranges: 0.4% for AGIs below $25k, 0.4% for AGIs $25k-50k, 0.5% for AGIs $50k-75k, 0.5% for AGIs $75k-100k, 1.7% for AGIs $100k-200k)
Self-employment retirement plans: $12,950 (reported on 0.1% of returns)
11233:
$12,950
New York:
$27,330
Total itemized deductions: $18,570 (28% of AGI, reported on 23.5% of returns)
Here:
$18,570
State:
$34,985
Here:
27.6% of AGI
State:
21.3% of AGI
(% of AGI for various income ranges: 3.5% for AGIs below $25k, 10.4% for AGIs $25k-50k, 17.0% for AGIs $50k-75k, 20.1% for AGIs $75k-100k, 20.7% for AGIs $100k-200k, 17.0% for AGIs over 200k)
Charity contributions: $3,675 (reported on 19.9% of returns)
Here:
$3,675
State:
$5,572
(% of AGI for various income ranges: 0.5% for AGIs below $25k, 1.9% for AGIs $25k-50k, 3.1% for AGIs $50k-75k, 3.2% for AGIs $75k-100k, 3.0% for AGIs $100k-200k, 1.9% for AGIs over 200k)
Taxes paid: $6,480 (reported on 23.3% of returns)
11233:
$6,480
State:
$18,656
(% of AGI for various income ranges: 0.6% for AGIs below $25k, 2.5% for AGIs $25k-50k, 5.7% for AGIs $50k-75k, 8.2% for AGIs $75k-100k, 9.0% for AGIs $100k-200k, 9.2% for AGIs over 200k)
Earned income credit: $2,502 (reported on 38.2% of returns)
Here:
$2,502
State:
$2,230
(% of AGI for various income ranges: 12.4% for AGIs below $25k, 1.4% for AGIs $25k-50k)
Percentage of individuals using paid preparers for their 2012 taxes: 66.7%
Here:
67%
State:
66%
(% for various income ranges: 66.2% for AGIs below $25k, 65.6% for AGIs $25k-50k, 67.9% for AGIs $50k-75k, 70.3% for AGIs $75k-100k, 73.9% for AGIs $100k-200k, 81.8% for AGIs over 200k)
Averages for the 2004 tax year for zip code 11233, filed in 2005:
Average Adjusted Gross Income (AGI) in 2004: $27,466 (Individual Income Tax Returns)
Here:
$27,466
State:
$59,519
Salary/wage: $28,596 (reported on 88.4% of returns)
Here:
$28,596
State:
$50,673
(% of AGI for various income ranges: 74.3% for AGIs below $10k, 85.8% for AGIs $10k-25k, 96.9% for AGIs $25k-50k, 95.5% for AGIs $50k-75k, 92.4% for AGIs $75k-100k, 79.7% for AGIs over 100k)
Taxable interest for individuals: $392 (reported on 20.3% of returns)
This zip code:
$392
New York:
$2,377
(% of AGI for various income ranges: 0.8% for AGIs below $10k, 0.3% for AGIs $10k-25k, 0.2% for AGIs $25k-50k, 0.3% for AGIs $50k-75k, 0.2% for AGIs $75k-100k, 0.8% for AGIs over 100k)
Taxable dividends: $428 (reported on 4.5% of returns)
Here:
$428
State:
$5,394
(% of AGI for various income ranges: 0.1% for AGIs below $10k, 0.1% for AGIs $10k-25k, 0.1% for AGIs $25k-50k, 0.1% for AGIs $50k-75k, 0.1% for AGIs $75k-100k, 0.2% for AGIs over 100k)
Net capital gain/loss: +$4,816 (reported on 2.5% of returns)
Here:
+$4,816
State:
+$23,581
(% of AGI for various income ranges: -0.0% for AGIs below $10k, -0.0% for AGIs $10k-25k, 0.0% for AGIs $25k-50k, 0.1% for AGIs $50k-75k, 0.6% for AGIs $75k-100k, 6.0% for AGIs over 100k)
Profit/loss from business: +$5,510 (reported on 13.7% of returns)
Here:
+$5,510
State:
+$13,809
(% of AGI for various income ranges: 28.2% for AGIs below $10k, 7.2% for AGIs $10k-25k, 0.1% for AGIs $25k-50k, 0.2% for AGIs $50k-75k, -0.1% for AGIs $75k-100k, 1.2% for AGIs over 100k)
IRA payment deduction: $1,481 (reported on 1.1% of returns)
11233:
$1,481
New York:
$3,115
(% of AGI for various income ranges: 0.1% for AGIs below $10k, 0.1% for AGIs $10k-25k, 0.1% for AGIs $25k-50k, 0.0% for AGIs $50k-75k, 0.1% for AGIs $75k-100k)
Total itemized deductions: $16,803 (34% of AGI, reported on 28.6% of returns)
Here:
$16,803
State:
$25,864
Here:
34.3% of AGI
State:
21.9% of AGI
(% of AGI for various income ranges: 2.8% for AGIs below $10k, 7.4% for AGIs $10k-25k, 18.0% for AGIs $25k-50k, 24.2% for AGIs $50k-75k, 24.2% for AGIs $75k-100k, 25.1% for AGIs over 100k)
Charity contributions deductions: $3,667 (7% of AGI, reported on 26.6% of returns)
Here:
$3,667
State:
$4,439
Here:
7.4% of AGI
State:
3.6% of AGI
(% of AGI for various income ranges: 0.3% for AGIs below $10k, 1.4% for AGIs $10k-25k, 3.9% for AGIs $25k-50k, 5.0% for AGIs $50k-75k, 5.0% for AGIs $75k-100k, 3.9% for AGIs over 100k)
Total tax: $2,798 (reported on 60.9% of returns)
11233:
$2,798
State:
$11,730
(% of AGI for various income ranges: 4.6% for AGIs below $10k, 3.0% for AGIs $10k-25k, 4.9% for AGIs $25k-50k, 8.3% for AGIs $50k-75k, 10.5% for AGIs $75k-100k, 13.9% for AGIs over 100k)
Earned income credit: $1,969 (reported on 39.3% of returns)
Here:
$1,969
State:
$1,757
Percentage of individuals using paid preparers for their 2004 taxes: 72.4%
Here:
72%
State:
67%
(% for various income ranges: 71.6% for AGIs below $10k, 76.1% for AGIs $10k-25k, 69.9% for AGIs $25k-50k, 70.2% for AGIs $50k-75k, 70.4% for AGIs $75k-100k, 77.8% for AGIs over 100k)
Likely homosexual households (counted as self-reported same-sex unmarried-partner households)
Lesbian couples: 0.1% of all households
Gay men: 0.2% of all households
Household received Food Stamps/SNAP in the past 12 months: 9,846 Household did not receive Food Stamps/SNAP in the past 12 months: 23,915
Women who had a birth in the past 12 months: 776 (311 now married, 477 unmarried) Women who did not have a birth in the past 12 months: 22,505 (5,284 now married, 17,362 unmarried)
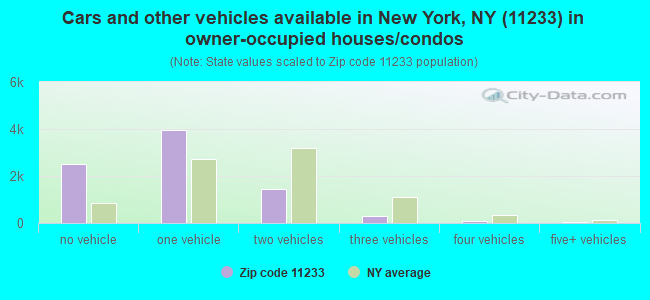
Housing units in zip code 11233 with a mortgage: 6,007 (665 second mortgage, 84 home equity loan, 467 both second mortgage and home equity loan) Median monthly owner costs for units with a mortgage: $3,275 Median monthly owner costs for units without a mortgage: $867
Residents with income below the poverty level in 2022:
This zip code:
25.7%
Whole state:
14.3%
Residents with income below 50% of the poverty level in 2022:
This zip code:
8.4%
Whole state:
6.8%
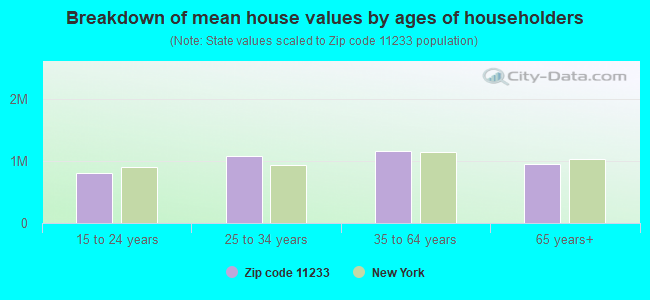
Median number of rooms in houses and condos:
Here:
5.3
State:
6.3
Median number of rooms in apartments:
Here:
3.8
State:
3.8
Notable locations in this zip code not listed on our city pages
Notable locations in zip code 11233: Callhan-Kelly Square (A), Fulton Park Plaza (B), Saratoga Branch Brooklyn Public Library (C), Macon Branch Brooklyn Public Library (D), Fire Department New York City Engine 214 Ladder 111 (E), Fire Department New York City Engine 227 (F), New York Ladder Company 111 (G). Display/hide their locations on the map
Churches in zip code 11233 include: New Hope Spiritual Mission (A), Metropolitan Baptist Church (B), Pleasant Grove Baptist Church (C), Greater Mount Sinai Church (D), Saint Pauls Pentecostal Church (E), Saint Johns Baptist Church (F), Kingdom Hall of Jehovah's Witnesses (G), Nazarene Congregational Church (H), Holy Rosary Roman Catholic Church (I). Display/hide their locations on the map
Parks in zip code 11233 include: Saratoga Park (1), Fulton Park (2), Callahan And Kelly Park (3), Hull Street Garden (4), Marion-Hopkinson Playground (5), Fish Playground (6), Weeksville Playground (7), Pacific Playground (8), Saratoga Ballfields (9). Display/hide their locations on the map
5,308 married couples with children.
7,576 single-parent households (866 men, 6,710 women).
79.4% of residents of 11233 zip code speak English at home.
11.5% of residents speak Spanish at home (69% very well, 16% well, 12% not well, 3% not at all).
4.5% of residents speak other Indo-European language at home (72% very well, 19% well, 8% not well, 1% not at all).
1.3% of residents speak Asian or Pacific Island language at home (39% very well, 39% well, 16% not well, 7% not at all).
2.8% of residents speak other language at home (83% very well, 14% well, 2% not well, 1% not at all).
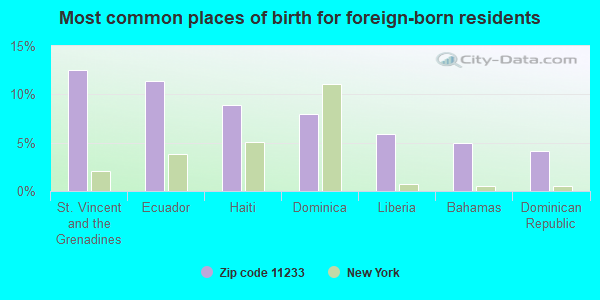
Foreign born population: 20,041 (24.5%) (62.2% of them are naturalized citizens)
This zip code:
24.5%
Whole state:
22.7%
12%St. Vincent and the Grenadines
11%Ecuador
9%Haiti
8%Dominica
6%Liberia
5%Bahamas
4%Dominican Republic
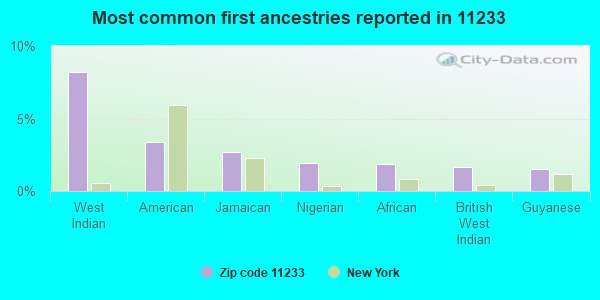
8%West Indian
3%American
3%Jamaican
2%Nigerian
2%African
2%British West Indian
2%Guyanese
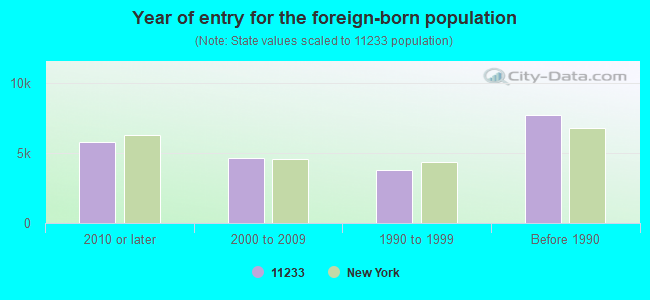
Year of entry for the foreign-born population
5,7942010 or later
4,6302000 to 2009
3,7591990 to 1999
7,702Before 1990
Major facilities with environmental interests located in this zip code:
H S FINISHING PRODUCTS CORPORATION (1768-84 DEAN STREET in BROOKLYN, NY)
AIR MINOR (AIRS/AFS) SUPERFUND (Superfund database) - ICIS-02-2004-2031, FORMAL ENFORCEMENT ACTION (Integrated Compliance Information System) - ICIS-02-1993-0246, FORMAL ENFORCEMENT ACTION, ICIS-02-1986-0091, ICIS-02-1988-0133, ICIS-02-1995-0232, ICIS-02-1993-0155, COMPLIANCE ACTIVITY (Tracking inspections of insecticide, fungicide, and rodenticide, and toxic substances) CRITERIA AND HAZARDOUS AIR POLLUTANT INVENTORY (Inventory of air pollution sources) Conditionally Exempt Small Quantity Generators, less than 100 kg/month of hazardous waste (Resource Conservation and Recovery Act (tracking hazardous waste)) - notification TRI REPORTER (Tracking of toxic chemicals releasing facilities) Business SIC classification: ELECTROPLATING, PLATING, POLISHING, ANODIZING, AND COLORING; COATING, ENGRAVING, AND ALLIED SERVICES; REUPHOLSTERY AND FURNITURE REPAIR Organizations: MARK PACKER (CONTACT/OWNER)
Alternative names: H.S. FINISHING PRODUCTS (WITHDRAWN), HALLMARK FINISHING CORP., HS FINISHING-DEAN ST
GIORDANO & SONS INC (165 ROCKAWAY AVE in BROOKLYN, NY)
AIR MINOR (AIRS/AFS) STATE MASTER (New York facility tracking) - AIR PROGRAM, HAZARDOUS WASTE PROGRAM Small Quantity Generators, between 100 kg and 1000 kg of hazardous waste/month (Resource Conservation and Recovery Act (tracking hazardous waste)) - notification Business SIC classification: DRYCLEANING PLANTS, EXCEPT RUG CLEANING Business NAICS classification: DRYCLEANING AND LAUNDRY SERVICES (EXCEPT COIN-OPERATED). Organizations: JOSEPH GIORDANO (CONTACT/OWNER)
BILL S DRY CLEANERS (2043 ATLANTIC AVE in BROOKLYN, NY)
AIR MINOR (AIRS/AFS) STATE MASTER (New York facility tracking) - AIR PROGRAM Conditionally Exempt Small Quantity Generators, less than 100 kg/month of hazardous waste (Resource Conservation and Recovery Act (tracking hazardous waste)) - notification Business SIC classification: DRYCLEANING PLANTS, EXCEPT RUG CLEANING Organizations: TREVOR P DYER (CONTACT/OWNER)
Alternative names: BILLS DRY CLEANERS
CITY CTR COLL AUTO BODY (46 HULL STREET in BROOKLYN, NY)
AIR MINOR (AIRS/AFS) STATE MASTER (New York facility tracking) - AIR PROGRAM Organizations: CITY CENTER COLLISION (LEGALLY RESPONSIBLE PARTY)
Alternative names: CITY CENTER COLLISION AUTO BODY
IS 55 ( in BROOKLYN, NY)
(National Center for Education Statistics) - STATE ID-332300010055 Organizations: NEW YORK CITY PUBLIC SCHOOLS (SCHOOL DISTRICT)
IS 391 MAHALIA JACKSON IS ( in BROOKLYN, NY)
(National Center for Education Statistics) - STATE ID-338500010391 Organizations: NEW YORK CITY PUBLIC SCHOOLS (SCHOOL DISTRICT)
CLEARPOOL CHARTER SCHOOL ( in BROOKLYN, NY)
(National Center for Education Statistics) - STATE ID-331600860809
CITGO (1998 ATLANTIC AVE. in BROOKLYN, NY)
(Integrated Compliance Information System) - ICIS-02-1992-0157, FORMAL ENFORCEMENT ACTION Business SIC classification: GASOLINE SERVICE STATIONS
CITGO (1802 ATLANTIC AVE. in BROOKLYN, NY)
(Integrated Compliance Information System) - ICIS-02-1992-0157, FORMAL ENFORCEMENT ACTION Business SIC classification: GASOLINE SERVICE STATIONS
HALSEY DRUG COMPANY INCORPORATED (1827 PACIFIC ST in BROOKLYN, NY)
AIR MINOR (AIRS/AFS) COMPLIANCE ACTIVITY (Tracking inspections of insecticide, fungicide, and rodenticide, and toxic substances) Small Quantity Generators, between 100 kg and 1000 kg of hazardous waste/month (Resource Conservation and Recovery Act (tracking hazardous waste)) Business SIC classification: PHARMACEUTICAL PREPARATIONS
CON EDISON - VS V-4492 (GARDNER AVENUE AND INGRAHAM ST in BROOKLYN, NY)
Large Quantity Generators, more that 1000 kg of hazardous waste/month (Resource Conservation and Recovery Act (tracking hazardous waste)) Organizations: CONSOLIDATED EDISON COMPANY OF NY, INC. (CONTACT/OPERATOR)
CON ED - MH 3629 (HERKIMER ST & WILLIAM PL in BROOKLYN, NY)
HAZARDOUS WASTE BIENNIAL REPORTER (Resource Conservation and Recovery Act (tracking hazardous waste)) (Resource Conservation and Recovery Act (tracking hazardous waste))
CON ED - MH 55629 (FULTON ST - PENNSYLVANIA AVE in BROOKLYN, NY)
HAZARDOUS WASTE BIENNIAL REPORTER (Resource Conservation and Recovery Act (tracking hazardous waste)) (Resource Conservation and Recovery Act (tracking hazardous waste))
Housing units lacking complete plumbing facilities: 1.8% Housing units lacking complete kitchen facilities: 2.1%
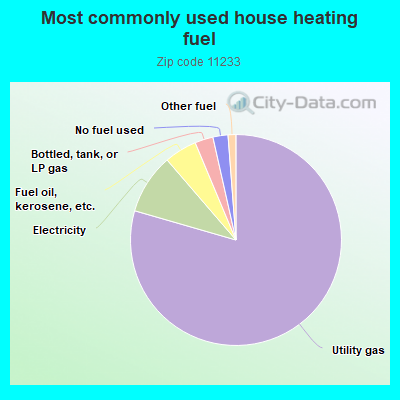
79.4%Utility gas
9.2%Electricity
5.0%Fuel oil, kerosene, etc.
2.8%Bottled, tank, or LP gas
2.3%No fuel used
1.2%Other fuel
Population in 1990: 58,827. Population change in the 1990s: +3,128 (+5.3%).
Place of birth for U.S.-born residents:
This state: 47,454
Northeast: 2,162
Midwest: 1,628
South: 6,305
West: 2,321
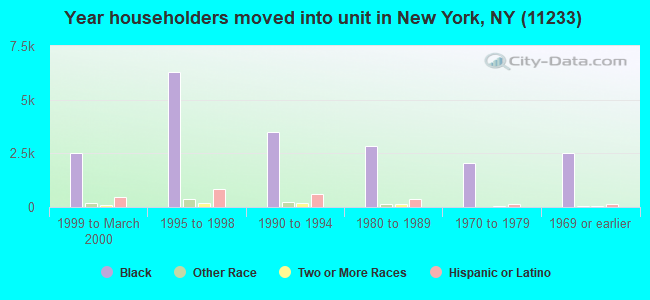
65% of the 11233 zip code residents lived in the same house 5 years ago. Out of people who lived in different houses, 80% lived in this county. Out of people who lived in different counties, 50% lived in New York.
91% of the 11233 zip code residents lived in the same house 1 year ago. Out of people who lived in different houses, 64% moved from this county. Out of people who lived in different houses, 15% moved from different county within same state. Out of people who lived in different houses, 13% moved from different state. Out of people who lived in different houses, 7% moved from abroad.
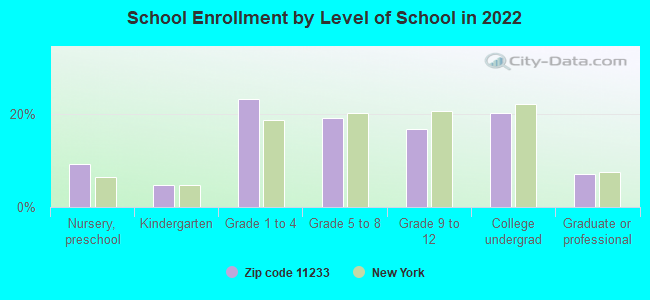
Private vs. public school enrollment:
Students in private schools in grades 1 to 8 (elementary and middle school): 561
Here:
7.6%
New York:
15.6%
Students in private schools in grades 9 to 12 (high school): 172
Here:
5.8%
New York:
15.0%
Students in private undergraduate colleges: 1,783
Here:
50.0%
New York:
39.2%
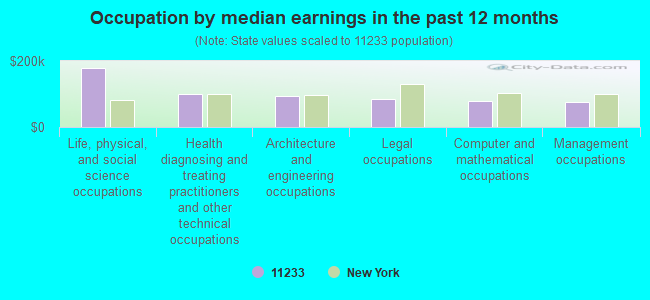
Occupation by median earnings in the past 12 months ($)
179,264Life, physical, and social science occupations
98,771Health diagnosing and treating practitioners and other technical occupations
94,411Architecture and engineering occupations
85,628Legal occupations
77,336Computer and mathematical occupations
76,072Management occupations
Top industries in this zip code by the number of employees in 2005:
Health Care and Social Assistance: Child Day Care Services (50-99 employees: 3 establishments, 20-49 employees: 5 establishments, 10-19 employees: 2 establishments, 1-4 employees: 9 establishments)
Health Care and Social Assistance: Nursing Care Facilities (250-499: 1)
Health Care and Social Assistance: Other Individual and Family Services (100-249: 1, 10-19: 2, 5-9: 1)
Health Care and Social Assistance: Child and Youth Services (100-249: 1)
2007 - 2018 National Fire Incident Reporting System (NFIRS) incidents
According to the data from the years 2007 - 2018 the average number of fires per year is 426. The highest number of reported fires - 540 took place in 2008, and the least - 354 in 2011. The data has a decreasing trend.
When looking into fire subcategories, the most reports belonged to: Structure Fires (75.2%), and Outside Fires (15.5%).
Fire incident types reported to NFIRS in Zip Code 11233
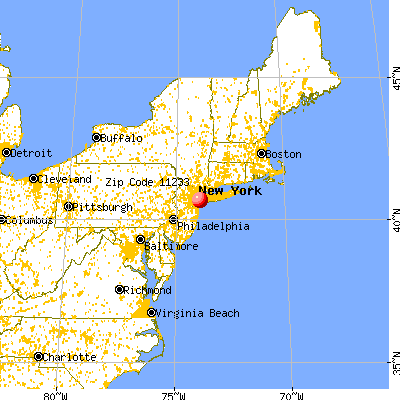


 Nearest zip codes: 11221, 11212, 11213, 11237, 11207, 11216.


 According to the data from the years 2007 - 2018 the average number of fires per year is 426. The highest number of reported fires - 540 took place in 2008, and the least - 354 in 2011. The data has a decreasing trend.
 When looking into fire subcategories, the most reports belonged to: Structure Fires (75.2%), and Outside Fires (15.5%).