Estimated zip code population in 2022: 61,383 Zip code population in 2010: 54,316 Zip code population in 2000: 55,775
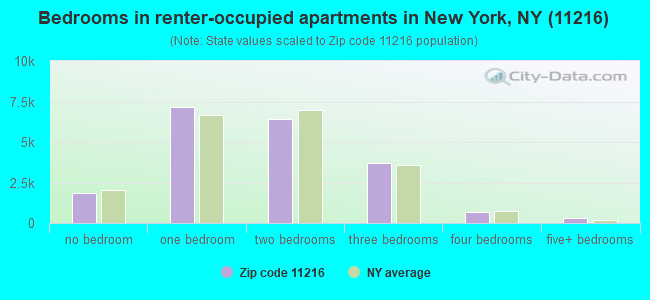
Houses and condos: 28,903 Renter-occupied apartments: 20,181
% of renters here:
75%
State:
46%
March 2022 cost of living index in zip code 11216: 162.1 (very high, U.S. average is 100)
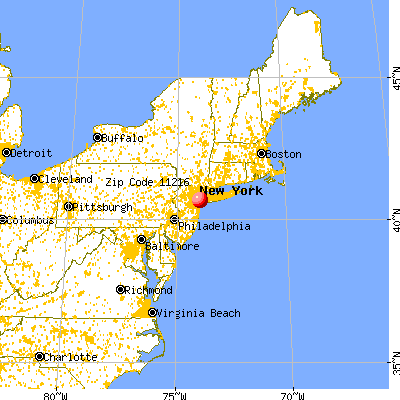
Land area: 0.9 sq. mi. Water area: 0.0 sq. mi.
Population density: 65,620 people per square mile
(very high).
OSM Map
General Map
Google Map
MSN Map
OSM Map
General Map
Google Map
MSN Map
OSM Map
General Map
Google Map
MSN Map
OSM Map
General Map
Google Map
MSN Map
Please wait while loading the map...
Real estate property taxes paid for housing units in 2022:
This zip code:
0.3% ($4,629)
New York:
1.5% ($6,180)
Median real estate property taxes paid for housing units with mortgages in 2022: $4,706 (0.3%) Median real estate property taxes paid for housing units with no mortgage in 2022: $4,183 (0.4%)
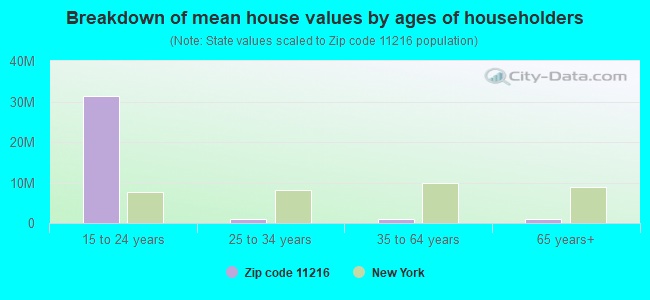
Estimated median house/condo value in 2022: $1,418,235
11216:
$1,418,235
New York:
$400,400
According to our research of New York and other state lists, there were 52 registered sex offenders living in 11216 zip code as of April 27, 2024. The ratio of all residents to sex offenders in zip code 11216 is 1,089 to 1. The ratio of registered sex offenders to all residents in this zip code is near the state average.
Median resident age:
This zip code:
34.8 years
New York median age:
40.0 years
Average household size:
This zip code:
2.2 people
New York:
2.5 people
Averages for the 2020 tax year for zip code 11216, filed in 2021:
Average Adjusted Gross Income (AGI) in 2020: $65,930 (Individual Income Tax Returns)
Here:
$65,930
State:
$90,930
Salary/wage: $63,414 (reported on 85.3% of returns)
Here:
$63,414
State:
$72,104
(% of AGI for various income ranges: 942.0% for AGIs below $25k, 3612.3% for AGIs $25k-50k, 7061.0% for AGIs $50k-75k, 11209.4% for AGIs $75k-100k, 19719.4% for AGIs $100k-200k, 99779.0% for AGIs over 200k)
Taxable interest for individuals: $549 (reported on 20.7% of returns)
This zip code:
$549
New York:
$3,075
(% of AGI for various income ranges: 3.3% for AGIs below $25k, 8.2% for AGIs $25k-50k, 8.3% for AGIs $50k-75k, 15.9% for AGIs $75k-100k, 31.7% for AGIs $100k-200k, 341.0% for AGIs over 200k)
Ordinary dividends: $2,720 (reported on 16.1% of returns)
Here:
$2,720
State:
$11,095
(% of AGI for various income ranges: 9.4% for AGIs below $25k, 13.3% for AGIs $25k-50k, 30.2% for AGIs $50k-75k, 59.9% for AGIs $75k-100k, 144.4% for AGIs $100k-200k, 1546.2% for AGIs over 200k)
Net capital gain/loss in AGI: +$13,473 (reported on 15.3% of returns)
Here:
+$13,473
State:
+$44,925
(% of AGI for various income ranges: 10.4% for AGIs below $25k, 21.3% for AGIs $25k-50k, 41.1% for AGIs $50k-75k, 76.2% for AGIs $75k-100k, 284.7% for AGIs $100k-200k, 12594.8% for AGIs over 200k)
Profit/loss from business: +$12,183 (reported on 22.6% of returns)
Here:
+$12,183
State:
+$14,940
(% of AGI for various income ranges: 218.0% for AGIs below $25k, 218.0% for AGIs $25k-50k, 221.5% for AGIs $50k-75k, 381.6% for AGIs $75k-100k, 731.0% for AGIs $100k-200k, 5737.2% for AGIs over 200k)
Taxable individual retirement arrangement distribution: $12,816 (reported on 1.9% of returns)
11216:
$12,816
New York:
$19,609
(% of AGI for various income ranges: 13.9% for AGIs below $25k, 20.5% for AGIs $25k-50k, 25.0% for AGIs $50k-75k, 31.6% for AGIs $75k-100k, 118.6% for AGIs $100k-200k, 295.0% for AGIs over 200k)
Self-employed (Keogh) retirement plans: $20,292 (reported on 0.8% of returns)
11216:
$20,292
New York:
$32,497
(% of AGI for various income ranges: 3.5% for AGIs $25k-50k, 8.5% for AGIs $50k-75k, 19.8% for AGIs $75k-100k, 60.3% for AGIs $100k-200k, 716.5% for AGIs over 200k)
Total itemized deductions: $27,626 (reported on 6.9% of returns)
Here:
$27,626
State:
$39,326
(% of AGI for various income ranges: 28.6% for AGIs below $25k, 67.8% for AGIs $25k-50k, 144.7% for AGIs $50k-75k, 308.1% for AGIs $75k-100k, 850.9% for AGIs $100k-200k, 5354.2% for AGIs over 200k)
Charity contributions: $6,171 (reported on 5.6% of returns)
Here:
$6,171
State:
$15,420
(% of AGI for various income ranges: 2.2% for AGIs below $25k, 9.0% for AGIs $25k-50k, 26.4% for AGIs $50k-75k, 67.8% for AGIs $75k-100k, 149.9% for AGIs $100k-200k, 1010.0% for AGIs over 200k)
Taxes paid: $8,606 (reported on 6.9% of returns)
11216:
$8,606
State:
$9,183
(% of AGI for various income ranges: 4.9% for AGIs below $25k, 16.9% for AGIs $25k-50k, 43.6% for AGIs $50k-75k, 118.3% for AGIs $75k-100k, 317.9% for AGIs $100k-200k, 1428.8% for AGIs over 200k)
Earned income credit: $1,737 (reported on 15.2% of returns)
Here:
$1,737
State:
$2,138
(% of AGI for various income ranges: 85.2% for AGIs below $25k, 42.1% for AGIs $25k-50k)
Percentage of individuals using paid preparers for their 2020 taxes: 95.0%
Here:
95%
State:
95%
(% for various income ranges: 93.4% for AGIs below $25k, 95.2% for AGIs $25k-50k, 96.1% for AGIs $50k-75k, 95.4% for AGIs $75k-100k, 96.1% for AGIs $100k-200k, 97.0% for AGIs over 200k)
Averages for the 2012 tax year for zip code 11216, filed in 2013:
Average Adjusted Gross Income (AGI) in 2012: $37,236 (Individual Income Tax Returns)
Here:
$37,236
State:
$77,088
Salary/wage: $38,027 (reported on 84.8% of returns)
Here:
$38,027
State:
$60,593
(% of AGI for various income ranges: 71.8% for AGIs below $25k, 91.2% for AGIs $25k-50k, 92.1% for AGIs $50k-75k, 91.6% for AGIs $75k-100k, 87.1% for AGIs $100k-200k, 73.2% for AGIs over 200k)
Taxable interest for individuals: $345 (reported on 16.9% of returns)
This zip code:
$345
New York:
$3,125
(% of AGI for various income ranges: 0.2% for AGIs below $25k, 0.1% for AGIs $50k-75k, 0.1% for AGIs $75k-100k, 0.2% for AGIs $100k-200k, 0.4% for AGIs over 200k)
Ordinary dividends: $1,512 (reported on 7.2% of returns)
Here:
$1,512
State:
$10,299
(% of AGI for various income ranges: 0.4% for AGIs below $25k, 0.3% for AGIs $25k-50k, 0.2% for AGIs $50k-75k, 0.2% for AGIs $75k-100k, 0.4% for AGIs $100k-200k, 0.3% for AGIs over 200k)
Net capital gain/loss in AGI: +$5,506 (reported on 5.4% of returns)
Here:
+$5,506
State:
+$42,474
(% of AGI for various income ranges: 0.2% for AGIs $25k-50k, 0.1% for AGIs $50k-75k, 0.2% for AGIs $75k-100k, 0.8% for AGIs $100k-200k, 8.6% for AGIs over 200k)
Profit/loss from business: +$8,854 (reported on 22.0% of returns)
Here:
+$8,854
State:
+$16,168
(% of AGI for various income ranges: 17.6% for AGIs below $25k, 3.0% for AGIs $25k-50k, 1.9% for AGIs $50k-75k, 2.0% for AGIs $75k-100k, 3.2% for AGIs $100k-200k, 6.7% for AGIs over 200k)
Taxable individual retirement arrangement distribution: $10,706 (reported on 2.0% of returns)
11216:
$10,706
New York:
$17,621
(% of AGI for various income ranges: 0.5% for AGIs below $25k, 0.4% for AGIs $25k-50k, 0.6% for AGIs $50k-75k, 0.5% for AGIs $75k-100k, 1.3% for AGIs $100k-200k)
Self-employment retirement plans: $16,350 (reported on 0.2% of returns)
11216:
$16,350
New York:
$27,330
Total itemized deductions: $18,632 (25% of AGI, reported on 23.6% of returns)
Here:
$18,632
State:
$34,985
Here:
24.6% of AGI
State:
21.3% of AGI
(% of AGI for various income ranges: 4.4% for AGIs below $25k, 8.7% for AGIs $25k-50k, 12.5% for AGIs $50k-75k, 16.9% for AGIs $75k-100k, 18.3% for AGIs $100k-200k, 16.4% for AGIs over 200k)
Charity contributions: $3,139 (reported on 19.1% of returns)
Here:
$3,139
State:
$5,572
(% of AGI for various income ranges: 0.5% for AGIs below $25k, 1.5% for AGIs $25k-50k, 2.0% for AGIs $50k-75k, 2.4% for AGIs $75k-100k, 2.0% for AGIs $100k-200k, 1.0% for AGIs over 200k)
Taxes paid: $7,429 (reported on 23.4% of returns)
11216:
$7,429
State:
$18,656
(% of AGI for various income ranges: 0.7% for AGIs below $25k, 2.1% for AGIs $25k-50k, 4.7% for AGIs $50k-75k, 7.6% for AGIs $75k-100k, 8.8% for AGIs $100k-200k, 10.2% for AGIs over 200k)
Earned income credit: $2,068 (reported on 27.9% of returns)
Here:
$2,068
State:
$2,230
(% of AGI for various income ranges: 8.4% for AGIs below $25k, 0.7% for AGIs $25k-50k)
Percentage of individuals using paid preparers for their 2012 taxes: 58.2%
Here:
58%
State:
66%
(% for various income ranges: 58.5% for AGIs below $25k, 55.0% for AGIs $25k-50k, 57.6% for AGIs $50k-75k, 61.8% for AGIs $75k-100k, 69.0% for AGIs $100k-200k, 78.9% for AGIs over 200k)
Averages for the 2004 tax year for zip code 11216, filed in 2005:
Average Adjusted Gross Income (AGI) in 2004: $27,152 (Individual Income Tax Returns)
Here:
$27,152
State:
$59,519
Salary/wage: $28,753 (reported on 86.5% of returns)
Here:
$28,753
State:
$50,673
(% of AGI for various income ranges: 73.7% for AGIs below $10k, 85.3% for AGIs $10k-25k, 96.4% for AGIs $25k-50k, 94.9% for AGIs $50k-75k, 92.4% for AGIs $75k-100k, 82.0% for AGIs over 100k)
Taxable interest for individuals: $309 (reported on 21.4% of returns)
This zip code:
$309
New York:
$2,377
(% of AGI for various income ranges: 0.9% for AGIs below $10k, 0.3% for AGIs $10k-25k, 0.2% for AGIs $25k-50k, 0.2% for AGIs $50k-75k, 0.2% for AGIs $75k-100k, 0.3% for AGIs over 100k)
Taxable dividends: $528 (reported on 5.5% of returns)
Here:
$528
State:
$5,394
(% of AGI for various income ranges: 0.3% for AGIs below $10k, 0.1% for AGIs $10k-25k, 0.1% for AGIs $25k-50k, 0.1% for AGIs $50k-75k, 0.2% for AGIs $75k-100k, 0.2% for AGIs over 100k)
Net capital gain/loss: +$3,430 (reported on 3.2% of returns)
Here:
+$3,430
State:
+$23,581
(% of AGI for various income ranges: -0.1% for AGIs below $10k, -0.0% for AGIs $10k-25k, -0.0% for AGIs $25k-50k, 0.1% for AGIs $50k-75k, 0.7% for AGIs $75k-100k, 5.2% for AGIs over 100k)
Profit/loss from business: +$5,829 (reported on 15.8% of returns)
Here:
+$5,829
State:
+$13,809
(% of AGI for various income ranges: 29.7% for AGIs below $10k, 8.2% for AGIs $10k-25k, 0.6% for AGIs $25k-50k, -0.2% for AGIs $50k-75k, 0.8% for AGIs $75k-100k, 3.0% for AGIs over 100k)
IRA payment deduction: $1,736 (reported on 1.3% of returns)
11216:
$1,736
New York:
$3,115
(% of AGI for various income ranges: 0.1% for AGIs below $10k, 0.1% for AGIs $10k-25k, 0.1% for AGIs $25k-50k, 0.1% for AGIs $50k-75k)
Total itemized deductions: $16,267 (33% of AGI, reported on 27.1% of returns)
Here:
$16,267
State:
$25,864
Here:
33.3% of AGI
State:
21.9% of AGI
(% of AGI for various income ranges: 3.6% for AGIs below $10k, 7.6% for AGIs $10k-25k, 15.9% for AGIs $25k-50k, 23.2% for AGIs $50k-75k, 23.0% for AGIs $75k-100k, 22.7% for AGIs over 100k)
Charity contributions deductions: $3,532 (7% of AGI, reported on 25.3% of returns)
Here:
$3,532
State:
$4,439
Here:
7.1% of AGI
State:
3.6% of AGI
(% of AGI for various income ranges: 0.4% for AGIs below $10k, 1.4% for AGIs $10k-25k, 3.5% for AGIs $25k-50k, 4.9% for AGIs $50k-75k, 4.2% for AGIs $75k-100k, 3.6% for AGIs over 100k)
Total tax: $2,907 (reported on 64.8% of returns)
11216:
$2,907
State:
$11,730
(% of AGI for various income ranges: 5.4% for AGIs below $10k, 3.6% for AGIs $10k-25k, 5.6% for AGIs $25k-50k, 8.9% for AGIs $50k-75k, 11.5% for AGIs $75k-100k, 15.2% for AGIs over 100k)
Earned income credit: $1,825 (reported on 35.5% of returns)
Here:
$1,825
State:
$1,757
Percentage of individuals using paid preparers for their 2004 taxes: 69.1%
Here:
69%
State:
67%
(% for various income ranges: 67.0% for AGIs below $10k, 71.6% for AGIs $10k-25k, 67.8% for AGIs $25k-50k, 68.9% for AGIs $50k-75k, 71.0% for AGIs $75k-100k, 73.0% for AGIs over 100k)
Likely homosexual households (counted as self-reported same-sex unmarried-partner households)
Lesbian couples: 0.6% of all households
Gay men: 0.2% of all households
Household received Food Stamps/SNAP in the past 12 months: 4,283 Household did not receive Food Stamps/SNAP in the past 12 months: 22,603
Women who had a birth in the past 12 months: 570 (445 now married, 122 unmarried) Women who did not have a birth in the past 12 months: 19,568 (4,552 now married, 15,140 unmarried)
Housing units in zip code 11216 with a mortgage: 5,144 (605 second mortgage, 44 home equity loan, 524 both second mortgage and home equity loan) Houses without a mortgage: 226
Median monthly owner costs for units with a mortgage: $3,860 Median monthly owner costs for units without a mortgage: $930
Residents with income below the poverty level in 2022:
This zip code:
17.3%
Whole state:
14.3%
Residents with income below 50% of the poverty level in 2022:
This zip code:
7.5%
Whole state:
6.8%
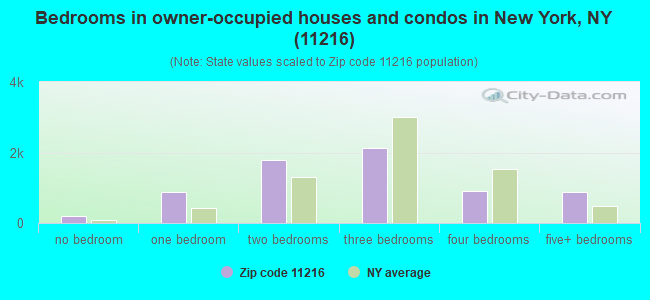
Median number of rooms in houses and condos:
Here:
5.3
State:
6.3
Median number of rooms in apartments:
Here:
3.6
State:
3.8
Notable locations in this zip code not listed on our city pages
Notable locations in zip code 11216: Bedford Branch YMCA (A), Fire Department New York City Engine 235 Battalion 57 (B), Most Worshipful Enoch Grand Lodge (C), Bedford-Stuyvesant Restoration Plaza (D), Bhraggs Grant Square Senior Citizens Center (E). Display/hide their locations on the map
Churches in zip code 11216 include: Charity Neighborhood Baptist Church (A), Washington Temple (B), Bethany Baptist Church (C), Newman Memorial Methodist Church (D), Church of God in Jesus Christ (E), Kingdom Hall of Jehovah's Witnesses (F), Siloam Presbyterian Church (G), Concord Church of Christ (H), Saint George's Episcopal Church (I). Display/hide their locations on the map
Parks in zip code 11216 include: Grant Gore Triangle (1), Stuyvesant Heights Historic District (2), Hancock Playground (3), Saint Andrews Playground (4), David Ruggles Playground (5), Hattie Carthan Playground (6), Kosciuszko Pool (7), Banneker Playground (8), Hattie Carthan Garden (9). Display/hide their locations on the map
5,105 married couples with children.
2,663 single-parent households (425 men, 2,238 women).
78.5% of residents of 11216 zip code speak English at home.
8.5% of residents speak Spanish at home (72% very well, 14% well, 11% not well, 3% not at all).
7.9% of residents speak other Indo-European language at home (76% very well, 19% well, 5% not well, 1% not at all).
2.4% of residents speak Asian or Pacific Island language at home (83% very well, 15% well, 2% not well, 1% not at all).
2.1% of residents speak other language at home (79% very well, 12% well, 10% not well).
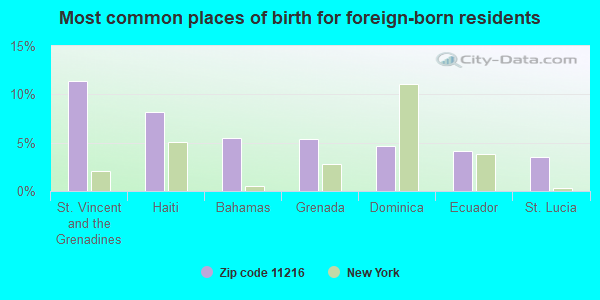
Foreign born population: 13,762 (22.4%) (66.1% of them are naturalized citizens)
This zip code:
22.4%
Whole state:
22.7%
11%St. Vincent and the Grenadines
8%Haiti
5%Bahamas
5%Grenada
5%Dominica
4%Ecuador
4%St. Lucia
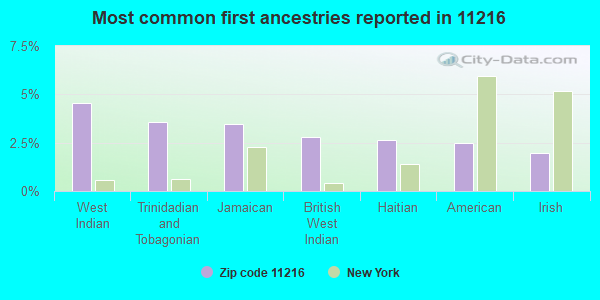
5%West Indian
4%Trinidadian and Tobagonian
3%Jamaican
3%British West Indian
3%Haitian
2%American
2%Irish
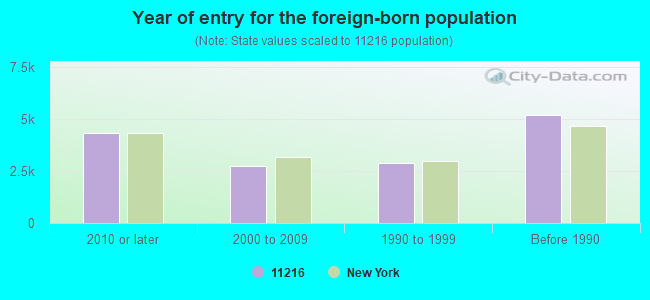
Year of entry for the foreign-born population
4,3202010 or later
2,7552000 to 2009
2,8551990 to 1999
5,180Before 1990
Major facilities with environmental interests located in this zip code:
AMOCO-1009830306005 (1525 BEDFORD AVE in BROOKLYN, NY)
AIR MINOR (AIRS/AFS) STATE MASTER (New York facility tracking) - AIR PROGRAM, (Resource Conservation and Recovery Act (tracking hazardous waste)) Business SIC classification: GASOLINE SERVICE STATIONS Organizations: AMOCO OIL CO (LEGALLY RESPONSIBLE PARTY)
Alternative names: AMOCO SERVICE STATION 10098
CRYSTAL FRENCH CLEANERS (1192 FULTON ST in BROOKLYN, NY)
AIR MINOR (AIRS/AFS) STATE MASTER (New York facility tracking) - AIR PROGRAM, HAZARDOUS WASTE PROGRAM (Resource Conservation and Recovery Act (tracking hazardous waste)) Business SIC classification: DRYCLEANING PLANTS, EXCEPT RUG CLEANING Business NAICS classification: DRYCLEANING AND LAUNDRY SERVICES (EXCEPT COIN-OPERATED). Organizations: CRYSTAL FRENCH CLEANERS INC (LEGALLY RESPONSIBLE PARTY)
Alternative names: CRYSTAL CLEANERS
750 ST MARKS LLC (751 ST MARK S AVE in BROOKLYN, NY)
AIR MINOR (AIRS/AFS) STATE MASTER (New York facility tracking) - AIR PROGRAM Business SIC classification: OPERATORS OF APARTMENT BUILDINGS Organizations: BRENDA MANAGEMENT CORP (LEGALLY RESPONSIBLE PARTY)
, 751 ST MARKS LLC (LEGALLY RESPONSIBLE PARTY)
CON EDISON - MH MH-4546 (ROGERS AVENUE AND PRESIDENT ST in BROOKLYN, NY)
Large Quantity Generators, more that 1000 kg of hazardous waste/month (Resource Conservation and Recovery Act (tracking hazardous waste)) Organizations: CONSOLIDATED EDISON COMPANY OF NY, INC. (CONTACT/OPERATOR)
CON EDISON - VS 7370 (BEDFORD AVE in BROOKLYN, NY)
Large Quantity Generators, more that 1000 kg of hazardous waste/month (Resource Conservation and Recovery Act (tracking hazardous waste)) Organizations: CONSOLIDATED EDISON COMPANY OF NY, INC. (CONTACT/OPERATOR)
CON ED - MH 23775 (DEAN ST & BEDFORD AVE in BROOKLYN, NY)
HAZARDOUS WASTE BIENNIAL REPORTER (Resource Conservation and Recovery Act (tracking hazardous waste)) (Resource Conservation and Recovery Act (tracking hazardous waste))
CON ED - TM 3008 (DECATUR ST & SARATOGA AVE in BROOKLYN, NY)
HAZARDOUS WASTE BIENNIAL REPORTER (Resource Conservation and Recovery Act (tracking hazardous waste)) (Resource Conservation and Recovery Act (tracking hazardous waste))
HG METALS INC (1355 ATLANTIC AVE in BROOKLYN, NY)
(Resource Conservation and Recovery Act (tracking hazardous waste))
CLOCKERS (1163 ATLANTIC AVE in BROOKLYN, NY)
(Resource Conservation and Recovery Act (tracking hazardous waste))
1242 PACIFIC STREET ASSOCIATES (1242 PACIFIC ST in BROOKLYN, NY)
Small Quantity Generators, between 100 kg and 1000 kg of hazardous waste/month (Resource Conservation and Recovery Act (tracking hazardous waste)) - notification Organizations: 1242 PACIFIC ST ASSOCIATES (CONTACT/OWNER)
99 CENT HORIZON (562 NOSTRAND AVE in BROOKLYN, NY)
ENFORCEMENT/COMPLIANCE ACTIVITY (Integrated Compliance Information System) COMPLIANCE ACTIVITY (Tracking inspections of insecticide, fungicide, and rodenticide, and toxic substances) Business SIC classification: MISCELLANEOUS GENERAL MERCHANDISE STORES Alternative names: 99CENT HORIZON
99 CENTS FAMILY STORE (1249 FULTON ST in BROOKLYN, NY)
ENFORCEMENT/COMPLIANCE ACTIVITY (Integrated Compliance Information System) COMPLIANCE ACTIVITY (Tracking inspections of insecticide, fungicide, and rodenticide, and toxic substances) Business SIC classification: PESTICIDES AND AGRICULTURAL CHEMICALS
99 CENTS WORLD (1239 FULTON ST in BROOKLYN, NY)
ENFORCEMENT/COMPLIANCE ACTIVITY (Integrated Compliance Information System) COMPLIANCE ACTIVITY (Tracking inspections of insecticide, fungicide, and rodenticide, and toxic substances) Business SIC classification: PESTICIDES AND AGRICULTURAL CHEMICALS
Housing units lacking complete plumbing facilities: 1.0% Housing units lacking complete kitchen facilities: 1.5%
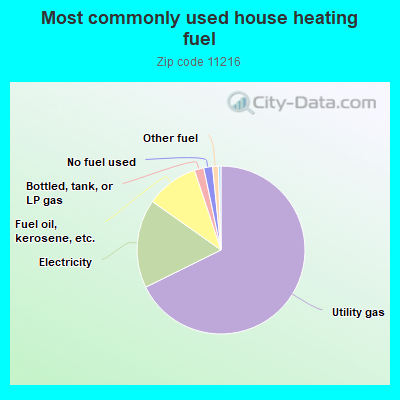
67.7%Utility gas
17.1%Electricity
10.1%Fuel oil, kerosene, etc.
1.8%Bottled, tank, or LP gas
1.7%No fuel used
1.1%Other fuel
Population in 1990: 58,862.
Place of birth for U.S.-born residents:
This state: 28,117
Northeast: 4,839
Midwest: 3,210
South: 6,744
West: 3,595
67% of the 11216 zip code residents lived in the same house 5 years ago. Out of people who lived in different houses, 79% lived in this county. Out of people who lived in different counties, 50% lived in New York.
83% of the 11216 zip code residents lived in the same house 1 year ago. Out of people who lived in different houses, 59% moved from this county. Out of people who lived in different houses, 20% moved from different county within same state. Out of people who lived in different houses, 18% moved from different state. Out of people who lived in different houses, 4% moved from abroad.
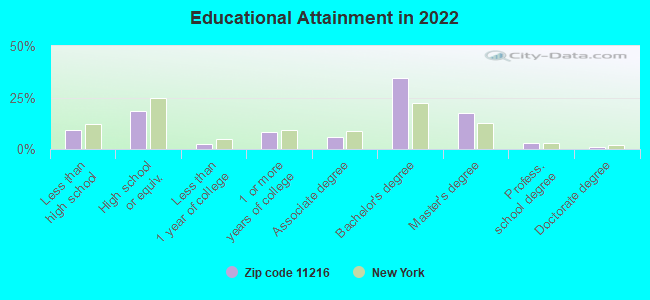
Private vs. public school enrollment:
Students in private schools in grades 1 to 8 (elementary and middle school): 858
Here:
22.1%
New York:
15.6%
Students in private schools in grades 9 to 12 (high school): 436
Here:
22.2%
New York:
15.0%
Students in private undergraduate colleges: 942
Here:
40.1%
New York:
39.2%
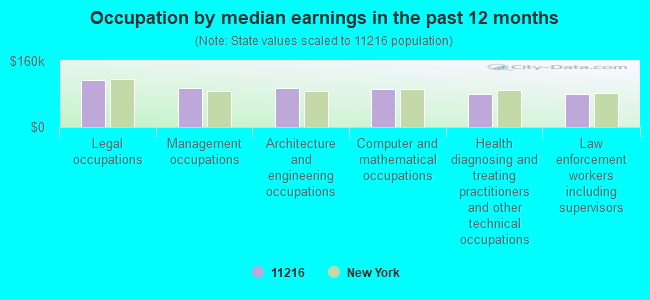
Occupation by median earnings in the past 12 months ($)
115,079Legal occupations
93,365Management occupations
93,359Architecture and engineering occupations
93,330Computer and mathematical occupations
80,940Health diagnosing and treating practitioners and other technical occupations
80,273Law enforcement workers including supervisors
Top industries in this zip code by the number of employees in 2005:
Health Care and Social Assistance: Child Day Care Services (50-99 employees: 1 establishment, 20-49 employees: 4 establishments, 10-19 employees: 2 establishments, 5-9 employees: 3 establishments, 1-4 employees: 8 establishments)
2007 - 2018 National Fire Incident Reporting System (NFIRS) incidents
According to the data from the years 2007 - 2018 the average number of fire incidents per year is 270. The highest number of reported fire incidents - 329 took place in 2008, and the least - 215 in 2017. The data has a declining trend.
When looking into fire subcategories, the most reports belonged to: Structure Fires (70.5%), and Outside Fires (20.4%).
Fire incident types reported to NFIRS in Zip Code 11216


 Nearest zip codes: 11238, 11213, 11225, 11205, 11206, 11221.
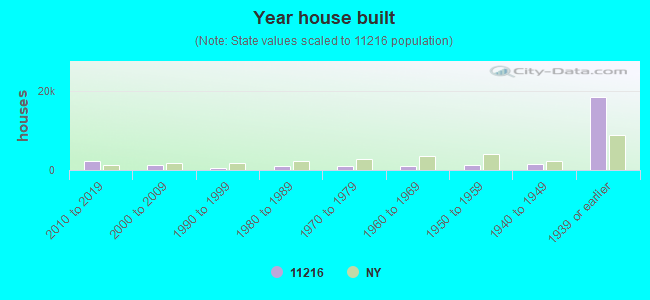


 According to the data from the years 2007 - 2018 the average number of fire incidents per year is 270. The highest number of reported fire incidents - 329 took place in 2008, and the least - 215 in 2017. The data has a declining trend.
 When looking into fire subcategories, the most reports belonged to: Structure Fires (70.5%), and Outside Fires (20.4%).