Estimated zip code population in 2022: 57,126 Zip code population in 2010: 49,262 Zip code population in 2000: 48,965
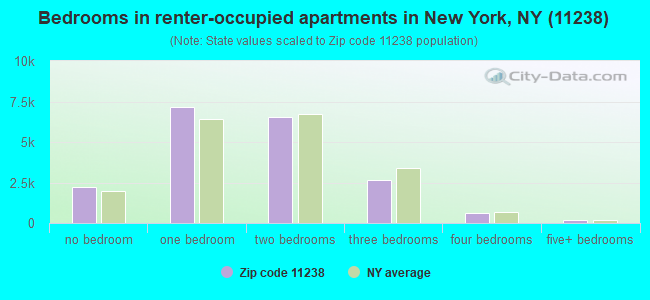
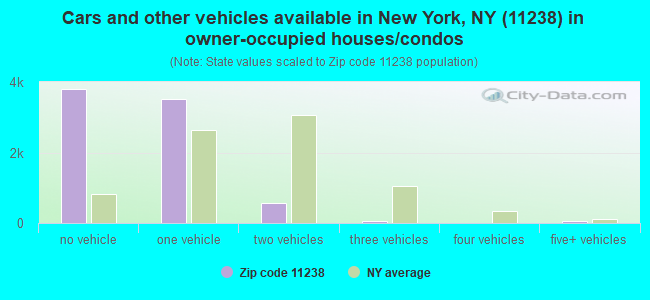
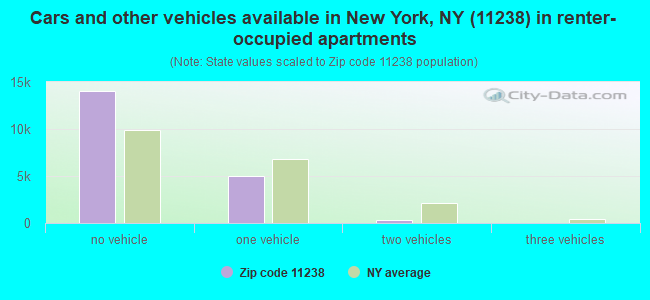
Houses and condos: 29,050 Renter-occupied apartments: 19,349
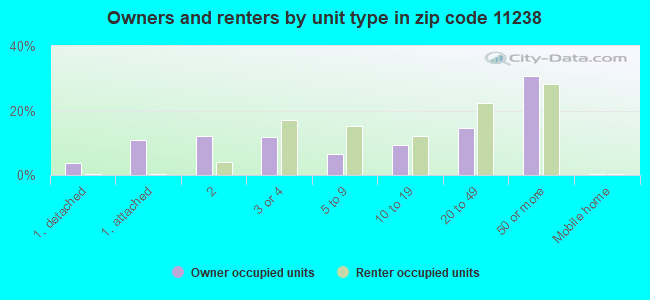
% of renters here:
71%
State:
46%
March 2022 cost of living index in zip code 11238: 154.2 (very high, U.S. average is 100)
Land area: 1.1 sq. mi. Water area: 0.0 sq. mi.
Population density: 51,667 people per square mile
(very high).
OSM Map
General Map
Google Map
MSN Map
OSM Map
General Map
Google Map
MSN Map
OSM Map
General Map
Google Map
MSN Map
OSM Map
General Map
Google Map
MSN Map
Please wait while loading the map...
Real estate property taxes paid for housing units in 2022:
This zip code:
0.5% ($5,473)
New York:
1.5% ($6,180)
Median real estate property taxes paid for housing units with mortgages in 2022: $5,165 (0.4%) Median real estate property taxes paid for housing units with no mortgage in 2022: $6,031 (0.6%)
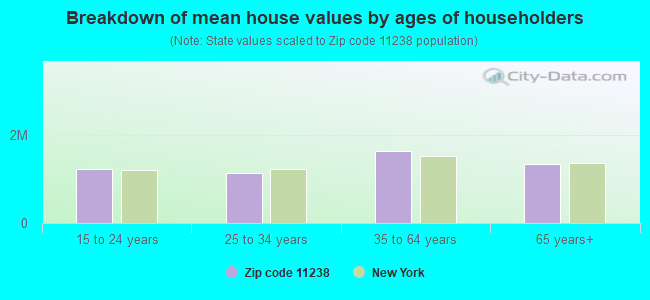
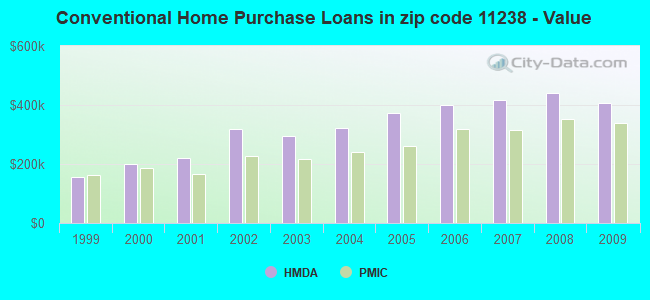
Estimated median house/condo value in 2022: $1,193,694
11238:
$1,193,694
New York:
$400,400
According to our research of New York and other state lists, there were 25 registered sex offenders living in 11238 zip code as of April 27, 2024. The ratio of all residents to sex offenders in zip code 11238 is 2,191 to 1. The ratio of registered sex offenders to all residents in this zip code is lower than the state average.
Median resident age:
This zip code:
35.9 years
New York median age:
40.0 years
Average household size:
This zip code:
2.1 people
New York:
2.5 people
Averages for the 2020 tax year for zip code 11238, filed in 2021:
Average Adjusted Gross Income (AGI) in 2020: $114,467 (Individual Income Tax Returns)
Here:
$114,467
State:
$90,930
Salary/wage: $103,369 (reported on 85.2% of returns)
Here:
$103,369
State:
$72,104
(% of AGI for various income ranges: 941.5% for AGIs below $25k, 3571.1% for AGIs $25k-50k, 7264.9% for AGIs $50k-75k, 10968.1% for AGIs $75k-100k, 20626.0% for AGIs $100k-200k, 130515.0% for AGIs over 200k)
Taxable interest for individuals: $1,302 (reported on 34.2% of returns)
This zip code:
$1,302
New York:
$3,075
(% of AGI for various income ranges: 9.7% for AGIs below $25k, 14.9% for AGIs $25k-50k, 17.6% for AGIs $50k-75k, 30.2% for AGIs $75k-100k, 86.2% for AGIs $100k-200k, 849.2% for AGIs over 200k)
Ordinary dividends: $5,830 (reported on 30.5% of returns)
Here:
$5,830
State:
$11,095
(% of AGI for various income ranges: 33.8% for AGIs below $25k, 45.3% for AGIs $25k-50k, 75.3% for AGIs $50k-75k, 120.1% for AGIs $75k-100k, 334.5% for AGIs $100k-200k, 3491.0% for AGIs over 200k)
Net capital gain/loss in AGI: +$27,602 (reported on 27.9% of returns)
Here:
+$27,602
State:
+$44,925
(% of AGI for various income ranges: 23.1% for AGIs below $25k, 44.6% for AGIs $25k-50k, 72.0% for AGIs $50k-75k, 177.0% for AGIs $75k-100k, 507.2% for AGIs $100k-200k, 21315.2% for AGIs over 200k)
Profit/loss from business: +$18,451 (reported on 22.9% of returns)
Here:
+$18,451
State:
+$14,940
(% of AGI for various income ranges: 233.7% for AGIs below $25k, 277.1% for AGIs $25k-50k, 298.4% for AGIs $50k-75k, 439.4% for AGIs $75k-100k, 1009.7% for AGIs $100k-200k, 5297.8% for AGIs over 200k)
Taxable individual retirement arrangement distribution: $17,544 (reported on 3.9% of returns)
11238:
$17,544
New York:
$19,609
(% of AGI for various income ranges: 27.2% for AGIs below $25k, 28.0% for AGIs $25k-50k, 64.8% for AGIs $50k-75k, 84.8% for AGIs $75k-100k, 197.1% for AGIs $100k-200k, 750.2% for AGIs over 200k)
Self-employed (Keogh) retirement plans: $23,700 (reported on 2.2% of returns)
11238:
$23,700
New York:
$32,497
(% of AGI for various income ranges: 8.0% for AGIs $25k-50k, 20.2% for AGIs $50k-75k, 27.0% for AGIs $75k-100k, 109.6% for AGIs $100k-200k, 1067.6% for AGIs over 200k)
Total itemized deductions: $32,220 (reported on 12.9% of returns)
Here:
$32,220
State:
$39,326
(% of AGI for various income ranges: 54.5% for AGIs below $25k, 112.6% for AGIs $25k-50k, 199.5% for AGIs $50k-75k, 407.4% for AGIs $75k-100k, 970.5% for AGIs $100k-200k, 7268.2% for AGIs over 200k)
Charity contributions: $8,662 (reported on 10.9% of returns)
Here:
$8,662
State:
$15,420
(% of AGI for various income ranges: 3.7% for AGIs below $25k, 16.1% for AGIs $25k-50k, 36.6% for AGIs $50k-75k, 84.2% for AGIs $75k-100k, 176.9% for AGIs $100k-200k, 1926.4% for AGIs over 200k)
Taxes paid: $9,165 (reported on 12.9% of returns)
11238:
$9,165
State:
$9,183
(% of AGI for various income ranges: 14.4% for AGIs below $25k, 25.7% for AGIs $25k-50k, 60.9% for AGIs $50k-75k, 147.3% for AGIs $75k-100k, 349.5% for AGIs $100k-200k, 1756.6% for AGIs over 200k)
Earned income credit: $1,633 (reported on 9.6% of returns)
Here:
$1,633
State:
$2,138
(% of AGI for various income ranges: 71.9% for AGIs below $25k, 37.5% for AGIs $25k-50k)
Percentage of individuals using paid preparers for their 2020 taxes: 95.0%
Here:
95%
State:
95%
(% for various income ranges: 92.0% for AGIs below $25k, 94.9% for AGIs $25k-50k, 95.3% for AGIs $50k-75k, 95.3% for AGIs $75k-100k, 96.3% for AGIs $100k-200k, 97.4% for AGIs over 200k)
Averages for the 2012 tax year for zip code 11238, filed in 2013:
Average Adjusted Gross Income (AGI) in 2012: $65,446 (Individual Income Tax Returns)
Here:
$65,446
State:
$77,088
Salary/wage: $61,615 (reported on 86.5% of returns)
Here:
$61,615
State:
$60,593
(% of AGI for various income ranges: 69.5% for AGIs below $25k, 86.8% for AGIs $25k-50k, 89.0% for AGIs $50k-75k, 86.1% for AGIs $75k-100k, 85.4% for AGIs $100k-200k, 71.5% for AGIs over 200k)
Taxable interest for individuals: $874 (reported on 31.1% of returns)
This zip code:
$874
New York:
$3,125
(% of AGI for various income ranges: 0.5% for AGIs below $25k, 0.2% for AGIs $25k-50k, 0.2% for AGIs $50k-75k, 0.3% for AGIs $75k-100k, 0.4% for AGIs $100k-200k, 0.6% for AGIs over 200k)
Ordinary dividends: $4,219 (reported on 20.0% of returns)
Here:
$4,219
State:
$10,299
(% of AGI for various income ranges: 1.1% for AGIs below $25k, 0.6% for AGIs $25k-50k, 0.8% for AGIs $50k-75k, 0.8% for AGIs $75k-100k, 1.4% for AGIs $100k-200k, 2.2% for AGIs over 200k)
Net capital gain/loss in AGI: +$11,374 (reported on 15.5% of returns)
Here:
+$11,374
State:
+$42,474
(% of AGI for various income ranges: 0.2% for AGIs below $25k, 0.2% for AGIs $25k-50k, 0.3% for AGIs $50k-75k, 0.7% for AGIs $75k-100k, 1.1% for AGIs $100k-200k, 8.2% for AGIs over 200k)
Profit/loss from business: +$13,854 (reported on 24.5% of returns)
Here:
+$13,854
State:
+$16,168
(% of AGI for various income ranges: 17.9% for AGIs below $25k, 5.5% for AGIs $25k-50k, 3.5% for AGIs $50k-75k, 3.9% for AGIs $75k-100k, 4.5% for AGIs $100k-200k, 4.3% for AGIs over 200k)
Taxable individual retirement arrangement distribution: $16,776 (reported on 3.7% of returns)
11238:
$16,776
New York:
$17,621
(% of AGI for various income ranges: 0.9% for AGIs below $25k, 0.8% for AGIs $25k-50k, 0.6% for AGIs $50k-75k, 1.1% for AGIs $75k-100k, 1.0% for AGIs $100k-200k, 1.1% for AGIs over 200k)
Self-employment retirement plans: $18,615 (reported on 1.4% of returns)
11238:
$18,615
New York:
$27,330
(% of AGI for various income ranges: 0.1% for AGIs $25k-50k, 0.2% for AGIs $50k-75k, 0.2% for AGIs $75k-100k, 0.3% for AGIs $100k-200k, 0.9% for AGIs over 200k)
Total itemized deductions: $24,452 (20% of AGI, reported on 37.4% of returns)
Here:
$24,452
State:
$34,985
Here:
19.9% of AGI
State:
21.3% of AGI
(% of AGI for various income ranges: 6.4% for AGIs below $25k, 7.7% for AGIs $25k-50k, 11.3% for AGIs $50k-75k, 15.9% for AGIs $75k-100k, 17.3% for AGIs $100k-200k, 16.9% for AGIs over 200k)
Charity contributions: $3,113 (reported on 30.1% of returns)
Here:
$3,113
State:
$5,572
(% of AGI for various income ranges: 0.6% for AGIs below $25k, 1.2% for AGIs $25k-50k, 1.6% for AGIs $50k-75k, 1.8% for AGIs $75k-100k, 1.5% for AGIs $100k-200k, 1.4% for AGIs over 200k)
Taxes paid: $13,062 (reported on 37.2% of returns)
11238:
$13,062
State:
$18,656
(% of AGI for various income ranges: 1.3% for AGIs below $25k, 2.0% for AGIs $25k-50k, 4.6% for AGIs $50k-75k, 7.8% for AGIs $75k-100k, 9.3% for AGIs $100k-200k, 11.5% for AGIs over 200k)
Earned income credit: $1,853 (reported on 16.0% of returns)
Here:
$1,853
State:
$2,230
(% of AGI for various income ranges: 6.2% for AGIs below $25k, 0.5% for AGIs $25k-50k)
Percentage of individuals using paid preparers for their 2012 taxes: 56.8%
Here:
57%
State:
66%
(% for various income ranges: 55.5% for AGIs below $25k, 51.9% for AGIs $25k-50k, 53.0% for AGIs $50k-75k, 60.3% for AGIs $75k-100k, 65.7% for AGIs $100k-200k, 77.5% for AGIs over 200k)
Averages for the 2004 tax year for zip code 11238, filed in 2005:
Average Adjusted Gross Income (AGI) in 2004: $42,133 (Individual Income Tax Returns)
Here:
$42,133
State:
$59,519
Salary/wage: $41,781 (reported on 87.4% of returns)
Here:
$41,781
State:
$50,673
(% of AGI for various income ranges: 94.4% for AGIs below $10k, 80.3% for AGIs $10k-25k, 92.6% for AGIs $25k-50k, 92.2% for AGIs $50k-75k, 90.2% for AGIs $75k-100k, 77.4% for AGIs over 100k)
Taxable interest for individuals: $647 (reported on 35.8% of returns)
This zip code:
$647
New York:
$2,377
(% of AGI for various income ranges: 2.4% for AGIs below $10k, 0.6% for AGIs $10k-25k, 0.4% for AGIs $25k-50k, 0.5% for AGIs $50k-75k, 0.5% for AGIs $75k-100k, 0.6% for AGIs over 100k)
Taxable dividends: $1,690 (reported on 16.5% of returns)
Here:
$1,690
State:
$5,394
(% of AGI for various income ranges: 2.0% for AGIs below $10k, 0.6% for AGIs $10k-25k, 0.4% for AGIs $25k-50k, 0.5% for AGIs $50k-75k, 0.6% for AGIs $75k-100k, 1.1% for AGIs over 100k)
Net capital gain/loss: +$7,498 (reported on 12.5% of returns)
Here:
+$7,498
State:
+$23,581
(% of AGI for various income ranges: -0.8% for AGIs below $10k, -0.1% for AGIs $10k-25k, 0.1% for AGIs $25k-50k, 0.2% for AGIs $50k-75k, 0.6% for AGIs $75k-100k, 7.2% for AGIs over 100k)
Profit/loss from business: +$8,017 (reported on 20.7% of returns)
Here:
+$8,017
State:
+$13,809
(% of AGI for various income ranges: 27.4% for AGIs below $10k, 9.7% for AGIs $10k-25k, 2.2% for AGIs $25k-50k, 1.9% for AGIs $50k-75k, 2.4% for AGIs $75k-100k, 4.3% for AGIs over 100k)
IRA payment deduction: $2,475 (reported on 2.5% of returns)
11238:
$2,475
New York:
$3,115
(% of AGI for various income ranges: 0.3% for AGIs below $10k, 0.2% for AGIs $10k-25k, 0.2% for AGIs $25k-50k, 0.1% for AGIs $50k-75k, 0.1% for AGIs $75k-100k, 0.1% for AGIs over 100k)
Self-employed pension: $13,685 (reported on 1.0% of returns)
Here:
$13,685
New York:
$19,016
(% of AGI for various income ranges: 0.1% for AGIs $10k-25k, 0.1% for AGIs $25k-50k, 0.1% for AGIs $50k-75k, 0.2% for AGIs $75k-100k, 0.8% for AGIs over 100k)
Total itemized deductions: $18,366 (25% of AGI, reported on 37.4% of returns)
Here:
$18,366
State:
$25,864
Here:
24.7% of AGI
State:
21.9% of AGI
(% of AGI for various income ranges: 8.4% for AGIs below $10k, 7.5% for AGIs $10k-25k, 13.9% for AGIs $25k-50k, 19.2% for AGIs $50k-75k, 20.2% for AGIs $75k-100k, 18.4% for AGIs over 100k)
Charity contributions deductions: $3,291 (4% of AGI, reported on 34.1% of returns)
Here:
$3,291
State:
$4,439
Here:
4.3% of AGI
State:
3.6% of AGI
(% of AGI for various income ranges: 0.6% for AGIs below $10k, 1.2% for AGIs $10k-25k, 2.8% for AGIs $25k-50k, 3.4% for AGIs $50k-75k, 3.0% for AGIs $75k-100k, 2.5% for AGIs over 100k)
Total tax: $6,524 (reported on 77.2% of returns)
11238:
$6,524
State:
$11,730
(% of AGI for various income ranges: 5.7% for AGIs below $10k, 4.7% for AGIs $10k-25k, 7.7% for AGIs $25k-50k, 11.2% for AGIs $50k-75k, 13.1% for AGIs $75k-100k, 18.7% for AGIs over 100k)
Earned income credit: $1,619 (reported on 20.2% of returns)
Here:
$1,619
State:
$1,757
Percentage of individuals using paid preparers for their 2004 taxes: 63.5%
Here:
63%
State:
67%
(% for various income ranges: 58.9% for AGIs below $10k, 65.9% for AGIs $10k-25k, 60.6% for AGIs $25k-50k, 64.5% for AGIs $50k-75k, 68.4% for AGIs $75k-100k, 74.3% for AGIs over 100k)
Likely homosexual households (counted as self-reported same-sex unmarried-partner households)
Lesbian couples: 0.6% of all households
Gay men: 0.7% of all households
Household received Food Stamps/SNAP in the past 12 months: 3,247 Household did not receive Food Stamps/SNAP in the past 12 months: 23,700
Women who had a birth in the past 12 months: 727 (571 now married, 152 unmarried) Women who did not have a birth in the past 12 months: 17,656 (5,379 now married, 12,326 unmarried)
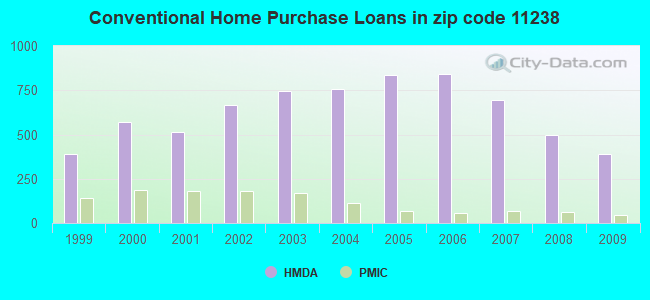
Housing units in zip code 11238 with a mortgage: 5,382 (586 second mortgage, 5 home equity loan, 500 both second mortgage and home equity loan) Houses without a mortgage: 128
Median monthly owner costs for units with a mortgage: $3,584 Median monthly owner costs for units without a mortgage: $894
Residents with income below the poverty level in 2022:
This zip code:
11.8%
Whole state:
14.3%
Residents with income below 50% of the poverty level in 2022:
This zip code:
3.7%
Whole state:
6.8%
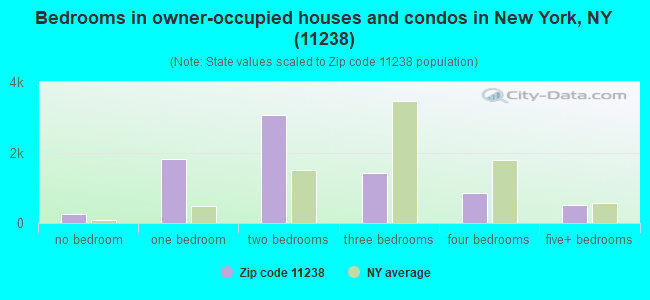
Median number of rooms in houses and condos:
Here:
4.3
State:
6.3
Median number of rooms in apartments:
Here:
3.4
State:
3.8
Notable locations in this zip code not listed on our city pages
Notable locations in zip code 11238: Bedford Branch Brooklyn Public Library (A), Central Library (B), Fire Department New York Engine 280 Ladder 132 (C), New York Ladder Company 132 (D), Saint James Towers (E), Clinton Hill Branch Brooklyn Public Library (F), Brooklyn Museum of Art (G). Display/hide their locations on the map
Churches in zip code 11238 include: Church of the Nazarene (A), Saint Peter Claver Roman Catholic Church (B), Saint Augustines Protestant Episcopal Church (C), Mount Sinai Baptist Church (D), Evening Star Baptist Church (E), Saint Theresa Roman Catholic Church (F), Bethel Seventh Day Adventist Church (G), Brown Memorial Baptist Church (H), Galilee Baptist Church (I). Display/hide their locations on the map
Parks in zip code 11238 include: Mount Prospect Park (1), Grand Army Plaza (2), Brooklyn Botanic Gardens (3), Elijah Stroud Playground (4), Lowry Triangle (5), Crispus Attucks Playground (6), Gateway Triangle (7), Edmonds Playground (8), DeKalb Playground (9). Display/hide their locations on the map
6,391 married couples with children.
2,289 single-parent households (606 men, 1,683 women).
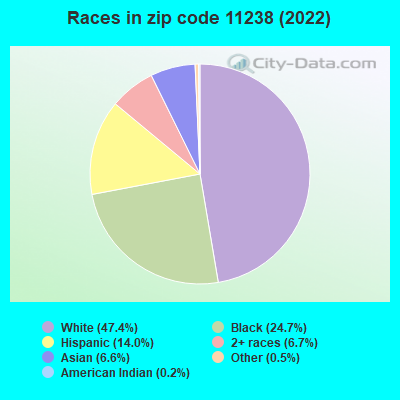
80.1% of residents of 11238 zip code speak English at home.
7.2% of residents speak Spanish at home (75% very well, 12% well, 9% not well, 4% not at all).
6.9% of residents speak other Indo-European language at home (82% very well, 14% well, 4% not well).
3.7% of residents speak Asian or Pacific Island language at home (66% very well, 19% well, 9% not well, 6% not at all).
1.7% of residents speak other language at home (74% very well, 16% well, 4% not well, 5% not at all).
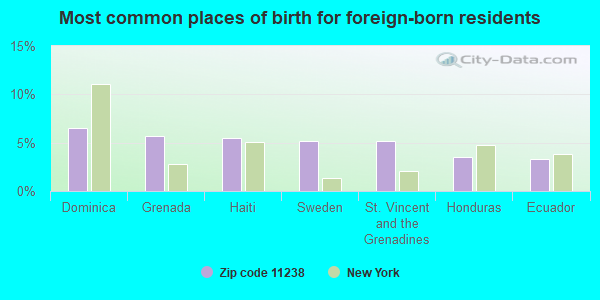
Foreign born population: 11,238 (19.7%) (61.9% of them are naturalized citizens)
This zip code:
19.7%
Whole state:
22.7%
7%Dominica
6%Grenada
6%Haiti
5%Sweden
5%St. Vincent and the Grenadines
4%Honduras
3%Ecuador
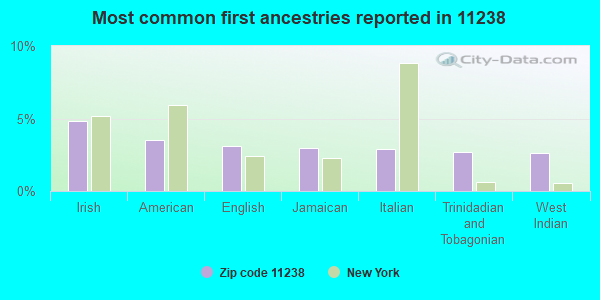
5%Irish
4%American
3%English
3%Jamaican
3%Italian
3%Trinidadian and Tobagonian
3%West Indian
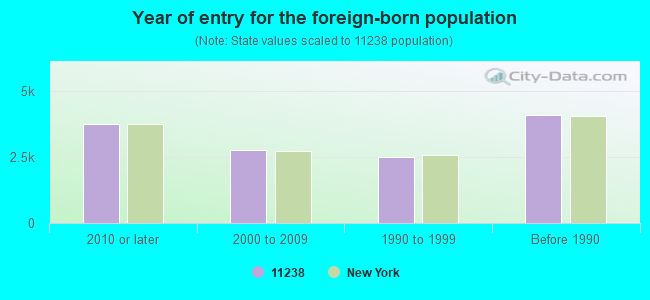
Year of entry for the foreign-born population
3,7632010 or later
2,7552000 to 2009
2,4931990 to 1999
4,097Before 1990
Major facilities with environmental interests located in this zip code:
GOLDEN TOUCH CLEANERS (326 FLATBUSH AVENUE in BROOKLYN, NY)
AIR MINOR (AIRS/AFS) STATE MASTER (New York facility tracking) - AIR PROGRAM (Resource Conservation and Recovery Act (tracking hazardous waste)) Business SIC classification: DRYCLEANING PLANTS, EXCEPT RUG CLEANING Business NAICS classification: DRYCLEANING AND LAUNDRY SERVICES (EXCEPT COIN-OPERATED). Organizations: GOLDEN TOUCH CLEANERS INC (LEGALLY RESPONSIBLE PARTY)
AMERICANA GRAPHIC-532 ST MARKS AVE (532 ST MARKS AVENUE in BROOKLYN, NY)
AIR MINOR (AIRS/AFS) STATE MASTER (New York facility tracking) - AIR PROGRAM, Business SIC classification: COMMERCIAL PRINTING, LITHOGRAPHIC Organizations: AMERICANA GRAPHIC SERVICES INC (AIR PERMITTING FACILITY OWNER CONTACT)
, AMAL PRINTING & PUBLISHING CORP (LEGALLY RESPONSIBLE PARTY)
Alternative names: AMERICANA GRAPHIC SERVICES
AMERICAN KRAUTOL (201 SAINT MARKS AVE in BROOKLYN, NY)
(Integrated Compliance Information System) - ICIS-02-1988-0170, FORMAL ENFORCEMENT ACTION COMPLIANCE ACTIVITY (Tracking inspections of insecticide, fungicide, and rodenticide, and toxic substances) (Resource Conservation and Recovery Act (tracking hazardous waste)) Alternative names: WORLDWIDE POLLUTION CONTROL
AMOCO-406330124005 (514 VANDERBILT AVE in BROOKLYN, NY)
AIR MINOR (AIRS/AFS) STATE MASTER (New York facility tracking) - AIR PROGRAM Business SIC classification: GASOLINE SERVICE STATIONS Organizations: AMOCO OIL CO (LEGALLY RESPONSIBLE PARTY)
GRADE A COLLISION, INC. (1077 ATLANTIC AVE in BROOKLYN, NY)
STATE MASTER (New York facility tracking) - AIR PROGRAM Conditionally Exempt Small Quantity Generators, less than 100 kg/month of hazardous waste (Resource Conservation and Recovery Act (tracking hazardous waste)) - notification Business SIC classification: TOP, BODY, AND UPHOLSTERY REPAIR SHOPS AND PAINT SHOPS Business NAICS classification: AUTOMOTIVE BODY, PAINT, AND INTERIOR REPAIR AND MAINTENANCE. Organizations: GRADE A COLLISION INC (AIR PERMITTING FACILITY OWNER CONTACT)
CLINTON HILL APARTMENTS (345 CLINTON AVENUE in BROOKLYN, NY)
AIR SYNTHETIC MINOR (AIRS/AFS) STATE MASTER (New York facility tracking) - AIR PROGRAM CRITERIA AND HAZARDOUS AIR POLLUTANT INVENTORY (Inventory of air pollution sources) Business SIC classification: OPERATORS OF APARTMENT BUILDINGS; OPERATORS OF DWELLINGS OTHER THAN APARTMENT BUILDINGS Business NAICS classification: LESSORS OF RESIDENTIAL BUILDINGS AND DWELLINGS. Organizations: P LEONARD JONES (FACILITY APPLICATION CONTACT)
, CLINTON HILL APARTMENTS OWNERS CORP (LEGALLY RESPONSIBLE PARTY)
INTERFAITH MEDICAL CENTER. (555 PROSPECT PLACE (BROOKLYN JEWISH DIV) in BROOKLYN, NY)
STATE MASTER (New York facility tracking) - AIR PROGRAM Conditionally Exempt Small Quantity Generators, less than 100 kg/month of hazardous waste (Resource Conservation and Recovery Act (tracking hazardous waste)) - notification Business SIC and NAICS classification: GENERAL MEDICAL AND SURGICAL HOSPITALS Alternative names: INTERFAITH MEDICAL CTR - JEWISH HOSPITAL
HO'S TRADING INC (1010 DEAN ST in BROOKLYN, NY)
(Integrated Compliance Information System) - ICIS-02-2002-5212, FORMAL ENFORCEMENT ACTION COMPLIANCE ACTIVITY (Tracking inspections of insecticide, fungicide, and rodenticide, and toxic substances) Business SIC classification: PESTICIDES AND AGRICULTURAL CHEMICALS
ACORN COMM HS ( in BROOKLYN, NY)
(National Center for Education Statistics) - STATE ID-337800010499 Organizations: NEW YORK CITY PUBLIC SCHOOLS (SCHOOL DISTRICT)
CON ED - M/H 4514 (WASHINGTON AVE & STERLING PL in BROOKLYN, NY)
HAZARDOUS WASTE BIENNIAL REPORTER (Resource Conservation and Recovery Act (tracking hazardous waste)) (Resource Conservation and Recovery Act (tracking hazardous waste)) Alternative names: CON ED - WASHINTON AVE & STERLING PL
CON ED - V 2968 (GRAND ST & FULTON ST in BROOKLYN, NY)
HAZARDOUS WASTE BIENNIAL REPORTER (Resource Conservation and Recovery Act (tracking hazardous waste)) (Resource Conservation and Recovery Act (tracking hazardous waste)) Alternative names: CON ED MH 2968
GUMBALL RUBBISH REMOVAL (510 WAVERLY AVE in BROOKLYN, NY)
Large Quantity Generators, more that 1000 kg of hazardous waste/month (Resource Conservation and Recovery Act (tracking hazardous waste)) TRANSPORTER (Resource Conservation and Recovery Act (tracking hazardous waste)) USED OIL PROGRAM (Resource Conservation and Recovery Act (tracking hazardous waste)) Organizations: ROBERT EDWARDS (CONTACT/OPERATOR)
, A-1 PROPERTIES (CONTACT/OWNER)
IDEAL HANDBAG FACTORY (339 GREENE AVENUE in BROOKLYN, NY)
AIR SYNTHETIC MINOR (AIRS/AFS) (Resource Conservation and Recovery Act (tracking hazardous waste)) Business SIC classification: MANUFACTURING INDUSTRIES Business NAICS classification: ALL OTHER MISCELLANEOUS MANUFACTURING. Alternative names: IDEAL HANDBAG FRAME MANUFACTURING CORPORATION, IDEAL HANDBAG FRAME MFG C
Housing units lacking complete plumbing facilities: 0.7% Housing units lacking complete kitchen facilities: 1.4%
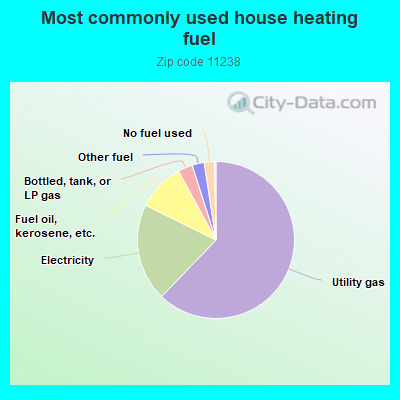
62.2%Utility gas
20.1%Electricity
9.8%Fuel oil, kerosene, etc.
3.0%Bottled, tank, or LP gas
2.5%Other fuel
2.1%No fuel used
Population in 1990: 42,507. Population change in the 1990s: +6,458 (+15.2%).
Place of birth for U.S.-born residents:
This state: 24,271
Northeast: 5,916
Midwest: 3,385
South: 7,034
West: 3,666
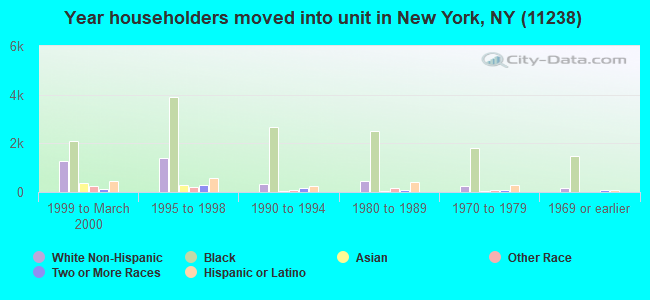
60% of the 11238 zip code residents lived in the same house 5 years ago. Out of people who lived in different houses, 58% lived in this county. Out of people who lived in different counties, 50% lived in New York.
83% of the 11238 zip code residents lived in the same house 1 year ago. Out of people who lived in different houses, 58% moved from this county. Out of people who lived in different houses, 24% moved from different county within same state. Out of people who lived in different houses, 15% moved from different state. Out of people who lived in different houses, 3% moved from abroad.
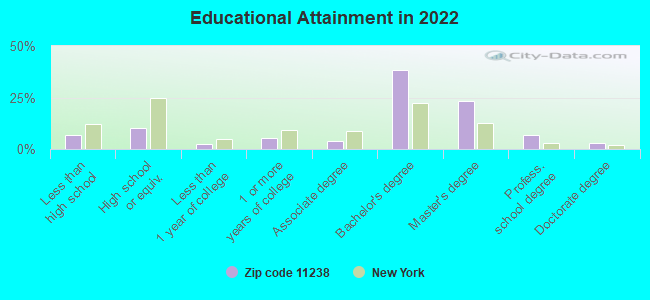
Private vs. public school enrollment:
Students in private schools in grades 1 to 8 (elementary and middle school): 710
Here:
20.2%
New York:
15.6%
Students in private schools in grades 9 to 12 (high school): 230
Here:
19.3%
New York:
15.0%
Students in private undergraduate colleges: 655
Here:
41.7%
New York:
39.2%
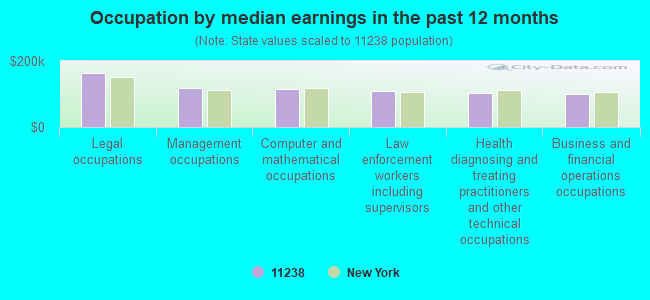
Occupation by median earnings in the past 12 months ($)
164,508Legal occupations
117,582Management occupations
114,282Computer and mathematical occupations
108,607Law enforcement workers including supervisors
102,461Health diagnosing and treating practitioners and other technical occupations
98,706Business and financial operations occupations
Companies with federal contracts located in this zip code:
CPR TECHNOLOGY, INC (640 DEAN ST in BROOKLYN, NY; small business)
$13,250 with U.S. Special Operations Command for Miscellaneous Communication Equipment. Signed on 2005-10-01. Completion date: 2006-09-30.
Top industries in this zip code by the number of employees in 2005:
Information: Libraries and Archives (over 1000 employees: 1 establishment)
Health Care and Social Assistance: Nursing Care Facilities (250-499: 1, 1-4: 1)
Arts, Entertainment, and Recreation: Museums (250-499: 1)
Other Services (except Public Administration): Religious Organizations (100-249: 1, 20-49: 3, 5-9: 2, 1-4: 8)
2007 - 2018 National Fire Incident Reporting System (NFIRS) incidents
According to the data from the years 2007 - 2018 the average number of fires per year is 199. The highest number of reported fires - 234 took place in 2008, and the least - 155 in 2018. The data has a decreasing trend.
When looking into fire subcategories, the most reports belonged to: Structure Fires (73.7%), and Outside Fires (17.5%).
Fire incident types reported to NFIRS in Zip Code 11238

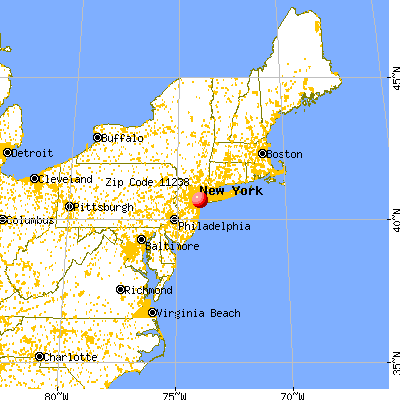


 Nearest zip codes: 11216, 11217, 11205, 11225, 11215, 11213.


 According to the data from the years 2007 - 2018 the average number of fires per year is 199. The highest number of reported fires - 234 took place in 2008, and the least - 155 in 2018. The data has a decreasing trend.
 When looking into fire subcategories, the most reports belonged to: Structure Fires (73.7%), and Outside Fires (17.5%).