Estimated zip code population in 2022: 70,871 Zip code population in 2010: 63,488 Zip code population in 2000: 63,001
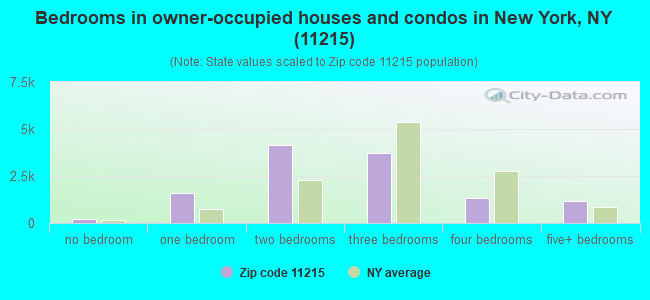
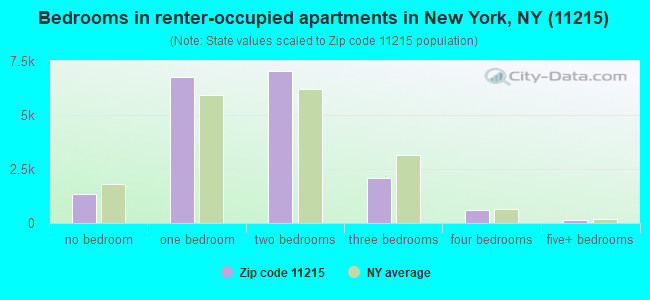
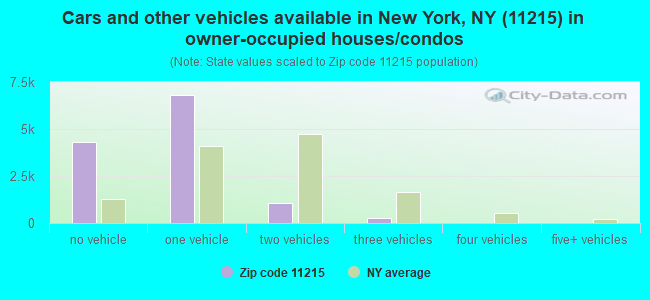
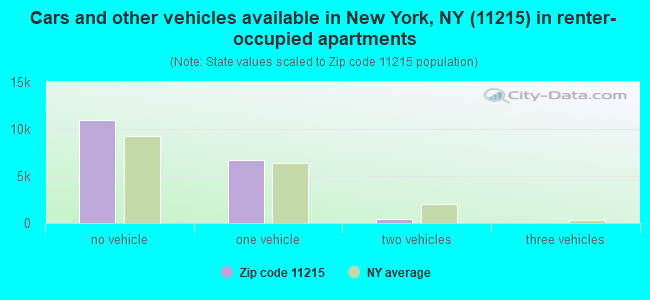
Houses and condos: 32,310 Renter-occupied apartments: 18,031
% of renters here:
60%
State:
46%
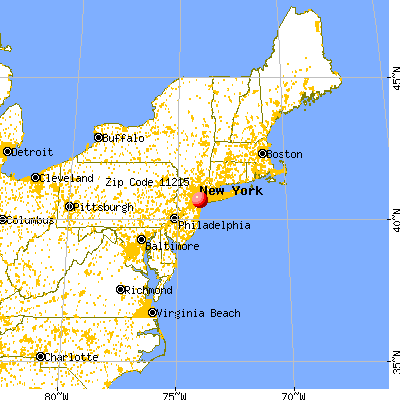
March 2022 cost of living index in zip code 11215: 155.4 (very high, U.S. average is 100)
Land area: 2.2 sq. mi. Water area: 0.0 sq. mi.
Population density: 32,537 people per square mile
(very high).
OSM Map
General Map
Google Map
MSN Map
OSM Map
General Map
Google Map
MSN Map
OSM Map
General Map
Google Map
MSN Map
OSM Map
General Map
Google Map
MSN Map
Please wait while loading the map...
Real estate property taxes paid for housing units in 2022:
This zip code:
0.4% ($6,506)
New York:
1.5% ($6,180)
Median real estate property taxes paid for housing units with mortgages in 2022: $5,958 (0.3%) Median real estate property taxes paid for housing units with no mortgage in 2022: $7,707 (0.5%)
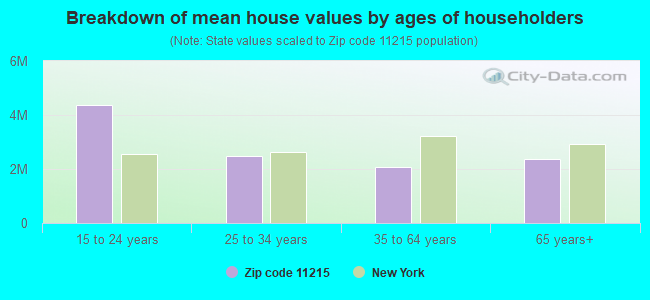
Estimated median house/condo value in 2022: $1,665,189
11215:
$1,665,189
New York:
$400,400
According to our research of New York and other state lists, there were 6 registered sex offenders living in 11215 zip code as of April 26, 2024. The ratio of all residents to sex offenders in zip code 11215 is 11,828 to 1. The ratio of registered sex offenders to all residents in this zip code is much lower than the state average.
Median resident age:
This zip code:
37.9 years
New York median age:
40.0 years
Average household size:
This zip code:
2.3 people
New York:
2.5 people
Averages for the 2020 tax year for zip code 11215, filed in 2021:
Average Adjusted Gross Income (AGI) in 2020: $165,047 (Individual Income Tax Returns)
Here:
$165,047
State:
$90,930
Salary/wage: $142,277 (reported on 83.3% of returns)
Here:
$142,277
State:
$72,104
(% of AGI for various income ranges: 1007.1% for AGIs below $25k, 3574.7% for AGIs $25k-50k, 7062.2% for AGIs $50k-75k, 10710.5% for AGIs $75k-100k, 20438.2% for AGIs $100k-200k, 134708.6% for AGIs over 200k)
Taxable interest for individuals: $2,325 (reported on 47.0% of returns)
This zip code:
$2,325
New York:
$3,075
(% of AGI for various income ranges: 33.5% for AGIs below $25k, 28.6% for AGIs $25k-50k, 44.3% for AGIs $50k-75k, 69.2% for AGIs $75k-100k, 130.3% for AGIs $100k-200k, 1401.9% for AGIs over 200k)
Ordinary dividends: $9,132 (reported on 41.8% of returns)
Here:
$9,132
State:
$11,095
(% of AGI for various income ranges: 81.1% for AGIs below $25k, 96.8% for AGIs $25k-50k, 152.4% for AGIs $50k-75k, 237.0% for AGIs $75k-100k, 523.4% for AGIs $100k-200k, 4841.3% for AGIs over 200k)
Net capital gain/loss in AGI: +$34,127 (reported on 37.8% of returns)
Here:
+$34,127
State:
+$44,925
(% of AGI for various income ranges: 56.4% for AGIs below $25k, 106.5% for AGIs $25k-50k, 145.7% for AGIs $50k-75k, 203.1% for AGIs $75k-100k, 685.0% for AGIs $100k-200k, 20940.9% for AGIs over 200k)
Profit/loss from business: +$28,463 (reported on 25.5% of returns)
Here:
+$28,463
State:
+$14,940
(% of AGI for various income ranges: 277.7% for AGIs below $25k, 502.3% for AGIs $25k-50k, 516.3% for AGIs $50k-75k, 611.5% for AGIs $75k-100k, 1191.8% for AGIs $100k-200k, 7369.8% for AGIs over 200k)
Taxable individual retirement arrangement distribution: $23,832 (reported on 6.5% of returns)
11215:
$23,832
New York:
$19,609
(% of AGI for various income ranges: 54.9% for AGIs below $25k, 61.4% for AGIs $25k-50k, 134.8% for AGIs $50k-75k, 162.1% for AGIs $75k-100k, 383.7% for AGIs $100k-200k, 1283.2% for AGIs over 200k)
Self-employed (Keogh) retirement plans: $27,980 (reported on 3.9% of returns)
11215:
$27,980
New York:
$32,497
(% of AGI for various income ranges: 20.7% for AGIs $25k-50k, 32.8% for AGIs $50k-75k, 56.6% for AGIs $75k-100k, 127.2% for AGIs $100k-200k, 1513.0% for AGIs over 200k)
Total itemized deductions: $38,090 (reported on 17.9% of returns)
Here:
$38,090
State:
$39,326
(% of AGI for various income ranges: 84.2% for AGIs below $25k, 159.2% for AGIs $25k-50k, 267.0% for AGIs $50k-75k, 461.5% for AGIs $75k-100k, 1162.3% for AGIs $100k-200k, 8299.7% for AGIs over 200k)
Charity contributions: $10,536 (reported on 15.6% of returns)
Here:
$10,536
State:
$15,420
(% of AGI for various income ranges: 3.8% for AGIs below $25k, 13.1% for AGIs $25k-50k, 33.4% for AGIs $50k-75k, 60.3% for AGIs $75k-100k, 175.7% for AGIs $100k-200k, 2417.5% for AGIs over 200k)
Taxes paid: $9,310 (reported on 17.9% of returns)
11215:
$9,310
State:
$9,183
(% of AGI for various income ranges: 18.5% for AGIs below $25k, 40.5% for AGIs $25k-50k, 74.3% for AGIs $50k-75k, 157.0% for AGIs $75k-100k, 370.7% for AGIs $100k-200k, 1762.6% for AGIs over 200k)
Earned income credit: $1,429 (reported on 5.8% of returns)
Here:
$1,429
State:
$2,138
(% of AGI for various income ranges: 53.6% for AGIs below $25k, 27.2% for AGIs $25k-50k)
Percentage of individuals using paid preparers for their 2020 taxes: 95.5%
Here:
96%
State:
95%
(% for various income ranges: 92.7% for AGIs below $25k, 95.4% for AGIs $25k-50k, 95.8% for AGIs $50k-75k, 95.9% for AGIs $75k-100k, 96.2% for AGIs $100k-200k, 97.0% for AGIs over 200k)
Averages for the 2012 tax year for zip code 11215, filed in 2013:
Average Adjusted Gross Income (AGI) in 2012: $104,359 (Individual Income Tax Returns)
Here:
$104,359
State:
$77,088
Salary/wage: $91,511 (reported on 85.3% of returns)
Here:
$91,511
State:
$60,593
(% of AGI for various income ranges: 69.5% for AGIs below $25k, 84.0% for AGIs $25k-50k, 85.2% for AGIs $50k-75k, 83.0% for AGIs $75k-100k, 82.2% for AGIs $100k-200k, 67.0% for AGIs over 200k)
Taxable interest for individuals: $1,488 (reported on 44.4% of returns)
This zip code:
$1,488
New York:
$3,125
(% of AGI for various income ranges: 1.1% for AGIs below $25k, 0.5% for AGIs $25k-50k, 0.5% for AGIs $50k-75k, 0.5% for AGIs $75k-100k, 0.5% for AGIs $100k-200k, 0.7% for AGIs over 200k)
Ordinary dividends: $6,405 (reported on 31.5% of returns)
Here:
$6,405
State:
$10,299
(% of AGI for various income ranges: 2.7% for AGIs below $25k, 1.4% for AGIs $25k-50k, 1.5% for AGIs $50k-75k, 1.3% for AGIs $75k-100k, 1.7% for AGIs $100k-200k, 2.3% for AGIs over 200k)
Net capital gain/loss in AGI: +$18,625 (reported on 25.1% of returns)
Here:
+$18,625
State:
+$42,474
(% of AGI for various income ranges: 0.5% for AGIs below $25k, 0.4% for AGIs $25k-50k, 0.5% for AGIs $50k-75k, 0.9% for AGIs $75k-100k, 1.3% for AGIs $100k-200k, 8.1% for AGIs over 200k)
Profit/loss from business: +$23,226 (reported on 26.6% of returns)
Here:
+$23,226
State:
+$16,168
(% of AGI for various income ranges: 19.0% for AGIs below $25k, 7.4% for AGIs $25k-50k, 4.8% for AGIs $50k-75k, 5.7% for AGIs $75k-100k, 5.8% for AGIs $100k-200k, 5.3% for AGIs over 200k)
Taxable individual retirement arrangement distribution: $18,656 (reported on 5.9% of returns)
11215:
$18,656
New York:
$17,621
(% of AGI for various income ranges: 1.7% for AGIs below $25k, 1.0% for AGIs $25k-50k, 1.1% for AGIs $50k-75k, 1.2% for AGIs $75k-100k, 1.1% for AGIs $100k-200k, 1.0% for AGIs over 200k)
Self-employment retirement plans: $23,709 (reported on 3.0% of returns)
11215:
$23,709
New York:
$27,330
(% of AGI for various income ranges: 0.2% for AGIs $25k-50k, 0.2% for AGIs $50k-75k, 0.4% for AGIs $75k-100k, 0.6% for AGIs $100k-200k, 1.0% for AGIs over 200k)
Total itemized deductions: $33,811 (18% of AGI, reported on 46.3% of returns)
Here:
$33,811
State:
$34,985
Here:
18.5% of AGI
State:
21.3% of AGI
(% of AGI for various income ranges: 8.5% for AGIs below $25k, 7.3% for AGIs $25k-50k, 11.1% for AGIs $50k-75k, 14.5% for AGIs $75k-100k, 16.8% for AGIs $100k-200k, 16.6% for AGIs over 200k)
Charity contributions: $3,497 (reported on 38.3% of returns)
Here:
$3,497
State:
$5,572
(% of AGI for various income ranges: 0.5% for AGIs below $25k, 0.7% for AGIs $25k-50k, 1.1% for AGIs $50k-75k, 1.3% for AGIs $75k-100k, 1.3% for AGIs $100k-200k, 1.5% for AGIs over 200k)
Taxes paid: $20,564 (reported on 46.2% of returns)
11215:
$20,564
State:
$18,656
(% of AGI for various income ranges: 1.7% for AGIs below $25k, 2.3% for AGIs $25k-50k, 4.7% for AGIs $50k-75k, 7.6% for AGIs $75k-100k, 9.3% for AGIs $100k-200k, 11.6% for AGIs over 200k)
Earned income credit: $1,530 (reported on 8.0% of returns)
Here:
$1,530
State:
$2,230
(% of AGI for various income ranges: 3.3% for AGIs below $25k, 0.3% for AGIs $25k-50k)
Percentage of individuals using paid preparers for their 2012 taxes: 62.8%
Here:
63%
State:
66%
(% for various income ranges: 63.4% for AGIs below $25k, 56.3% for AGIs $25k-50k, 55.8% for AGIs $50k-75k, 61.0% for AGIs $75k-100k, 67.9% for AGIs $100k-200k, 77.4% for AGIs over 200k)
Averages for the 2004 tax year for zip code 11215, filed in 2005:
Average Adjusted Gross Income (AGI) in 2004: $66,296 (Individual Income Tax Returns)
Here:
$66,296
State:
$59,519
Salary/wage: $61,022 (reported on 84.8% of returns)
Here:
$61,022
State:
$50,673
(% of AGI for various income ranges: 114.1% for AGIs below $10k, 75.7% for AGIs $10k-25k, 89.3% for AGIs $25k-50k, 87.5% for AGIs $50k-75k, 85.9% for AGIs $75k-100k, 70.9% for AGIs over 100k)
Taxable interest for individuals: $1,323 (reported on 51.6% of returns)
This zip code:
$1,323
New York:
$2,377
(% of AGI for various income ranges: 7.9% for AGIs below $10k, 1.6% for AGIs $10k-25k, 0.9% for AGIs $25k-50k, 0.8% for AGIs $50k-75k, 0.8% for AGIs $75k-100k, 1.0% for AGIs over 100k)
Taxable dividends: $3,134 (reported on 31.0% of returns)
Here:
$3,134
State:
$5,394
(% of AGI for various income ranges: 9.1% for AGIs below $10k, 1.6% for AGIs $10k-25k, 1.0% for AGIs $25k-50k, 1.1% for AGIs $50k-75k, 1.2% for AGIs $75k-100k, 1.6% for AGIs over 100k)
Net capital gain/loss: +$13,010 (reported on 25.0% of returns)
Here:
+$13,010
State:
+$23,581
(% of AGI for various income ranges: -3.5% for AGIs below $10k, 0.4% for AGIs $10k-25k, 0.3% for AGIs $25k-50k, 0.6% for AGIs $50k-75k, 0.9% for AGIs $75k-100k, 8.5% for AGIs over 100k)
Profit/loss from business: +$13,736 (reported on 25.7% of returns)
Here:
+$13,736
State:
+$13,809
(% of AGI for various income ranges: 22.9% for AGIs below $10k, 12.6% for AGIs $10k-25k, 4.5% for AGIs $25k-50k, 4.3% for AGIs $50k-75k, 4.8% for AGIs $75k-100k, 5.0% for AGIs over 100k)
IRA payment deduction: $2,901 (reported on 3.8% of returns)
11215:
$2,901
New York:
$3,115
(% of AGI for various income ranges: 0.5% for AGIs below $10k, 0.4% for AGIs $10k-25k, 0.3% for AGIs $25k-50k, 0.2% for AGIs $50k-75k, 0.2% for AGIs $75k-100k, 0.1% for AGIs over 100k)
Self-employed pension: $15,670 (reported on 2.8% of returns)
Here:
$15,670
New York:
$19,016
(% of AGI for various income ranges: 0.3% for AGIs $10k-25k, 0.2% for AGIs $25k-50k, 0.3% for AGIs $50k-75k, 0.5% for AGIs $75k-100k, 1.0% for AGIs over 100k)
Total itemized deductions: $24,106 (20% of AGI, reported on 43.2% of returns)
Here:
$24,106
State:
$25,864
Here:
20.4% of AGI
State:
21.9% of AGI
(% of AGI for various income ranges: 13.5% for AGIs below $10k, 9.1% for AGIs $10k-25k, 11.3% for AGIs $25k-50k, 15.5% for AGIs $50k-75k, 17.6% for AGIs $75k-100k, 17.2% for AGIs over 100k)
Charity contributions deductions: $3,237 (3% of AGI, reported on 39.0% of returns)
Here:
$3,237
State:
$4,439
Here:
2.6% of AGI
State:
3.6% of AGI
(% of AGI for various income ranges: 0.6% for AGIs below $10k, 1.0% for AGIs $10k-25k, 1.6% for AGIs $25k-50k, 2.0% for AGIs $50k-75k, 1.9% for AGIs $75k-100k, 2.1% for AGIs over 100k)
Total tax: $12,773 (reported on 84.5% of returns)
11215:
$12,773
State:
$11,730
(% of AGI for various income ranges: 7.2% for AGIs below $10k, 6.0% for AGIs $10k-25k, 9.4% for AGIs $25k-50k, 12.5% for AGIs $50k-75k, 13.3% for AGIs $75k-100k, 20.7% for AGIs over 100k)
Earned income credit: $1,282 (reported on 10.0% of returns)
Here:
$1,282
State:
$1,757
Percentage of individuals using paid preparers for their 2004 taxes: 64.0%
Here:
64%
State:
67%
(% for various income ranges: 60.7% for AGIs below $10k, 61.9% for AGIs $10k-25k, 58.8% for AGIs $25k-50k, 63.6% for AGIs $50k-75k, 70.5% for AGIs $75k-100k, 75.8% for AGIs over 100k)
Likely homosexual households (counted as self-reported same-sex unmarried-partner households)
Lesbian couples: 0.5% of all households
Gay men: 0.8% of all households
Household received Food Stamps/SNAP in the past 12 months: 1,237 Household did not receive Food Stamps/SNAP in the past 12 months: 28,456
Women who had a birth in the past 12 months: 1,380 (1,214 now married, 152 unmarried) Women who did not have a birth in the past 12 months: 18,095 (8,514 now married, 9,486 unmarried)
Housing units in zip code 11215 with a mortgage: 7,934 (1,022 second mortgage, 13 home equity loan, 857 both second mortgage and home equity loan) Houses without a mortgage: 201
Median monthly owner costs for units with a mortgage: $3,860 Median monthly owner costs for units without a mortgage: $1,270
Residents with income below the poverty level in 2022:
This zip code:
6.3%
Whole state:
14.3%
Residents with income below 50% of the poverty level in 2022:
This zip code:
2.1%
Whole state:
6.8%
Median number of rooms in houses and condos:
Here:
5.2
State:
6.3
Median number of rooms in apartments:
Here:
3.8
State:
3.8
Notable locations in this zip code not listed on our city pages
Notable locations in zip code 11215: Park Slope Branch Brooklyn Public Library (A), Fire Department New York Engine 239 (B), Brooklyn Lyceum (C), Ansonia Court (D), Fire Department New York Engine 220 Ladder 122 (E), Fire Department New York Squad 1 (F). Display/hide their locations on the map
Churches in zip code 11215 include: Holy Family Roman Catholic Church (A), Church of Gethsemane (B), Holy Name Church (C), Park Slope Christian Fellowship Church (D), Memorial Baptist Church (E), Emmanuel Pentecostal Church (F), Saint John The Evangelist Church (G), Brooklyn Ethical Culture Society Meeting House (H), Congregation Beth Elohim (I). Display/hide their locations on the map
Parks in zip code 11215 include: Park Slope Historic District (1), James J Byrne Memorial Playground (2), Under The Tracks Playground (3), Ennis Park (4), Garden of Union (5), Terrapin Playground (6), Detective Joseph Mayrose Park (7), Slope Park (8). Display/hide their locations on the map
Tourist attractions (not listed on the city page) : Cherry Tours Inc (35 2nd Avenue), Ambratour Travel (Tours & Charters; 173 6th Street Suite 101).
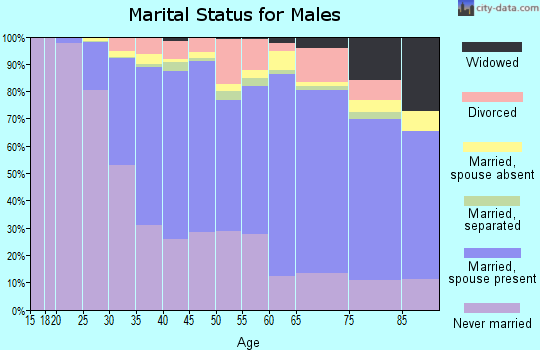
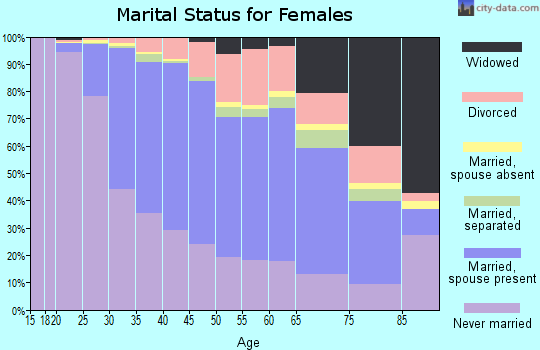
12,496 married couples with children.
2,077 single-parent households (573 men, 1,504 women).
75.3% of residents of 11215 zip code speak English at home.
9.3% of residents speak Spanish at home (65% very well, 18% well, 11% not well, 5% not at all).
9.3% of residents speak other Indo-European language at home (89% very well, 10% well, 2% not well).
4.6% of residents speak Asian or Pacific Island language at home (68% very well, 19% well, 11% not well, 2% not at all).
1.0% of residents speak other language at home (90% very well, 8% well, 3% not well).
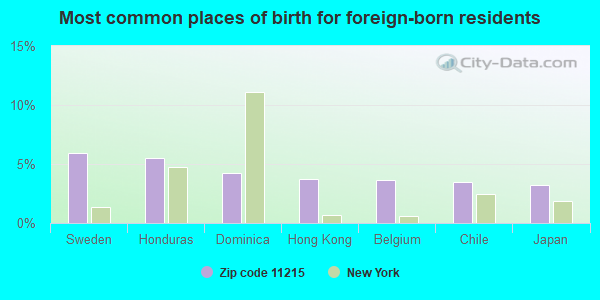
Foreign born population: 13,284 (18.7%) (58.4% of them are naturalized citizens)
This zip code:
18.7%
Whole state:
22.7%
6%Sweden
5%Honduras
4%Dominica
4%Hong Kong
4%Belgium
4%Chile
3%Japan
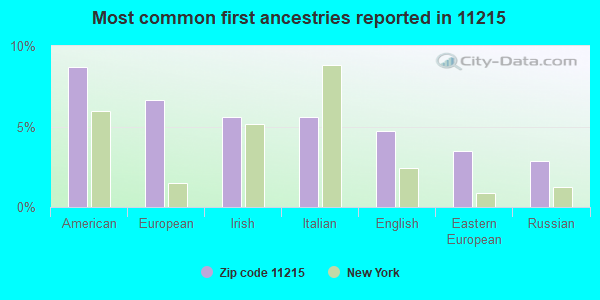
9%American
7%European
6%Irish
6%Italian
5%English
3%Eastern European
3%Russian
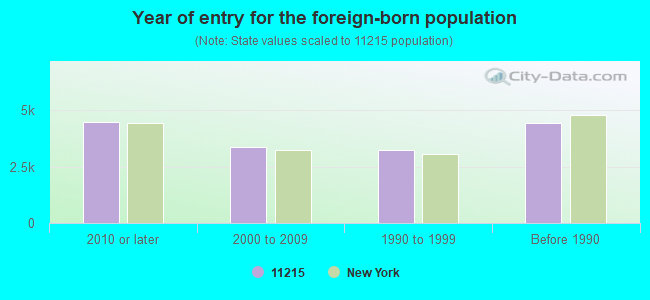
Year of entry for the foreign-born population
4,4752010 or later
3,3842000 to 2009
3,2441990 to 1999
4,463Before 1990
Major facilities with environmental interests located in this zip code:
6TH AVE RANDEX CLEANERS (365 6TH AVENUE in BROOKLYN, NY)
AIR MINOR (AIRS/AFS) STATE MASTER (New York facility tracking) - AIR PROGRAM Small Quantity Generators, between 100 kg and 1000 kg of hazardous waste/month (Resource Conservation and Recovery Act (tracking hazardous waste)) Business SIC classification: DRYCLEANING PLANTS, EXCEPT RUG CLEANING Business NAICS classification: DRYCLEANING AND LAUNDRY SERVICES (EXCEPT COIN-OPERATED). Organizations: RANDEX DRY CLEANERS (LEGALLY RESPONSIBLE PARTY)
Alternative names: 365 6TH AVEnue randex cleaners
ADEL ROOTSTEIN USA INC (145 18TH ST in BROOKLYN, NY)
STATE MASTER (New York facility tracking) - AIR PROGRAM, (Resource Conservation and Recovery Act (tracking hazardous waste)) Organizations: ADELE ROOTSTEIN (CONTACT/OPERATOR)
Alternative names: ADELE ROOTSTEIN USA INC
15TH ST AUTO BODY (28 15TH ST in BROOKLYN, NY)
STATE MASTER (New York facility tracking) - AIR PROGRAM, HAZARDOUS WASTE PROGRAM Small Quantity Generators, between 100 kg and 1000 kg of hazardous waste/month (Resource Conservation and Recovery Act (tracking hazardous waste)) - notification Organizations: JOE AMATO (CONTACT/OWNER)
, 15TH STREET AUTO BODY INC (LEGALLY RESPONSIBLE PARTY)
Alternative names: 15TH STREET AUTO BODY INC
ART LINE FURNITURE (58 SECOND AVE in BROOKLYN, NY)
AIR SYNTHETIC MINOR (AIRS/AFS) STATE MASTER (New York facility tracking) - AIR PROGRAM Business SIC classification: WOOD KITCHEN CABINETS Business NAICS classification: WOOD KITCHEN CABINET AND COUNTERTOP MANUFACTURING. Organizations: ART LINE FURNITURES (LEGALLY RESPONSIBLE PARTY)
ASBESTOS PROS, INC (397 5TH AVE in BROOKLYN, NY)
(Integrated Compliance Information System) - ICIS-02-1995-0069, FORMAL ENFORCEMENT ACTION COMPLIANCE ACTIVITY (Tracking inspections of insecticide, fungicide, and rodenticide, and toxic substances) Alternative names: ASBESTOS PROS, INC (WITHDRAWN)
BETH RIVKAH SCHOOL BOT (310 CROWN ST in BROOKLYN, NY)
(Integrated Compliance Information System) - ICIS-02-1987-0495, FORMAL ENFORCEMENT ACTION
CHOICE TRANSP CO. (400 15TH ST in BROOKLYN, NY)
(Integrated Compliance Information System) - ICIS-HQ-1997-0330, FORMAL ENFORCEMENT ACTION Business SIC classification: LOCAL TRUCKING WITHOUT STORAGE; GASOLINE SERVICE STATIONS; AUTOMOTIVE SERVICES, EXCEPT REPAIR AND CARWASHES
CON EDISON - 3RD AVE (222 FIRST STREET in BROOKLYN, NY)
COMPLIANCE ACTIVITY (Tracking inspections of insecticide, fungicide, and rodenticide, and toxic substances) HAZARDOUS WASTE BIENNIAL REPORTER (Resource Conservation and Recovery Act (tracking hazardous waste)) Large Quantity Generators, more that 1000 kg of hazardous waste/month (Resource Conservation and Recovery Act (tracking hazardous waste)) - notification Business SIC classification: ELECTRIC SERVICES Business NAICS classification: ELECTRIC POWER DISTRIBUTION. Organizations: CONSOLIDATED EDISON COMPANY OF NY, INC. (CONTACT/OPERATOR)
Alternative names: CON EDISON - THIRD AVENUE SERVICE YARD, CONSOLIDATED EDISON CO OF NEW YORK, INC
GETTY-524 CONEY ISL AVE (524 CONEY ISLAND AVE in BROOKLYN, NY)
AIR MINOR (AIRS/AFS) (Resource Conservation and Recovery Act (tracking hazardous waste)) Business SIC classification: GASOLINE SERVICE STATIONS Alternative names: GETTY (POWER TEST), POWER TEST
CON EDISON - VS 2314 (93 HOPKINS ST in BROOKLYN, NY)
Large Quantity Generators, more that 1000 kg of hazardous waste/month (Resource Conservation and Recovery Act (tracking hazardous waste)) Organizations: CONSOLIDATED EDISON COMPANY OF NY, INC. (CONTACT/OPERATOR)
CON EDISON - VS 2381 (53 ST & 1 ST AVE in BROOKLYN, NY)
Large Quantity Generators, more that 1000 kg of hazardous waste/month (Resource Conservation and Recovery Act (tracking hazardous waste)) Organizations: CONSOLIDATED EDISON COMPANY OF NY, INC. (CONTACT/OPERATOR)
CON EDISON - VS 5212 (8TH AVE AND 3RD ST. in BROOKLYN, NY)
Large Quantity Generators, more that 1000 kg of hazardous waste/month (Resource Conservation and Recovery Act (tracking hazardous waste)) Organizations: CONSOLIDATED EDISON COMPANY OF NY, INC. (CONTACT/OPERATOR)
CON EDISON - VS 6524 (18 ST. 272` W/O HAMILTON AV. in BROOKLYN, NY)
Large Quantity Generators, more that 1000 kg of hazardous waste/month (Resource Conservation and Recovery Act (tracking hazardous waste)) Organizations: CONSOLIDATED EDISON COMPANY OF NY, INC. (CONTACT/OPERATOR)
Housing units lacking complete plumbing facilities: 0.2% Housing units lacking complete kitchen facilities: 0.6%
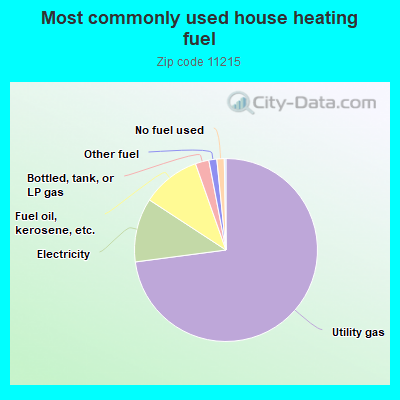
73.0%Utility gas
11.3%Electricity
10.4%Fuel oil, kerosene, etc.
2.4%Bottled, tank, or LP gas
1.4%Other fuel
1.3%No fuel used
Population in 1990: 63,338.
Place of birth for U.S.-born residents:
This state: 32,216
Northeast: 8,491
Midwest: 5,093
South: 5,693
West: 4,169
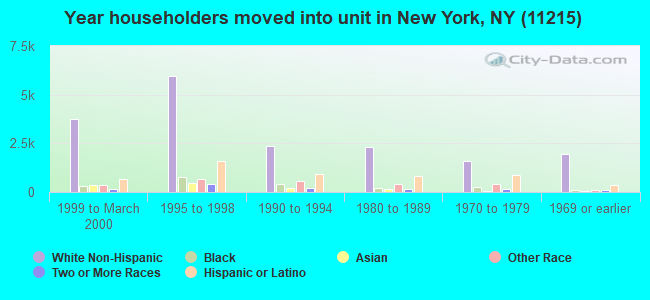
58% of the 11215 zip code residents lived in the same house 5 years ago. Out of people who lived in different houses, 45% lived in this county. Out of people who lived in different counties, 50% lived in New York.
85% of the 11215 zip code residents lived in the same house 1 year ago. Out of people who lived in different houses, 54% moved from this county. Out of people who lived in different houses, 23% moved from different county within same state. Out of people who lived in different houses, 19% moved from different state. Out of people who lived in different houses, 5% moved from abroad.
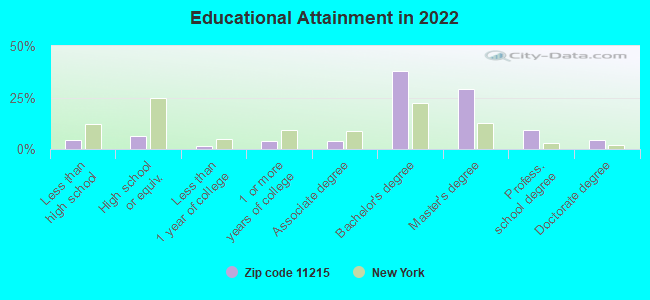
Private vs. public school enrollment:
Students in private schools in grades 1 to 8 (elementary and middle school): 1,468
Here:
21.5%
New York:
15.6%
Students in private schools in grades 9 to 12 (high school): 580
Here:
25.0%
New York:
15.0%
Students in private undergraduate colleges: 431
Here:
32.7%
New York:
39.2%
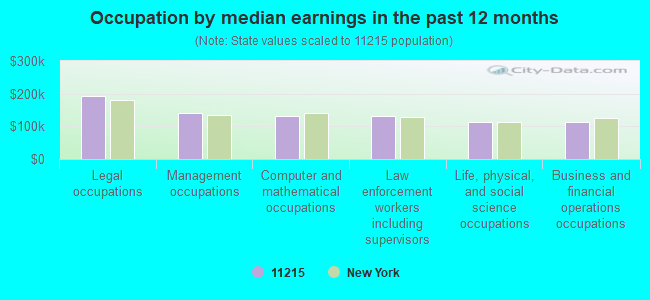
Occupation by median earnings in the past 12 months ($)
192,566Legal occupations
139,729Management occupations
132,508Computer and mathematical occupations
130,179Law enforcement workers including supervisors
114,348Life, physical, and social science occupations
113,878Business and financial operations occupations
Companies with federal contracts located in this zip code (BROOKLYN, NY):
HERCULES CONSTRUCTION CORP. (237 4TH AVENUE)
$417,500 with Army for Construction of Structures and Facilities -- Office Buildings. Taking place in NJ. Signed on 2000-08-18. Completion date: 2000-08-18.
SITE WARE TECHNOLOGIES, INC. (439 10TH STREET; small business)
$373,575 with Army for Other Research and Development -- Basic Research (R&D). Signed on 2000-04-05. Completion date: 2001-04-11.
PARK SLOPE COMPUTER EDUCATION (259 12TH STREET; small business) : $70,714 in 2 contractsfrom 1999 to 2000
$35,495 with Army for Training/Curriculum Development. Signed on 2000-03-24. Completion date: 2000-09-30.
$35,219 with Army for Other Education and Training Services. Signed on 1999-11-16. Completion date: 2000-03-31.
MATHEMATICUS LABORATORIES LLC (390 TENTH ST; small business)
$69,997 with Navy for Other Research and Development -- Basic Research (R&D). Signed on 2003-06-30. Completion date: 2003-12-30.
STIVITTS, PAUL (468 B 17TH ST; small business) : $11,100 in 2 contractsin 2004
$6,000 with Army for Musical Instrument Parts and Accessories. Taking place in MD. Signed on 2004-05-07. Completion date: 2004-07-15.
$5,100, same as above.Signed on 2004-11-04. Completion date: 2004-11-20.
Top industries in this zip code by the number of employees in 2005:
Health Care and Social Assistance: General Medical and Surgical Hospitals (over 1000 employees: 1 establishment)
Utilities: Electric Power Distribution (500-999: 1)
2007 - 2018 National Fire Incident Reporting System (NFIRS) incidents
According to the data from the years 2007 - 2018 the average number of fire incidents per year is 236. The highest number of reported fire incidents - 295 took place in 2010, and the least - 188 in 2012. The data has a declining trend.
When looking into fire subcategories, the most reports belonged to: Structure Fires (66.2%), and Outside Fires (23.4%).
Fire incident types reported to NFIRS in Zip Code 11215


 Nearest zip codes: 11217, 11232, 11218, 11231, 11238, 11201.


 According to the data from the years 2007 - 2018 the average number of fire incidents per year is 236. The highest number of reported fire incidents - 295 took place in 2010, and the least - 188 in 2012. The data has a declining trend.
 When looking into fire subcategories, the most reports belonged to: Structure Fires (66.2%), and Outside Fires (23.4%).