Estimated zip code population in 2022: 42,362 Zip code population in 2010: 35,881 Zip code population in 2000: 35,353
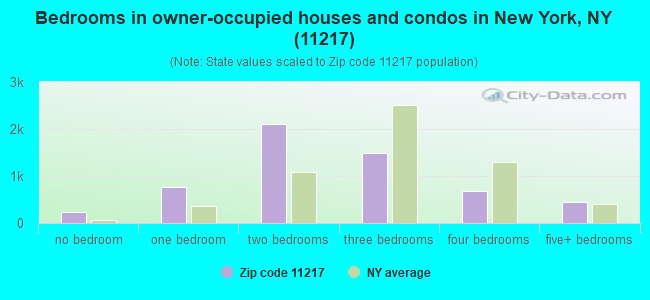
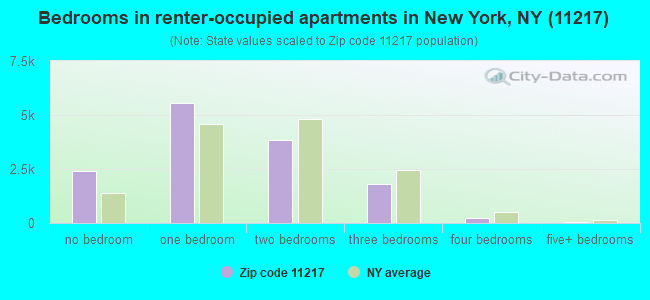
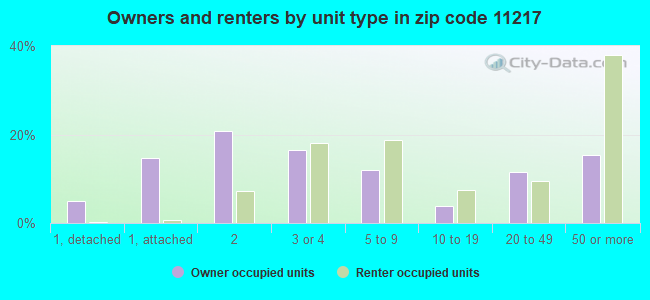
Houses and condos: 21,132 Renter-occupied apartments: 13,710
% of renters here:
71%
State:
46%
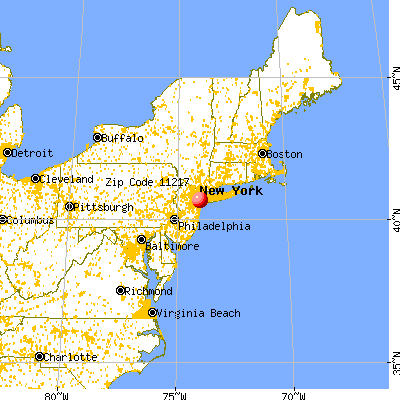
March 2022 cost of living index in zip code 11217: 157.5 (very high, U.S. average is 100)
Land area: 0.8 sq. mi. Water area: 0.0 sq. mi.
Population density: 56,429 people per square mile
(very high).
OSM Map
General Map
Google Map
MSN Map
OSM Map
General Map
Google Map
MSN Map
OSM Map
General Map
Google Map
MSN Map
OSM Map
General Map
Google Map
MSN Map
Please wait while loading the map...
Real estate property taxes paid for housing units in 2022:
This zip code:
0.4% ($6,587)
New York:
1.5% ($6,180)
Median real estate property taxes paid for housing units with mortgages in 2022: $6,716 (0.4%) Median real estate property taxes paid for housing units with no mortgage in 2022: $6,319 (0.4%)
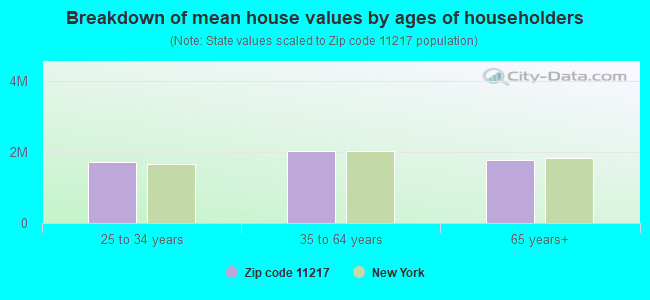
Estimated median house/condo value in 2022: $1,671,339
11217:
$1,671,339
New York:
$400,400
According to our research of New York and other state lists, there were 17 registered sex offenders living in 11217 zip code as of April 27, 2024. The ratio of all residents to sex offenders in zip code 11217 is 2,307 to 1. The ratio of registered sex offenders to all residents in this zip code is lower than the state average.
Median resident age:
This zip code:
36.4 years
New York median age:
40.0 years
Average household size:
This zip code:
2.1 people
New York:
2.5 people
Averages for the 2020 tax year for zip code 11217, filed in 2021:
Average Adjusted Gross Income (AGI) in 2020: $160,636 (Individual Income Tax Returns)
Here:
$160,636
State:
$90,930
Salary/wage: $134,520 (reported on 85.5% of returns)
Here:
$134,520
State:
$72,104
(% of AGI for various income ranges: 980.8% for AGIs below $25k, 3608.0% for AGIs $25k-50k, 7041.0% for AGIs $50k-75k, 11227.2% for AGIs $75k-100k, 20881.0% for AGIs $100k-200k, 146956.5% for AGIs over 200k)
Taxable interest for individuals: $1,767 (reported on 40.4% of returns)
This zip code:
$1,767
New York:
$3,075
(% of AGI for various income ranges: 13.9% for AGIs below $25k, 13.4% for AGIs $25k-50k, 25.4% for AGIs $50k-75k, 38.6% for AGIs $75k-100k, 91.3% for AGIs $100k-200k, 1091.9% for AGIs over 200k)
Ordinary dividends: $9,524 (reported on 37.1% of returns)
Here:
$9,524
State:
$11,095
(% of AGI for various income ranges: 44.0% for AGIs below $25k, 62.4% for AGIs $25k-50k, 90.0% for AGIs $50k-75k, 208.6% for AGIs $75k-100k, 446.1% for AGIs $100k-200k, 5563.1% for AGIs over 200k)
Net capital gain/loss in AGI: +$49,565 (reported on 34.5% of returns)
Here:
+$49,565
State:
+$44,925
(% of AGI for various income ranges: 28.4% for AGIs below $25k, 68.4% for AGIs $25k-50k, 122.3% for AGIs $50k-75k, 230.6% for AGIs $75k-100k, 560.3% for AGIs $100k-200k, 33776.6% for AGIs over 200k)
Profit/loss from business: +$27,856 (reported on 21.7% of returns)
Here:
+$27,856
State:
+$14,940
(% of AGI for various income ranges: 194.9% for AGIs below $25k, 263.2% for AGIs $25k-50k, 378.4% for AGIs $50k-75k, 527.0% for AGIs $75k-100k, 1043.8% for AGIs $100k-200k, 7310.6% for AGIs over 200k)
Taxable individual retirement arrangement distribution: $20,628 (reported on 4.7% of returns)
11217:
$20,628
New York:
$19,609
(% of AGI for various income ranges: 22.7% for AGIs below $25k, 42.5% for AGIs $25k-50k, 78.8% for AGIs $50k-75k, 119.0% for AGIs $75k-100k, 291.3% for AGIs $100k-200k, 807.8% for AGIs over 200k)
Self-employed (Keogh) retirement plans: $31,912 (reported on 2.9% of returns)
11217:
$31,912
New York:
$32,497
(% of AGI for various income ranges: 17.5% for AGIs $25k-50k, 27.3% for AGIs $50k-75k, 29.5% for AGIs $75k-100k, 114.5% for AGIs $100k-200k, 1525.9% for AGIs over 200k)
Total itemized deductions: $40,350 (reported on 14.3% of returns)
Here:
$40,350
State:
$39,326
(% of AGI for various income ranges: 73.5% for AGIs below $25k, 139.8% for AGIs $25k-50k, 190.0% for AGIs $50k-75k, 386.7% for AGIs $75k-100k, 877.4% for AGIs $100k-200k, 8404.2% for AGIs over 200k)
Charity contributions: $16,546 (reported on 12.3% of returns)
Here:
$16,546
State:
$15,420
(% of AGI for various income ranges: 3.2% for AGIs below $25k, 17.5% for AGIs $25k-50k, 28.7% for AGIs $50k-75k, 62.0% for AGIs $75k-100k, 158.0% for AGIs $100k-200k, 3694.2% for AGIs over 200k)
Taxes paid: $9,278 (reported on 14.2% of returns)
11217:
$9,278
State:
$9,183
(% of AGI for various income ranges: 14.4% for AGIs below $25k, 37.1% for AGIs $25k-50k, 56.4% for AGIs $50k-75k, 141.6% for AGIs $75k-100k, 315.5% for AGIs $100k-200k, 1534.3% for AGIs over 200k)
Earned income credit: $1,774 (reported on 9.2% of returns)
Here:
$1,774
State:
$2,138
(% of AGI for various income ranges: 80.5% for AGIs below $25k, 44.1% for AGIs $25k-50k)
Percentage of individuals using paid preparers for their 2020 taxes: 95.7%
Here:
96%
State:
95%
(% for various income ranges: 93.5% for AGIs below $25k, 94.1% for AGIs $25k-50k, 95.6% for AGIs $50k-75k, 96.9% for AGIs $75k-100k, 96.7% for AGIs $100k-200k, 97.8% for AGIs over 200k)
Averages for the 2012 tax year for zip code 11217, filed in 2013:
Average Adjusted Gross Income (AGI) in 2012: $102,611 (Individual Income Tax Returns)
Here:
$102,611
State:
$77,088
Salary/wage: $86,378 (reported on 86.1% of returns)
Here:
$86,378
State:
$60,593
(% of AGI for various income ranges: 68.2% for AGIs below $25k, 85.0% for AGIs $25k-50k, 87.0% for AGIs $50k-75k, 85.0% for AGIs $75k-100k, 82.3% for AGIs $100k-200k, 61.8% for AGIs over 200k)
Taxable interest for individuals: $1,618 (reported on 39.9% of returns)
This zip code:
$1,618
New York:
$3,125
(% of AGI for various income ranges: 0.7% for AGIs below $25k, 0.3% for AGIs $25k-50k, 0.4% for AGIs $50k-75k, 0.4% for AGIs $75k-100k, 0.5% for AGIs $100k-200k, 0.8% for AGIs over 200k)
Ordinary dividends: $6,989 (reported on 28.3% of returns)
Here:
$6,989
State:
$10,299
(% of AGI for various income ranges: 2.3% for AGIs below $25k, 1.1% for AGIs $25k-50k, 1.3% for AGIs $50k-75k, 1.3% for AGIs $75k-100k, 1.8% for AGIs $100k-200k, 2.3% for AGIs over 200k)
Net capital gain/loss in AGI: +$27,837 (reported on 22.7% of returns)
Here:
+$27,837
State:
+$42,474
(% of AGI for various income ranges: 0.5% for AGIs $25k-50k, 0.2% for AGIs $50k-75k, 0.9% for AGIs $75k-100k, 1.5% for AGIs $100k-200k, 11.4% for AGIs over 200k)
Profit/loss from business: +$20,185 (reported on 25.6% of returns)
Here:
+$20,185
State:
+$16,168
(% of AGI for various income ranges: 18.3% for AGIs below $25k, 7.1% for AGIs $25k-50k, 4.6% for AGIs $50k-75k, 5.3% for AGIs $75k-100k, 5.5% for AGIs $100k-200k, 3.7% for AGIs over 200k)
Taxable individual retirement arrangement distribution: $18,830 (reported on 4.7% of returns)
11217:
$18,830
New York:
$17,621
(% of AGI for various income ranges: 1.4% for AGIs below $25k, 0.8% for AGIs $25k-50k, 0.6% for AGIs $50k-75k, 1.0% for AGIs $75k-100k, 1.0% for AGIs $100k-200k, 0.8% for AGIs over 200k)
Self-employment retirement plans: $22,172 (reported on 2.5% of returns)
11217:
$22,172
New York:
$27,330
(% of AGI for various income ranges: 0.4% for AGIs $25k-50k, 0.3% for AGIs $50k-75k, 0.3% for AGIs $75k-100k, 0.5% for AGIs $100k-200k, 0.7% for AGIs over 200k)
Total itemized deductions: $32,047 (17% of AGI, reported on 45.3% of returns)
Here:
$32,047
State:
$34,985
Here:
17.2% of AGI
State:
21.3% of AGI
(% of AGI for various income ranges: 7.9% for AGIs below $25k, 8.0% for AGIs $25k-50k, 11.2% for AGIs $50k-75k, 14.2% for AGIs $75k-100k, 15.9% for AGIs $100k-200k, 15.4% for AGIs over 200k)
Charity contributions: $3,423 (reported on 36.3% of returns)
Here:
$3,423
State:
$5,572
(% of AGI for various income ranges: 0.6% for AGIs below $25k, 1.0% for AGIs $25k-50k, 1.2% for AGIs $50k-75k, 1.3% for AGIs $75k-100k, 1.3% for AGIs $100k-200k, 1.2% for AGIs over 200k)
Taxes paid: $20,021 (reported on 45.2% of returns)
11217:
$20,021
State:
$18,656
(% of AGI for various income ranges: 1.8% for AGIs below $25k, 2.4% for AGIs $25k-50k, 5.2% for AGIs $50k-75k, 7.8% for AGIs $75k-100k, 9.5% for AGIs $100k-200k, 10.9% for AGIs over 200k)
Earned income credit: $1,793 (reported on 13.2% of returns)
Here:
$1,793
State:
$2,230
(% of AGI for various income ranges: 6.0% for AGIs below $25k, 0.5% for AGIs $25k-50k)
Percentage of individuals using paid preparers for their 2012 taxes: 58.5%
Here:
59%
State:
66%
(% for various income ranges: 56.7% for AGIs below $25k, 53.5% for AGIs $25k-50k, 52.5% for AGIs $50k-75k, 56.3% for AGIs $75k-100k, 65.0% for AGIs $100k-200k, 76.8% for AGIs over 200k)
Averages for the 2004 tax year for zip code 11217, filed in 2005:
Average Adjusted Gross Income (AGI) in 2004: $56,659 (Individual Income Tax Returns)
Here:
$56,659
State:
$59,519
Salary/wage: $52,701 (reported on 86.6% of returns)
Here:
$52,701
State:
$50,673
(% of AGI for various income ranges: 123.9% for AGIs below $10k, 80.4% for AGIs $10k-25k, 91.6% for AGIs $25k-50k, 88.0% for AGIs $50k-75k, 87.7% for AGIs $75k-100k, 71.5% for AGIs over 100k)
Taxable interest for individuals: $1,016 (reported on 43.6% of returns)
This zip code:
$1,016
New York:
$2,377
(% of AGI for various income ranges: 6.1% for AGIs below $10k, 0.9% for AGIs $10k-25k, 0.5% for AGIs $25k-50k, 0.6% for AGIs $50k-75k, 0.6% for AGIs $75k-100k, 0.8% for AGIs over 100k)
Taxable dividends: $3,032 (reported on 26.1% of returns)
Here:
$3,032
State:
$5,394
(% of AGI for various income ranges: 6.9% for AGIs below $10k, 1.1% for AGIs $10k-25k, 0.7% for AGIs $25k-50k, 1.2% for AGIs $50k-75k, 1.1% for AGIs $75k-100k, 1.7% for AGIs over 100k)
Net capital gain/loss: +$12,540 (reported on 20.5% of returns)
Here:
+$12,540
State:
+$23,581
(% of AGI for various income ranges: 1.8% for AGIs below $10k, 0.1% for AGIs $10k-25k, 0.3% for AGIs $25k-50k, 0.5% for AGIs $50k-75k, 0.7% for AGIs $75k-100k, 9.0% for AGIs over 100k)
Profit/loss from business: +$11,178 (reported on 25.2% of returns)
Here:
+$11,178
State:
+$13,809
(% of AGI for various income ranges: 25.6% for AGIs below $10k, 10.9% for AGIs $10k-25k, 4.1% for AGIs $25k-50k, 4.7% for AGIs $50k-75k, 4.0% for AGIs $75k-100k, 4.4% for AGIs over 100k)
IRA payment deduction: $2,535 (reported on 3.2% of returns)
11217:
$2,535
New York:
$3,115
(% of AGI for various income ranges: 0.7% for AGIs below $10k, 0.3% for AGIs $10k-25k, 0.2% for AGIs $25k-50k, 0.2% for AGIs $50k-75k, 0.2% for AGIs $75k-100k, 0.1% for AGIs over 100k)
Self-employed pension: $14,904 (reported on 2.3% of returns)
Here:
$14,904
New York:
$19,016
(% of AGI for various income ranges: 0.2% for AGIs $10k-25k, 0.2% for AGIs $25k-50k, 0.3% for AGIs $50k-75k, 0.3% for AGIs $75k-100k, 1.0% for AGIs over 100k)
Total itemized deductions: $22,030 (21% of AGI, reported on 40.4% of returns)
Here:
$22,030
State:
$25,864
Here:
21.3% of AGI
State:
21.9% of AGI
(% of AGI for various income ranges: 16.0% for AGIs below $10k, 8.2% for AGIs $10k-25k, 11.7% for AGIs $25k-50k, 15.9% for AGIs $50k-75k, 18.0% for AGIs $75k-100k, 17.7% for AGIs over 100k)
Charity contributions deductions: $3,188 (3% of AGI, reported on 36.1% of returns)
Here:
$3,188
State:
$4,439
Here:
3.0% of AGI
State:
3.6% of AGI
(% of AGI for various income ranges: 1.0% for AGIs below $10k, 1.1% for AGIs $10k-25k, 1.9% for AGIs $25k-50k, 2.2% for AGIs $50k-75k, 2.1% for AGIs $75k-100k, 2.2% for AGIs over 100k)
Total tax: $10,627 (reported on 81.6% of returns)
11217:
$10,627
State:
$11,730
(% of AGI for various income ranges: 7.4% for AGIs below $10k, 5.4% for AGIs $10k-25k, 9.0% for AGIs $25k-50k, 12.9% for AGIs $50k-75k, 13.8% for AGIs $75k-100k, 20.3% for AGIs over 100k)
Earned income credit: $1,471 (reported on 15.2% of returns)
Here:
$1,471
State:
$1,757
Percentage of individuals using paid preparers for their 2004 taxes: 62.6%
Here:
63%
State:
67%
(% for various income ranges: 58.6% for AGIs below $10k, 62.2% for AGIs $10k-25k, 58.7% for AGIs $25k-50k, 61.8% for AGIs $50k-75k, 67.3% for AGIs $75k-100k, 76.0% for AGIs over 100k)
Likely homosexual households (counted as self-reported same-sex unmarried-partner households)
Lesbian couples: 0.6% of all households
Gay men: 0.7% of all households
Household received Food Stamps/SNAP in the past 12 months: 2,134 Household did not receive Food Stamps/SNAP in the past 12 months: 17,081
Women who had a birth in the past 12 months: 626 (575 now married, 43 unmarried) Women who did not have a birth in the past 12 months: 12,508 (4,121 now married, 8,407 unmarried)
Housing units in zip code 11217 with a mortgage: 3,866 (376 second mortgage, 58 home equity loan, 287 both second mortgage and home equity loan) Houses without a mortgage: 168
Median monthly owner costs for units with a mortgage: $3,860 Median monthly owner costs for units without a mortgage: $1,141
Residents with income below the poverty level in 2022:
This zip code:
11.6%
Whole state:
14.3%
Residents with income below 50% of the poverty level in 2022:
This zip code:
5.3%
Whole state:
6.8%
Median number of rooms in houses and condos:
Here:
4.9
State:
6.3
Median number of rooms in apartments:
Here:
3.1
State:
3.8
Notable locations in this zip code not listed on our city pages
Notable locations in zip code 11217: Times Plaza (A), Flatbush Avenue Terminal (B), Temple Square (C), Fire Department New York City Engine 219 Ladder 105 (D), New York Ladder Company 105 (E), Fire Department New York Engine 226 (F), Pacific Branch Brooklyn Public Library (G), Brooklyn Academy of Music (H), Oxford Nursing Home (I), Montauk Club (J), Cathedral Club of Brooklyn (K), Seventyeighth Precinct Police Station (L). Display/hide their locations on the map
Churches in zip code 11217 include: Iglesia Universal Del Reino De Dios (A), Saint Augustine's Roman Catholic Church (B), Sixth Avenue Baptist Church (C), Saint John's Episcopal Church (D), Grace United Methodist Church (E), Memorial Presbyterian Church (F), Lafayette Avenue Presbyterian Church (G), Hanson Place Seventh Day Adventist Church (H), Baptist Temple (I). Display/hide their locations on the map
Parks in zip code 11217 include: Cuyler Park (1), Boerum Hill Historic District (2), Brooklyn Academy of Music Historic District (3), Gowanus Playground (4), Thomas Greene Playground (5), Park Slope Playground (6), Dean Playground (7), Brooklyn Bears Rockwell Plaza Garden (8), Sixteen Sycamores Playground (9). Display/hide their locations on the map
Tourist attractions (not listed on the city page) : Brooklyn Community Access (Museums; 57 Rockwell Place), GORP (Recreation Areas; 234 Berkeley Place), E2 Marketing & Communications (232 Dean Street).
5,057 married couples with children.
1,869 single-parent households (483 men, 1,386 women).
74.3% of residents of 11217 zip code speak English at home.
11.8% of residents speak Spanish at home (59% very well, 17% well, 16% not well, 8% not at all).
7.5% of residents speak other Indo-European language at home (85% very well, 12% well, 4% not well).
4.0% of residents speak Asian or Pacific Island language at home (77% very well, 10% well, 11% not well, 3% not at all).
2.0% of residents speak other language at home (87% very well, 5% well, 6% not well, 2% not at all).
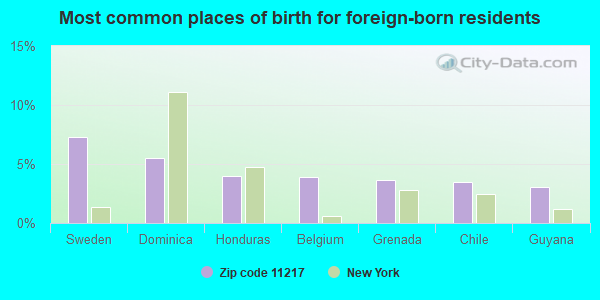
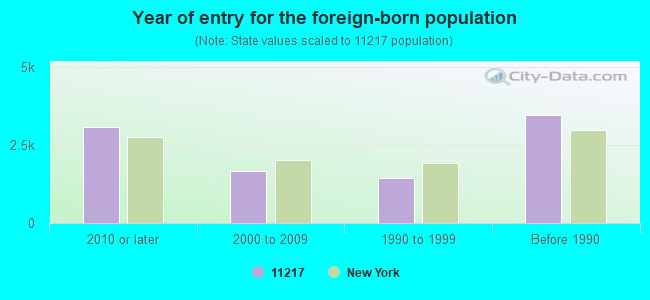
Foreign born population: 8,195 (19.3%) (57.6% of them are naturalized citizens)
This zip code:
19.3%
Whole state:
22.7%
7%Sweden
6%Dominica
4%Honduras
4%Belgium
4%Grenada
3%Chile
3%Guyana
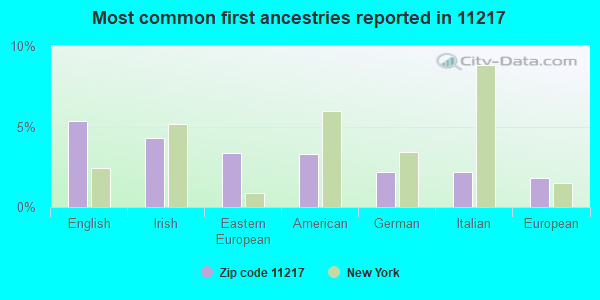
5%English
4%Irish
3%Eastern European
3%American
2%German
2%Italian
2%European
Year of entry for the foreign-born population
3,0962010 or later
1,6832000 to 2009
1,4281990 to 1999
3,465Before 1990
Major facilities with environmental interests located in this zip code:
CROSS BAY CONTRACTING-NEVINS ST FACILITY (242 NEVINS STREET in BROOKLYN, NY)
STATE MASTER (New York facility tracking) - SECTION 404 PERMITTING, SOLID WASTE PROGRAM (Integrated Compliance Information System) - ICIS-02-1989-0301, FORMAL ENFORCEMENT ACTION, ICIS-02-1996-0138, (Resource Conservation and Recovery Act (tracking hazardous waste)) Organizations: CROSS BAY CONTRACTING CORP (LEGALLY RESPONSIBLE PARTY)
Alternative names: CROSSBAY BAY CONTRACTING
CINDERELLA CLEANERS (248 FLATBUSH AVE. in BROOKLYN, NY)
AIR MINOR (AIRS/AFS) STATE MASTER (New York facility tracking) - AIR PROGRAM, HAZARDOUS WASTE PROGRAM (Resource Conservation and Recovery Act (tracking hazardous waste)) Business SIC classification: DRYCLEANING PLANTS, EXCEPT RUG CLEANING Business NAICS classification: DRYCLEANING AND LAUNDRY SERVICES (EXCEPT COIN-OPERATED). Organizations: CINDERELLA CLEANERS INC (LEGALLY RESPONSIBLE PARTY)
HUDSON CLEANERS (369 7TH AVENUE in BROOKLYN, NY)
AIR MINOR (AIRS/AFS) STATE MASTER (New York facility tracking) - AIR PROGRAM, HAZARDOUS WASTE PROGRAM Small Quantity Generators, between 100 kg and 1000 kg of hazardous waste/month (Resource Conservation and Recovery Act (tracking hazardous waste)) Business SIC classification: DRYCLEANING PLANTS, EXCEPT RUG CLEANING Business NAICS classification: DRYCLEANING AND LAUNDRY SERVICES (EXCEPT COIN-OPERATED). Organizations: HUDSON CLEANERS INC (LEGALLY RESPONSIBLE PARTY)
, HUDSON K Y C CLEANERS INC (LEGALLY RESPONSIBLE PARTY)
CRISTALLO DRY CLEANERS (64 FOURTH AVENUE in BROOKLYN, NY)
AIR MINOR (AIRS/AFS) STATE MASTER (New York facility tracking) - AIR PROGRAM, HAZARDOUS WASTE PROGRAM (Resource Conservation and Recovery Act (tracking hazardous waste)) Business SIC classification: DRYCLEANING PLANTS, EXCEPT RUG CLEANING Business NAICS classification: DRYCLEANING AND LAUNDRY SERVICES (EXCEPT COIN-OPERATED). Alternative names: CRISTALLO CLEANERS
GLOBAL EXHIBITION SERVICE (700 ATLANTIC AVENUE in BROOKLYN, NY)
AIR MINOR (AIRS/AFS) STATE MASTER (New York facility tracking) - AIR PROGRAM, Business SIC classification: WOOD PRODUCTS; OPERATORS OF APARTMENT BUILDINGS Organizations: GLOBAL EXHIBITION SERVICES INC (LEGALLY RESPONSIBLE PARTY)
ADMIRAL METALS FORMERLY T E CONKLIN (270 NEVINS ST. in BROOKLYN, NY)
(Integrated Compliance Information System) - ICIS-02-1989-0154, FORMAL ENFORCEMENT ACTION Alternative names: TE CONKLIN BRASS CO
CONOVER REST HOUSE (151/67 CONOVER ST in BROOKLYN, NY)
(Integrated Compliance Information System) - ICIS-02-1995-0411, FORMAL ENFORCEMENT ACTION, ICIS-02-1996-0144,
ABCON BUILDERS CORP (54 DEAN ST in BROOKLYN, NY)
Large Quantity Generators, more that 1000 kg of hazardous waste/month (Resource Conservation and Recovery Act (tracking hazardous waste))
CON EDISON - MH 14737 (S/S ATLANTIC AVE, 80` W/O FLAT in BROOKLYN, NY)
Large Quantity Generators, more that 1000 kg of hazardous waste/month (Resource Conservation and Recovery Act (tracking hazardous waste)) Organizations: CONSOLIDATED EDISON COMPANY OF NY, INC. (CONTACT/OPERATOR)
CON EDISON - MH 65360 (BERGEN SST. & BOYLAND ST. in BROOKLYN, NY)
Large Quantity Generators, more that 1000 kg of hazardous waste/month (Resource Conservation and Recovery Act (tracking hazardous waste)) Organizations: CONSOLIDATED EDISON COMPANY OF NY, INC. (CONTACT/OPERATOR)
CON EDISON - MH M14737 (ATLANTIC AVE & FLATBUSH AVE in BROOKLYN, NY)
Large Quantity Generators, more that 1000 kg of hazardous waste/month (Resource Conservation and Recovery Act (tracking hazardous waste)) Organizations: CONSOLIDATED EDISON COMPANY OF NY, INC. (CONTACT/OPERATOR)
GOWANUS REFUSE FACILITY (137 SECOND AVE in BROOKLYN, NY)
GREAT LAKES DREDGE & DOCK - TUG COLNON (ATLANTIC AVE PIER 8N BROOKLYN in BROOKLYN, NY)
Small Quantity Generators, between 100 kg and 1000 kg of hazardous waste/month (Resource Conservation and Recovery Act (tracking hazardous waste)) - notification Small Quantity Generators, between 100 kg and 1000 kg of hazardous waste/month (Resource Conservation and Recovery Act (tracking hazardous waste)) - notification Organizations: GREAT LAKE DREDGE & DOCK (CONTACT/OWNER)
Alternative names: GREAT LAKES DREDGE & DOCK - DREDGE LI
Housing units lacking complete plumbing facilities: 0.7% Housing units lacking complete kitchen facilities: 1.0%
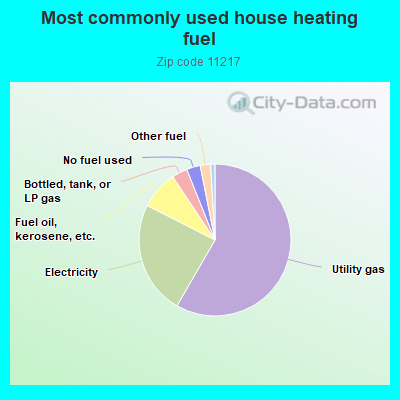
58.0%Utility gas
24.0%Electricity
8.1%Fuel oil, kerosene, etc.
3.3%Bottled, tank, or LP gas
2.9%No fuel used
2.2%Other fuel
0.9%Solar energy
Population in 1990: 36,232.
Place of birth for U.S.-born residents:
This state: 18,701
Northeast: 4,146
Midwest: 2,624
South: 4,445
West: 3,068
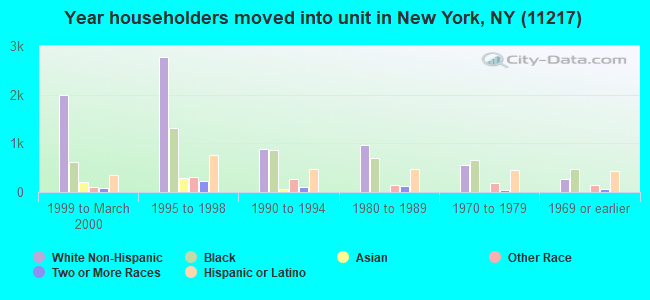
55% of the 11217 zip code residents lived in the same house 5 years ago. Out of people who lived in different houses, 46% lived in this county. Out of people who lived in different counties, 50% lived in New York.
80% of the 11217 zip code residents lived in the same house 1 year ago. Out of people who lived in different houses, 53% moved from this county. Out of people who lived in different houses, 25% moved from different county within same state. Out of people who lived in different houses, 21% moved from different state. Out of people who lived in different houses, 3% moved from abroad.
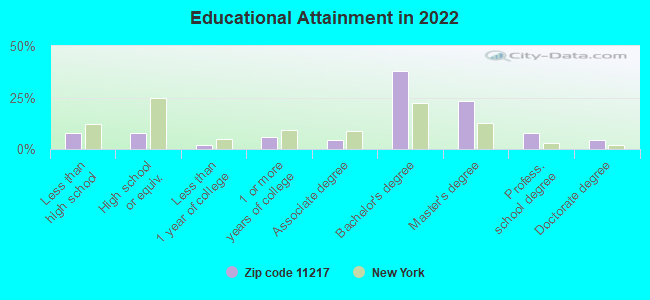
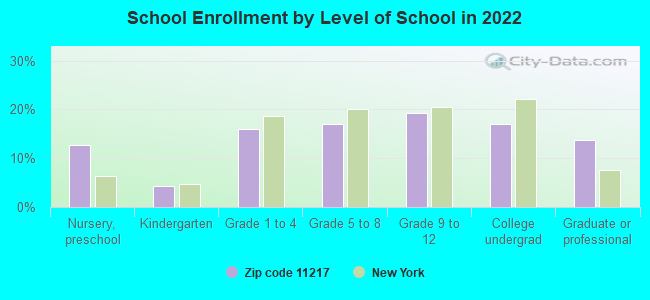
Private vs. public school enrollment:
Students in private schools in grades 1 to 8 (elementary and middle school): 773
Here:
31.2%
New York:
15.6%
Students in private schools in grades 9 to 12 (high school): 396
Here:
27.3%
New York:
15.0%
Students in private undergraduate colleges: 415
Here:
32.7%
New York:
39.2%
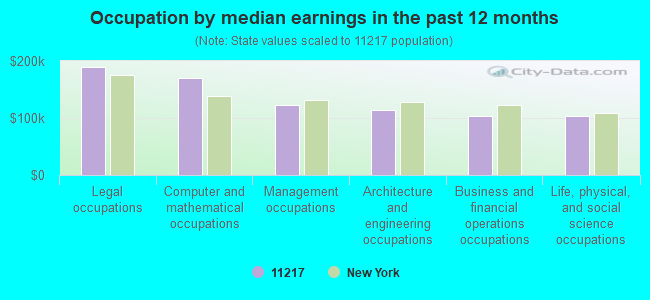
Occupation by median earnings in the past 12 months ($)
189,752Legal occupations
170,568Computer and mathematical occupations
122,423Management occupations
114,179Architecture and engineering occupations
104,278Business and financial operations occupations
102,702Life, physical, and social science occupations
Companies with federal contracts located in this zip code:
SAFETY MAIN STOPPERS CO INC (523 ATLANTIC AVE in BROOKLYN, NY; small business)
$12,282 with Navy for Rubber Fabricated Materials. Signed on 2005-06-20. Completion date: 2005-09-23.
OKLAND HOLDINGS LLC (362 ATLANTIC AVE, STE 132 in BROOKLYN, NY; small business) : $11,592 in 2 contractsin 2005
$8,680 with Navy for Bars and Rods, Nonferrous Base Metal. Signed on 2005-05-17. Completion date: 2005-06-07.
$2,912 with Navy for Bars and Rods. Signed on 2005-04-04. Completion date: 2005-04-14.
Top industries in this zip code by the number of employees in 2005:
2007 - 2018 National Fire Incident Reporting System (NFIRS) incidents
According to the data from the years 2007 - 2018 the average number of fire incidents per year is 200. The highest number of reported fire incidents - 236 took place in 2009, and the least - 149 in 2012. The data has a declining trend.
When looking into fire subcategories, the most reports belonged to: Structure Fires (69.5%), and Outside Fires (18.1%).
Fire incident types reported to NFIRS in Zip Code 11217


 Nearest zip codes: 11238, 11201, 11205, 11215, 11231, 11216.


 According to the data from the years 2007 - 2018 the average number of fire incidents per year is 200. The highest number of reported fire incidents - 236 took place in 2009, and the least - 149 in 2012. The data has a declining trend.
 When looking into fire subcategories, the most reports belonged to: Structure Fires (69.5%), and Outside Fires (18.1%).