Estimated zip code population in 2022: 49,520 Zip code population in 2010: 40,366 Zip code population in 2000: 35,622
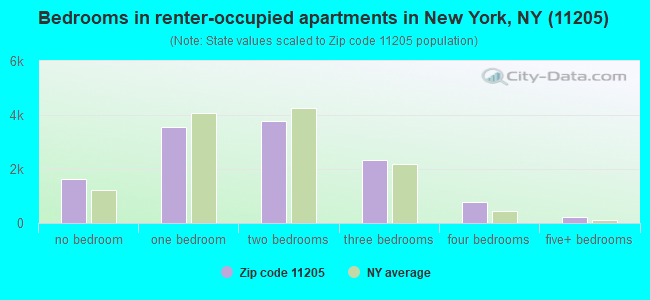
Houses and condos: 18,990 Renter-occupied apartments: 12,286
% of renters here:
71%
State:
46%
March 2022 cost of living index in zip code 11205: 157.7 (very high, U.S. average is 100)
Land area: 0.9 sq. mi. Water area: 0.0 sq. mi.
Population density: 52,203 people per square mile
(very high).
OSM Map
General Map
Google Map
MSN Map
OSM Map
General Map
Google Map
MSN Map
OSM Map
General Map
Google Map
MSN Map
OSM Map
General Map
Google Map
MSN Map
Please wait while loading the map...
Real estate property taxes paid for housing units in 2022:
This zip code:
0.6% ($5,498)
New York:
1.5% ($6,180)
Median real estate property taxes paid for housing units with mortgages in 2022: $5,382 (0.6%) Median real estate property taxes paid for housing units with no mortgage in 2022: $5,932 (0.6%)
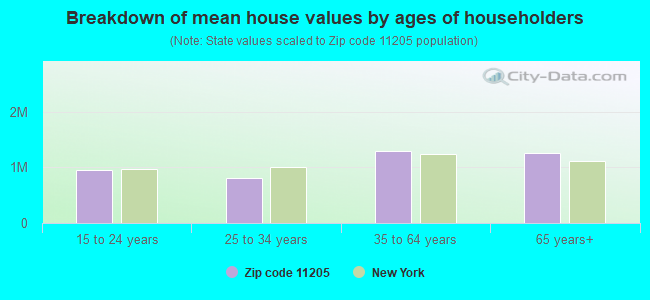
Estimated median house/condo value in 2022: $920,576
11205:
$920,576
New York:
$400,400
According to our research of New York and other state lists, there were 12 registered sex offenders living in 11205 zip code as of April 26, 2024. The ratio of all residents to sex offenders in zip code 11205 is 3,788 to 1. The ratio of registered sex offenders to all residents in this zip code is much lower than the state average.
Median resident age:
This zip code:
30.2 years
New York median age:
40.0 years
Average household size:
This zip code:
2.7 people
New York:
2.5 people
Averages for the 2020 tax year for zip code 11205, filed in 2021:
Average Adjusted Gross Income (AGI) in 2020: $83,611 (Individual Income Tax Returns)
Here:
$83,611
State:
$90,930
Salary/wage: $73,290 (reported on 85.3% of returns)
Here:
$73,290
State:
$72,104
(% of AGI for various income ranges: 1048.5% for AGIs below $25k, 3424.9% for AGIs $25k-50k, 6926.6% for AGIs $50k-75k, 10669.7% for AGIs $75k-100k, 19689.0% for AGIs $100k-200k, 108871.7% for AGIs over 200k)
Taxable interest for individuals: $1,193 (reported on 24.4% of returns)
This zip code:
$1,193
New York:
$3,075
(% of AGI for various income ranges: 5.4% for AGIs below $25k, 6.7% for AGIs $25k-50k, 10.8% for AGIs $50k-75k, 35.2% for AGIs $75k-100k, 58.0% for AGIs $100k-200k, 858.3% for AGIs over 200k)
Ordinary dividends: $4,529 (reported on 19.2% of returns)
Here:
$4,529
State:
$11,095
(% of AGI for various income ranges: 14.4% for AGIs below $25k, 17.0% for AGIs $25k-50k, 42.6% for AGIs $50k-75k, 101.4% for AGIs $75k-100k, 209.9% for AGIs $100k-200k, 2429.3% for AGIs over 200k)
Net capital gain/loss in AGI: +$22,049 (reported on 18.4% of returns)
Here:
+$22,049
State:
+$44,925
(% of AGI for various income ranges: 13.0% for AGIs below $25k, 37.0% for AGIs $25k-50k, 62.9% for AGIs $50k-75k, 163.8% for AGIs $75k-100k, 515.4% for AGIs $100k-200k, 15553.1% for AGIs over 200k)
Profit/loss from business: +$26,375 (reported on 21.5% of returns)
Here:
+$26,375
State:
+$14,940
(% of AGI for various income ranges: 160.9% for AGIs below $25k, 218.9% for AGIs $25k-50k, 376.0% for AGIs $50k-75k, 472.2% for AGIs $75k-100k, 1126.4% for AGIs $100k-200k, 15049.5% for AGIs over 200k)
Taxable individual retirement arrangement distribution: $16,517 (reported on 2.4% of returns)
11205:
$16,517
New York:
$19,609
(% of AGI for various income ranges: 12.5% for AGIs below $25k, 19.6% for AGIs $25k-50k, 39.1% for AGIs $50k-75k, 91.0% for AGIs $75k-100k, 172.9% for AGIs $100k-200k, 415.5% for AGIs over 200k)
Self-employed (Keogh) retirement plans: $21,091 (reported on 1.2% of returns)
11205:
$21,091
New York:
$32,497
(% of AGI for various income ranges: 3.2% for AGIs below $25k, 24.6% for AGIs $50k-75k, 81.2% for AGIs $100k-200k, 700.2% for AGIs over 200k)
Total itemized deductions: $39,111 (reported on 11.0% of returns)
Here:
$39,111
State:
$39,326
(% of AGI for various income ranges: 27.0% for AGIs below $25k, 84.5% for AGIs $25k-50k, 215.6% for AGIs $50k-75k, 625.0% for AGIs $75k-100k, 1258.3% for AGIs $100k-200k, 11246.9% for AGIs over 200k)
Charity contributions: $20,612 (reported on 8.7% of returns)
Here:
$20,612
State:
$15,420
(% of AGI for various income ranges: 1.8% for AGIs below $25k, 13.0% for AGIs $25k-50k, 38.0% for AGIs $50k-75k, 121.3% for AGIs $75k-100k, 351.0% for AGIs $100k-200k, 6339.0% for AGIs over 200k)
Taxes paid: $8,419 (reported on 10.9% of returns)
11205:
$8,419
State:
$9,183
(% of AGI for various income ranges: 8.4% for AGIs below $25k, 18.7% for AGIs $25k-50k, 63.4% for AGIs $50k-75k, 206.4% for AGIs $75k-100k, 403.2% for AGIs $100k-200k, 1577.1% for AGIs over 200k)
Earned income credit: $2,998 (reported on 20.4% of returns)
Here:
$2,998
State:
$2,138
(% of AGI for various income ranges: 165.5% for AGIs below $25k, 120.1% for AGIs $25k-50k, 1.6% for AGIs $50k-75k)
Percentage of individuals using paid preparers for their 2020 taxes: 95.1%
Here:
95%
State:
95%
(% for various income ranges: 94.0% for AGIs below $25k, 95.4% for AGIs $25k-50k, 94.8% for AGIs $50k-75k, 95.3% for AGIs $75k-100k, 95.5% for AGIs $100k-200k, 97.9% for AGIs over 200k)
Averages for the 2012 tax year for zip code 11205, filed in 2013:
Average Adjusted Gross Income (AGI) in 2012: $53,527 (Individual Income Tax Returns)
Here:
$53,527
State:
$77,088
Salary/wage: $50,167 (reported on 85.9% of returns)
Here:
$50,167
State:
$60,593
(% of AGI for various income ranges: 73.7% for AGIs below $25k, 87.0% for AGIs $25k-50k, 86.5% for AGIs $50k-75k, 86.0% for AGIs $75k-100k, 83.9% for AGIs $100k-200k, 69.2% for AGIs over 200k)
Taxable interest for individuals: $824 (reported on 22.9% of returns)
This zip code:
$824
New York:
$3,125
(% of AGI for various income ranges: 0.3% for AGIs below $25k, 0.2% for AGIs $25k-50k, 0.3% for AGIs $50k-75k, 0.2% for AGIs $75k-100k, 0.3% for AGIs $100k-200k, 0.7% for AGIs over 200k)
Ordinary dividends: $3,738 (reported on 12.7% of returns)
Here:
$3,738
State:
$10,299
(% of AGI for various income ranges: 0.6% for AGIs below $25k, 0.5% for AGIs $25k-50k, 0.7% for AGIs $50k-75k, 0.6% for AGIs $75k-100k, 0.8% for AGIs $100k-200k, 1.7% for AGIs over 200k)
Net capital gain/loss in AGI: +$15,526 (reported on 10.4% of returns)
Here:
+$15,526
State:
+$42,474
(% of AGI for various income ranges: 0.1% for AGIs $25k-50k, 0.2% for AGIs $50k-75k, 0.4% for AGIs $75k-100k, 0.7% for AGIs $100k-200k, 11.6% for AGIs over 200k)
Profit/loss from business: +$13,131 (reported on 23.8% of returns)
Here:
+$13,131
State:
+$16,168
(% of AGI for various income ranges: 17.0% for AGIs below $25k, 4.5% for AGIs $25k-50k, 5.2% for AGIs $50k-75k, 4.0% for AGIs $75k-100k, 4.6% for AGIs $100k-200k, 4.3% for AGIs over 200k)
Taxable individual retirement arrangement distribution: $12,573 (reported on 2.5% of returns)
11205:
$12,573
New York:
$17,621
(% of AGI for various income ranges: 0.4% for AGIs below $25k, 0.6% for AGIs $25k-50k, 0.6% for AGIs $50k-75k, 0.7% for AGIs $75k-100k, 0.8% for AGIs $100k-200k, 0.3% for AGIs over 200k)
Self-employment retirement plans: $16,862 (reported on 0.9% of returns)
11205:
$16,862
New York:
$27,330
(% of AGI for various income ranges: 0.1% for AGIs below $25k, 0.3% for AGIs $50k-75k, 0.4% for AGIs $100k-200k, 0.6% for AGIs over 200k)
Total itemized deductions: $24,647 (21% of AGI, reported on 29.6% of returns)
Here:
$24,647
State:
$34,985
Here:
21.4% of AGI
State:
21.3% of AGI
(% of AGI for various income ranges: 4.3% for AGIs below $25k, 8.0% for AGIs $25k-50k, 12.6% for AGIs $50k-75k, 16.2% for AGIs $75k-100k, 17.3% for AGIs $100k-200k, 17.7% for AGIs over 200k)
Charity contributions: $4,164 (reported on 23.7% of returns)
Here:
$4,164
State:
$5,572
(% of AGI for various income ranges: 0.4% for AGIs below $25k, 1.2% for AGIs $25k-50k, 1.8% for AGIs $50k-75k, 2.1% for AGIs $75k-100k, 2.1% for AGIs $100k-200k, 2.5% for AGIs over 200k)
Taxes paid: $12,033 (reported on 29.5% of returns)
11205:
$12,033
State:
$18,656
(% of AGI for various income ranges: 0.6% for AGIs below $25k, 2.1% for AGIs $25k-50k, 4.8% for AGIs $50k-75k, 7.5% for AGIs $75k-100k, 9.0% for AGIs $100k-200k, 10.8% for AGIs over 200k)
Earned income credit: $2,848 (reported on 27.6% of returns)
Here:
$2,848
State:
$2,230
(% of AGI for various income ranges: 12.4% for AGIs below $25k, 1.0% for AGIs $25k-50k)
Percentage of individuals using paid preparers for their 2012 taxes: 60.4%
Here:
60%
State:
66%
(% for various income ranges: 60.1% for AGIs below $25k, 56.7% for AGIs $25k-50k, 56.3% for AGIs $50k-75k, 63.1% for AGIs $75k-100k, 68.8% for AGIs $100k-200k, 81.5% for AGIs over 200k)
Averages for the 2004 tax year for zip code 11205, filed in 2005:
Average Adjusted Gross Income (AGI) in 2004: $35,621 (Individual Income Tax Returns)
Here:
$35,621
State:
$59,519
Salary/wage: $35,334 (reported on 87.3% of returns)
Here:
$35,334
State:
$50,673
(% of AGI for various income ranges: 95.0% for AGIs below $10k, 82.3% for AGIs $10k-25k, 92.3% for AGIs $25k-50k, 90.9% for AGIs $50k-75k, 88.0% for AGIs $75k-100k, 76.1% for AGIs over 100k)
Taxable interest for individuals: $639 (reported on 28.4% of returns)
This zip code:
$639
New York:
$2,377
(% of AGI for various income ranges: 1.9% for AGIs below $10k, 0.5% for AGIs $10k-25k, 0.4% for AGIs $25k-50k, 0.4% for AGIs $50k-75k, 0.6% for AGIs $75k-100k, 0.6% for AGIs over 100k)
Taxable dividends: $1,750 (reported on 11.7% of returns)
Here:
$1,750
State:
$5,394
(% of AGI for various income ranges: 1.2% for AGIs below $10k, 0.5% for AGIs $10k-25k, 0.3% for AGIs $25k-50k, 0.4% for AGIs $50k-75k, 0.7% for AGIs $75k-100k, 1.0% for AGIs over 100k)
Net capital gain/loss: +$8,035 (reported on 8.8% of returns)
Here:
+$8,035
State:
+$23,581
(% of AGI for various income ranges: -0.3% for AGIs below $10k, -0.0% for AGIs $10k-25k, 0.2% for AGIs $25k-50k, -0.0% for AGIs $50k-75k, 0.0% for AGIs $75k-100k, 8.3% for AGIs over 100k)
Profit/loss from business: +$6,939 (reported on 19.5% of returns)
Here:
+$6,939
State:
+$13,809
(% of AGI for various income ranges: 20.4% for AGIs below $10k, 9.1% for AGIs $10k-25k, 1.5% for AGIs $25k-50k, 1.2% for AGIs $50k-75k, 2.1% for AGIs $75k-100k, 4.8% for AGIs over 100k)
IRA payment deduction: $2,145 (reported on 2.1% of returns)
11205:
$2,145
New York:
$3,115
(% of AGI for various income ranges: 0.3% for AGIs below $10k, 0.2% for AGIs $10k-25k, 0.2% for AGIs $25k-50k, 0.1% for AGIs $50k-75k, 0.1% for AGIs $75k-100k, 0.1% for AGIs over 100k)
Self-employed pension: $11,559 (reported on 0.4% of returns)
Here:
$11,559
New York:
$19,016
(% of AGI for various income ranges: 0.1% for AGIs $10k-25k, 0.1% for AGIs $50k-75k, 0.5% for AGIs over 100k)
Total itemized deductions: $17,530 (26% of AGI, reported on 31.5% of returns)
Here:
$17,530
State:
$25,864
Here:
26.0% of AGI
State:
21.9% of AGI
(% of AGI for various income ranges: 6.4% for AGIs below $10k, 6.2% for AGIs $10k-25k, 14.3% for AGIs $25k-50k, 19.4% for AGIs $50k-75k, 18.9% for AGIs $75k-100k, 18.4% for AGIs over 100k)
Charity contributions deductions: $3,268 (5% of AGI, reported on 28.4% of returns)
Here:
$3,268
State:
$4,439
Here:
4.7% of AGI
State:
3.6% of AGI
(% of AGI for various income ranges: 0.3% for AGIs below $10k, 1.0% for AGIs $10k-25k, 2.7% for AGIs $25k-50k, 3.6% for AGIs $50k-75k, 3.1% for AGIs $75k-100k, 2.6% for AGIs over 100k)
Total tax: $5,374 (reported on 70.9% of returns)
11205:
$5,374
State:
$11,730
(% of AGI for various income ranges: 4.6% for AGIs below $10k, 4.4% for AGIs $10k-25k, 7.2% for AGIs $25k-50k, 10.9% for AGIs $50k-75k, 13.5% for AGIs $75k-100k, 18.1% for AGIs over 100k)
Earned income credit: $1,904 (reported on 27.5% of returns)
Here:
$1,904
State:
$1,757
Percentage of individuals using paid preparers for their 2004 taxes: 63.5%
Here:
64%
State:
67%
(% for various income ranges: 56.7% for AGIs below $10k, 65.2% for AGIs $10k-25k, 62.9% for AGIs $25k-50k, 66.3% for AGIs $50k-75k, 70.0% for AGIs $75k-100k, 76.1% for AGIs over 100k)
Likely homosexual households (counted as self-reported same-sex unmarried-partner households)
Lesbian couples: 0.2% of all households
Gay men: 0.5% of all households
Household received Food Stamps/SNAP in the past 12 months: 4,553 Household did not receive Food Stamps/SNAP in the past 12 months: 12,889
Women who had a birth in the past 12 months: 941 (714 now married, 224 unmarried) Women who did not have a birth in the past 12 months: 13,805 (3,717 now married, 10,151 unmarried)
Housing units in zip code 11205 with a mortgage: 3,774 (402 second mortgage, 338 both second mortgage and home equity loan) Houses without a mortgage: 137
Median monthly owner costs for units with a mortgage: $3,005 Median monthly owner costs for units without a mortgage: $867
Residents with income below the poverty level in 2022:
This zip code:
30.7%
Whole state:
14.3%
Residents with income below 50% of the poverty level in 2022:
This zip code:
17.1%
Whole state:
6.8%
Median number of rooms in houses and condos:
Here:
4.1
State:
6.3
Median number of rooms in apartments:
Here:
3.6
State:
3.8
Notable locations in this zip code not listed on our city pages
Notable locations in zip code 11205: Walt Whitman Branch Brooklyn Public Library (A), Fire Department New York City Engine 209 (B), Fire Department New York Engine 210 (C), New York Ladder Company 102 (D), Cumberland Diagnostic Treatment Center (E), Brooklyn Masonic Temple (F), Memorial Hall (G), Main Building Pratt Institute (H), South Hall (I), Pratt Institute Library (J), Pratt Activity/Resource Center (K), Stabile Hall (L), Thrift Hall (M). Display/hide their locations on the map
Churches in zip code 11205 include: Revelation Church of God in Christ (A), Saint Peter's Evangelical Lutheran Church (B), Kingdom Hall of Jehovah's Witnesses (C), Saint Lucy's Roman Catholic Church (D), Saint Patrick's Roman Catholic Church (E), Saint Mary's Episcopal Church (F), Emmanuel Baptist Church (G), Apostolic Faith Church (H), Our Lady Queen of All Saints Church (I). Display/hide their locations on the map
Parks in zip code 11205 include: Underwood Park (1), Commodore John Barry Park (2), Oxport Playground (3), Clinton Hill Historic District (4), Albert Lysander Parham Playground (5), Person Square (6), Oracle Playground (7), Washington Hall Park (8), Pratt Playground (9). Display/hide their locations on the map
11,434 married couples with children.
2,661 single-parent households (336 men, 2,325 women).
55.0% of residents of 11205 zip code speak English at home.
11.2% of residents speak Spanish at home (63% very well, 14% well, 15% not well, 7% not at all).
24.8% of residents speak other Indo-European language at home (55% very well, 27% well, 10% not well, 8% not at all).
6.6% of residents speak Asian or Pacific Island language at home (45% very well, 22% well, 14% not well, 19% not at all).
2.7% of residents speak other language at home (73% very well, 24% well, 3% not at all).
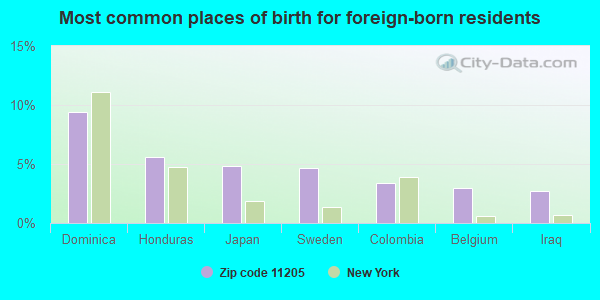
Foreign born population: 8,116 (16.4%) (55.1% of them are naturalized citizens)
This zip code:
16.4%
Whole state:
22.7%
9%Dominica
6%Honduras
5%Japan
5%Sweden
3%Colombia
3%Belgium
3%Iraq
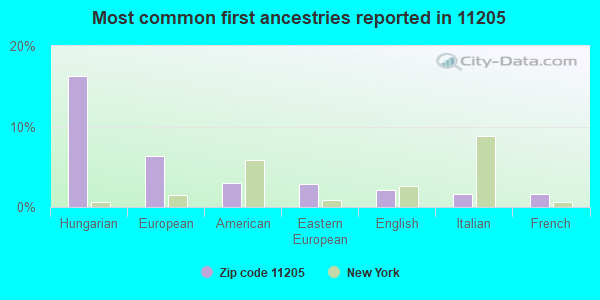
19%Hungarian
6%European
4%Eastern European
3%American
2%English
2%Romanian
1%Italian
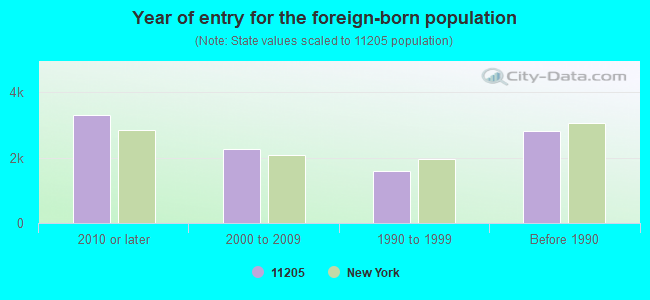
Year of entry for the foreign-born population
3,3082010 or later
2,2522000 to 2009
1,5981990 to 1999
2,824Before 1990
Major facilities with environmental interests located in this zip code:
ACOSTA CLEANERS (509 DEKALB AVE in BROOKLYN, NY)
AIR MINOR (AIRS/AFS) STATE MASTER (New York facility tracking) - AIR PROGRAM Conditionally Exempt Small Quantity Generators, less than 100 kg/month of hazardous waste (Resource Conservation and Recovery Act (tracking hazardous waste)) - notification Business SIC classification: DRYCLEANING PLANTS, EXCEPT RUG CLEANING Business NAICS classification: DRYCLEANING AND LAUNDRY SERVICES (EXCEPT COIN-OPERATED). Organizations: HERLS CLEANERS CORP (CONTACT/OWNER)
, HERL S CLEANERS CORP (LEGALLY RESPONSIBLE PARTY)
, ACOSTA CLEANERS INC (LEGALLY RESPONSIBLE PARTY)
, ACOSTA BROTHERS CLEANERS INC (LEGALLY RESPONSIBLE PARTY)
Alternative names: HERL'S CLEANERS
AMOCO (895 BEDFORD AVE in BROOKLYN, NY)
(Integrated Compliance Information System) - ICIS-02-1997-0297, FORMAL ENFORCEMENT ACTION HAZARDOUS WASTE BIENNIAL REPORTER (Resource Conservation and Recovery Act (tracking hazardous waste)) Large Quantity Generators, more that 1000 kg of hazardous waste/month (Resource Conservation and Recovery Act (tracking hazardous waste)) - notification Organizations: VICTOR MIRANDA (CONTACT/OPERATOR)
, 3072 CROPSEY AVENUE CORP (CONTACT/OWNER)
AS FURNITURE FINISHING-BLDG #280 (BROOKLYN NAVY YARD BLDG #280 in BROOKLYN, NY)
AIR MINOR (AIRS/AFS) STATE MASTER (New York facility tracking) - AIR PROGRAM, Business SIC classification: WOOD PRODUCTS Organizations: A S FURNITURE FINISHING CO (LEGALLY RESPONSIBLE PARTY)
Alternative names: A S FURNITURE REFINISHING
ALTERED STATES FINISHING (BROOKLYN NAVY YARD in BROOKLYN, NY)
AIR SYNTHETIC MINOR (AIRS/AFS) STATE MASTER (New York facility tracking) - AIR PROGRAM Business SIC classification: REUPHOLSTERY AND FURNITURE REPAIR Organizations: CHYKY FINISHING (LEGALLY RESPONSIBLE PARTY)
CLINTON AVE GROUP HOME ( in BROOKLYN, NY)
(National Center for Education Statistics) - STATE ID-331300890213 Organizations: NEW YORK CITY PUBLIC SCHOOLS (SCHOOL DISTRICT)
BENJAMIN BANNEKER ACAD FOR COMM DVLP ( in BROOKLYN, NY)
(National Center for Education Statistics) - STATE ID-331300010670 Organizations: NEW YORK CITY PUBLIC SCHOOLS (SCHOOL DISTRICT)
COMM PARTNERSHIP CHARTER SCHOOL ( in BROOKLYN, NY)
(National Center for Education Statistics) - STATE ID-331300860810
IS 117 F. S. KEY IS ( in BROOKLYN, NY)
(National Center for Education Statistics) - STATE ID-331300010117 Organizations: NEW YORK CITY PUBLIC SCHOOLS (SCHOOL DISTRICT)
INGERSOLL HOUSES (110 MONUMENT WALK in BROOKLYN, NY)
(Integrated Compliance Information System) - ICIS-02-2002-1014, FORMAL ENFORCEMENT ACTION
HARMAN AUTO PARTS INCORPORATED (790 BEDFORD AVENUE in BROOKLYN, NY)
(Integrated Compliance Information System) - ICIS-02-1993-0199, FORMAL ENFORCEMENT ACTION Alternative names: HARMON AUTO PARTS INC
A D V TECHNOLOGICAL SOLUTIONS (585 DEKALB AVENUE in BROOKLYN, NY)
Large Quantity Generators, more that 1000 kg of hazardous waste/month (Resource Conservation and Recovery Act (tracking hazardous waste)) TRI REPORTER (Tracking of toxic chemicals releasing facilities) Business SIC classification: COMPUTER STORAGE DEVICES Organizations: JOHN RITTER (CONTACT/OPERATOR)
, DEKALB AVENUE ASSOCIATES (CONTACT/OWNER)
Alternative names: IBM
CON EDISON - MH MH-1958 (JOHNSON DR. AND NAVY ST in BROOKLYN, NY)
Large Quantity Generators, more that 1000 kg of hazardous waste/month (Resource Conservation and Recovery Act (tracking hazardous waste)) Organizations: CONSOLIDATED EDISON COMPANY OF NY, INC. (CONTACT/OPERATOR)
Housing units lacking complete plumbing facilities: 0.6% Housing units lacking complete kitchen facilities: 0.6%
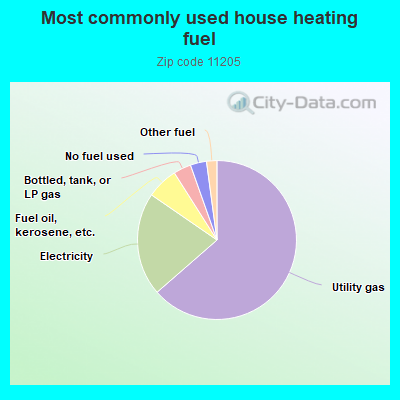
63.6%Utility gas
21.0%Electricity
6.4%Fuel oil, kerosene, etc.
3.6%Bottled, tank, or LP gas
3.3%No fuel used
2.1%Other fuel
Population in 1990: 36,852.
Place of birth for U.S.-born residents:
This state: 29,949
Northeast: 2,834
Midwest: 1,584
South: 3,435
West: 1,885
63% of the 11205 zip code residents lived in the same house 5 years ago. Out of people who lived in different houses, 60% lived in this county. Out of people who lived in different counties, 50% lived in New York.
87% of the 11205 zip code residents lived in the same house 1 year ago. Out of people who lived in different houses, 61% moved from this county. Out of people who lived in different houses, 21% moved from different county within same state. Out of people who lived in different houses, 14% moved from different state. Out of people who lived in different houses, 4% moved from abroad.
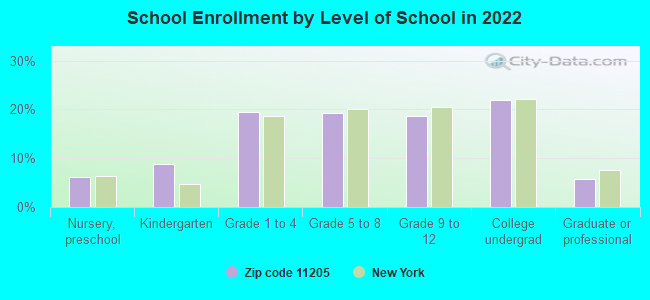
Private vs. public school enrollment:
Students in private schools in grades 1 to 8 (elementary and middle school): 4,004
Here:
60.1%
New York:
15.6%
Students in private schools in grades 9 to 12 (high school): 2,081
Here:
66.3%
New York:
15.0%
Students in private undergraduate colleges: 2,654
Here:
70.0%
New York:
39.2%
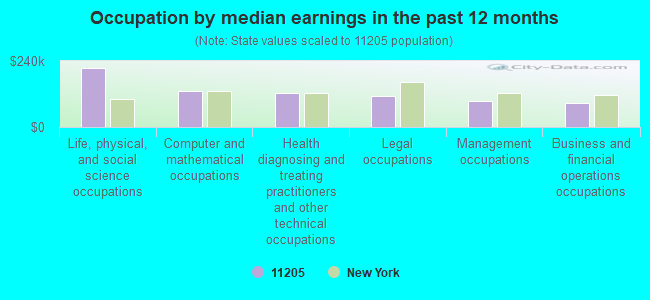
Occupation by median earnings in the past 12 months ($)
214,170Life, physical, and social science occupations
130,688Computer and mathematical occupations
123,272Health diagnosing and treating practitioners and other technical occupations
111,281Legal occupations
94,975Management occupations
87,172Business and financial operations occupations
Companies with biggest federal contracts located in this zip code (BROOKLYN, NY):
L D F INDUSTRIES INC (30 WARSOFF PL; small business) : $9,670,838 in 39 contractsfrom 2004 to 2006
Contracts for Roofing and Siding Materials, Tents and Tarpaulins, Plastics Fabricated Materials by Federal Emergency Management Agency, Army, U.S. Army Corps of Engineers - civil program financing only Signed by year:2000: $0; 2001: $0; 2002: $0; 2003: $0; 2004: $6,654,503; 2005: $1,729,907; 2006: $1,286,428.
Biggest contracts:
$1,331,337 with Federal Emergency Management Agency for Roofing and Siding Materials. Signed on 2005-09-21. Completion date: 2005-09-21.
$1,282,400 with Federal Emergency Management Agency for Tents and Tarpaulins. Signed on 2006-02-15. Completion date: 2006-02-15.
$1,242,000 with Army for Plastics Fabricated Materials. Taking place in IL. Signed on 2004-10-06. Completion date: 2005-09-30.
$1,242,000 with U.S. Army Corps of Engineers - civil program financing only for Plastics Fabricated Materials. Taking place in IL. Signed on 2004-10-06. Completion date: 2005-09-30.
PLURIBUS PRODUCTS INC (77 WASHINGTON AVE; small business) : $9,033,878 in 527 contractsfrom 1999 to 2006
Contracts for Signs, Advertising Displays, and Identification Plates, Luggage, Boxes, Cartons, and Crates, Office Furniture, and moreby Army, Defense Logistics Agency, Bureau of Prisoners/Federal Prison System, Federal Supply Service, and others Signed by year:2000: $774,400; 2001: $1,316,219; 2002: $1,738,269; 2003: $1,658,645; 2004: $1,901,609; 2005: $838,635; 2006: $703,681.
Biggest contracts:
$796,482 with Army for Signs, Advertising Displays, and Identification Plates. Signed on 2003-10-22. Completion date: 2005-09-30.
$397,575 with Defense Logistics Agency for Luggage. Signed on 2002-07-31. Completion date: 2003-05-23.
$397,575, same as above.Signed on 2002-01-08. Completion date: 2002-11-04.
$372,824 with Army for Signs, Advertising Displays, and Identification Plates. Signed on 2001-03-05. Completion date: 2005-09-30.
EASTERN TECHNICAL ENTERPRISES, (DRYDOCK #1 BROOKLYN NAVY Y; small business) 500 employees, $0 revenue. : $4,420,403 in 20 contractsfrom 1999 to 2001
Contracts for Non-nuclear Ship Repair (East) Ship repair (including overhauls and conversions) performed on non-nuclear propelled and nonpropelled ships east of the 108th meridian by Navy, Maritime Administration Signed by year:2000: $1,989,294; 2001: $1,868,438; 2002: $0; 2003: $0; 2004: $0; 2005: $0; 2006: $0.
Biggest contracts:
$1,169,069 with Navy for Non-nuclear Ship Repair (East) Ship repair (including overhauls and conversions) performed on non-nuclear propelled and nonpropelled ships east of the 108th meridian. Signed on 2001-09-13. Completion date: 2002-01-23.
$1,095,569, same as above.Signed on 2000-08-17. Completion date: 2000-11-15.
$468,969 with Navy for Non-nuclear Ship Repair (East) Ship repair (including overhauls and conversions) performed on non-nuclear propelled and nonpropelled ships east of the 108th meridian. Taking place in VA. Signed on 2000-02-23. Completion date: 2000-05-26.
$429,069 with Navy for Non-nuclear Ship Repair (East) Ship repair (including overhauls and conversions) performed on non-nuclear propelled and nonpropelled ships east of the 108th meridian. Signed on 1999-10-07. Completion date: 1999-12-15.
CRYE AMERICAN LLC (63 FLUSHING AVE; small business) : $4,239,510 in 18 contractsfrom 2001 to 2005
Contracts for Services -- Basic Research (R&D), Other Research and Development -- Basic Research (R&D), Individual Equipment, Clothing, Special Purpose, and moreby Army, Office of Policy, Management and Budget/Chief Financial Officer Signed by year:2000: $0; 2001: $598,150; 2002: $1,383,660; 2003: $1,623,055; 2004: $526,459; 2005: $108,186; 2006: $0.
Biggest contracts:
$1,509,260 with Army for Services -- Basic Research (R&D). Signed on 2003-03-03. Completion date: 2004-02-29.
$600,000, same as above.Signed on 2002-06-27. Completion date: 2004-02-29.
$425,000, same as above.Signed on 2001-09-26. Completion date: 2004-02-29.
$313,275, same as above.Signed on 2002-11-22. Completion date: 2004-02-29.
BIC SUPPLY, LLC (BROOKLYN NAVY YARD; small business) 3 employees, $220000 revenue. : $1,391,076 in 537 contractsfrom 2003 to 2006
Contracts for Hand Tools, Nonedged, Nonpowered, Boxes, Cartons, and Crates, Hand Tools, Edged, Nonpowered, Clothing, Special Purpose, and moreby U.S. Customs Service, Army, U.S. Army Corps of Engineers - civil program financing only, Federal Supply Service, and others Signed by year:2000: $0; 2001: $0; 2002: $0; 2003: $399,037; 2004: $292,239; 2005: $499,169; 2006: $200,631.
Biggest contracts:
$389,702 with U.S. Customs Service for Hand Tools, Nonedged, Nonpowered. Signed on 2003-09-15. Completion date: 2003-11-15.
$207,705 with Army for Boxes, Cartons, and Crates. Signed on 2005-08-17. Completion date: 2005-10-07.
$55,250 with U.S. Army Corps of Engineers - civil program financing only for Hand Tools, Nonedged, Nonpowered. Signed on 2004-08-26. Completion date: 2004-08-27.
$55,250 with Army for Hand Tools, Nonedged, Nonpowered. Signed on 2004-08-26. Completion date: 2004-08-27.
CRYE ASSOCIATES LLC (63 FLUSHING AVE; small business) : $534,586 in 3 contractsin 2006
$424,449 with Office of Policy, Management and Budget/Chief Financial Officer for Other Research and Development -- Basic Research (R&D). Signed on 2006-04-25. Effective on 2006-05-05. Completion date: 2007-02-05.
$68,254, same as above.Signed on 2006-06-28. Effective on 2006-06-30. Completion date: 2007-02-05.
$41,883 with U.S. Special Operations Command for Outerwear, Men's. Signed on 2006-06-08. Completion date: 2006-06-16.
FCE INDUSTRIES LTD (BROOKLYN NAVY YD 595; small business) 23 employees, $9221520 revenue. : $387,000 in 6 contractsfrom 1999 to 2002
Contracts for Non-nuclear Ship Repair (East) Ship repair (including overhauls and conversions) performed on non-nuclear propelled and nonpropelled ships east of the 108th meridian by United States Coast Guard (disused code: now 7008) Signed by year:2000: $0; 2001: $0; 2002: $266,000; 2003: $0; 2004: $0; 2005: $0; 2006: $0.
Biggest contracts:
$263,000 with United States Coast Guard (disused code: now 7008) for Non-nuclear Ship Repair (East) Ship repair (including overhauls and conversions) performed on non-nuclear propelled and nonpropelled ships east of the 108th meridian. Taking place in MA. Signed on 2002-02-15. Completion date: 2002-07-15.
$83,000 with United States Coast Guard (disused code: now 7008) for Non-nuclear Ship Repair (East) Ship repair (including overhauls and conversions) performed on non-nuclear propelled and nonpropelled ships east of the 108th meridian. Signed on 1999-10-15. Completion date: 1999-12-15.
$27,000, same as above.Signed on 1999-10-15. Completion date: 1999-12-15.
$10,000, same as above.Signed on 1999-10-15. Completion date: 1999-12-15.
MAIDAY MAYDAY CLEANING SERVICE (171 CLERMONT AVENUE; small business) : $163,049 in 3 contractsfrom 2004 to 2006
$58,044 with Army for Custodial Janitorial Services. Signed on 2006-06-01. Completion date: 2007-05-31.
$55,812, same as above.Signed on 2005-05-24. Completion date: 2006-04-30.
$49,193, same as above.Signed on 2004-06-23. Completion date: 2005-05-31.
CRYE PRECISION, LLC (63 FLUSHING AVE UNIT 252; small business) : $133,804 in 7 contractsfrom 2005 to 2006
Contracts for Individual Equipment, Clothing, Special Purpose, Armor, Personal by Army, U.S. Special Operations Command, Drug Enforcement Administration Signed by year:2000: $0; 2001: $0; 2002: $0; 2003: $0; 2004: $0; 2005: $101,541; 2006: $32,263.
Biggest contracts:
$76,000 with Army for Individual Equipment. Signed on 2005-08-09. Completion date: 2005-10-04.
$22,372 with U.S. Special Operations Command for Clothing, Special Purpose. Signed on 2006-03-20. Completion date: 2006-05-15.
$17,576 with Army for Armor, Personal. Signed on 2005-09-01. Completion date: 2005-09-26.
$7,965 with Drug Enforcement Administration for Clothing, Special Purpose. Taking place in CA. Signed on 2005-09-19. Completion date: 2005-10-30.
BROOKLYN NAVY YARD DEVELOPMENT (BROOKLYN NAVY YARD BLDG) 165 employees, $15360325 revenue
$120,000 with Bureau of Prisoners/Federal Prison System for Electric Services. Signed on 2002-01-15. Completion date: 2002-01-15.
Top industries in this zip code by the number of employees in 2005:
Educational Services: Colleges, Universities, and Professional Schools (over 1000 employees: 1 establishment, 250-499 employees: 1 establishment)
Administrative and Support and Waste Management and Remediation Services: Security Guards and Patrol Services (250-499: 1, 20-49: 1)
Health Care and Social Assistance: General Medical and Surgical Hospitals (250-499: 1)
Health Care and Social Assistance: Residential Mental Health and Substance Abuse Facilities (100-249: 1, 20-49: 2, 10-19: 2)
Health Care and Social Assistance: Child Day Care Services (50-99: 1, 20-49: 3, 10-19: 2, 5-9: 2, 1-4: 2)
Wholesale Trade: Men's and Boys' Clothing and Furnishings Merchant Wholesalers (100-249: 1, 20-49: 1, 5-9: 2, 1-4: 2)
Wholesale Trade: Industrial and Personal Service Paper Merchant Wholesalers (100-249: 1, 5-9: 3, 1-4: 2)
Construction: Other Building Finishing Contractors (100-249: 1, 5-9: 1, 1-4: 2)
People in group quarters in 2010:
1,358 people in college/university student housing
842 people in emergency and transitional shelters (with sleeping facilities) for people experiencing homelessness
155 people in nursing facilities/skilled-nursing facilities
85 people in residential treatment centers for adults
71 people in workers' group living quarters and job corps centers
16 people in group homes intended for adults
16 people in other noninstitutional facilities
8 people in group homes for juveniles (non-correctional)
People in group quarters in 2000:
1,275 people in college dormitories (includes college quarters off campus)
858 people in other noninstitutional group quarters
179 people in other group homes
152 people in nursing homes
62 people in homes for the mentally retarded
42 people in religious group quarters
40 people in other types of correctional institutions
16 people in homes or halfway houses for drug/alcohol abuse
8 people in homes for the physically handicapped
Fatal accident statistics in 2014:
Fatal accident count: 1
Vehicles involved in fatal accidents: 2
Fatal accidents caused by drunken drivers: 0
Fatalities: 1
Persons involved in fatal accidents: 2
Pedestrians involved in fatal accidents: 0
Fatal accident statistics in 2013:
Fatal accident count: 1
Vehicles involved in fatal accidents: 4
Fatal accidents caused by drunken drivers: 0
Fatalities: 1
Persons involved in fatal accidents: 2
Pedestrians involved in fatal accidents: 4
Home Mortgage Disclosure Act Aggregated Statistics For Year 2009 (Based on 17 full and 12 partial tracts)
A) FHA, FSA/RHS & VA Home Purchase Loans
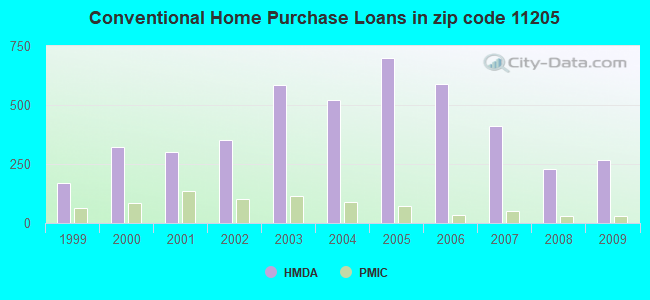
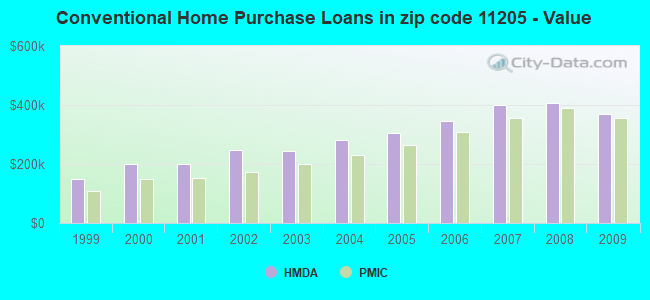
B) Conventional Home Purchase Loans
C) Refinancings
D) Home Improvement Loans
E) Loans on Dwellings For 5+ Families
F) Non-occupant Loans on < 5 Family Dwellings (A B C & D)
G) Loans On Manufactured Home Dwelling (A B C & D)
Number
Average Value
Number
Average Value
Number
Average Value
Number
Average Value
Number
Average Value
Number
Average Value
Number
Average Value
LOANS ORIGINATED
9
$722,077
266
$370,579
215
$294,549
8
$356,030
22
$983,616
86
$356,491
2
$528,460
APPLICATIONS APPROVED, NOT ACCEPTED
1
$458,800
40
$373,683
33
$385,232
0
$0
1
$710,820
8
$307,514
0
$0
APPLICATIONS DENIED
12
$684,389
164
$366,107
169
$418,361
14
$170,139
3
$1,303,803
78
$365,418
2
$70,000
APPLICATIONS WITHDRAWN
3
$503,957
33
$402,182
52
$407,898
3
$666,903
0
$0
10
$335,107
0
$0
FILES CLOSED FOR INCOMPLETENESS
2
$540,000
18
$350,405
26
$331,025
1
$70,240
0
$0
7
$330,599
0
$0
Aggregated Statistics For Year 2008 (Based on 20 full and 12 partial tracts)
A) FHA, FSA/RHS & VA Home Purchase Loans
B) Conventional Home Purchase Loans
C) Refinancings
D) Home Improvement Loans
E) Loans on Dwellings For 5+ Families
F) Non-occupant Loans on < 5 Family Dwellings (A B C & D)
G) Loans On Manufactured Home Dwelling (A B C & D)
Number
Average Value
Number
Average Value
Number
Average Value
Number
Average Value
Number
Average Value
Number
Average Value
Number
Average Value
LOANS ORIGINATED
4
$618,615
229
$406,843
158
$382,298
18
$222,412
32
$927,522
92
$391,345
0
$0
APPLICATIONS APPROVED, NOT ACCEPTED
0
$0
48
$412,868
40
$399,828
8
$154,070
0
$0
12
$383,576
0
$0
APPLICATIONS DENIED
3
$374,763
176
$427,987
138
$401,138
29
$141,087
9
$1,046,550
98
$353,013
2
$116,310
APPLICATIONS WITHDRAWN
6
$830,090
61
$411,759
49
$412,842
6
$468,803
5
$2,306,372
21
$396,515
0
$0
FILES CLOSED FOR INCOMPLETENESS
0
$0
44
$450,714
10
$341,965
3
$149,667
0
$0
13
$409,509
0
$0
Aggregated Statistics For Year 2007 (Based on 19 full and 12 partial tracts)
A) FHA, FSA/RHS & VA Home Purchase Loans
B) Conventional Home Purchase Loans
C) Refinancings
D) Home Improvement Loans
E) Loans on Dwellings For 5+ Families
F) Non-occupant Loans on < 5 Family Dwellings (A B C & D)
Number
Average Value
Number
Average Value
Number
Average Value
Number
Average Value
Number
Average Value
Number
Average Value
LOANS ORIGINATED
0
$0
412
$401,029
243
$392,551
65
$257,688
38
$968,863
113
$428,718
APPLICATIONS APPROVED, NOT ACCEPTED
0
$0
76
$434,230
61
$445,938
12
$249,878
1
$1,174,150
15
$550,633
APPLICATIONS DENIED
1
$290,000
195
$530,349
236
$463,598
66
$174,013
12
$903,416
76
$509,948
APPLICATIONS WITHDRAWN
0
$0
76
$575,160
86
$427,835
9
$153,853
5
$863,000
27
$618,179
FILES CLOSED FOR INCOMPLETENESS
0
$0
21
$442,099
34
$365,369
7
$337,434
0
$0
11
$342,761
Aggregated Statistics For Year 2006 (Based on 20 full and 12 partial tracts)
B) Conventional Home Purchase Loans
C) Refinancings
D) Home Improvement Loans
E) Loans on Dwellings For 5+ Families
F) Non-occupant Loans on < 5 Family Dwellings (A B C & D)
G) Loans On Manufactured Home Dwelling (A B C & D)
Number
Average Value
Number
Average Value
Number
Average Value
Number
Average Value
Number
Average Value
Number
Average Value
LOANS ORIGINATED
589
$346,444
376
$367,965
43
$255,950
30
$1,314,219
171
$335,688
0
$0
APPLICATIONS APPROVED, NOT ACCEPTED
128
$343,865
73
$391,127
6
$317,673
4
$1,484,495
20
$370,425
0
$0
APPLICATIONS DENIED
266
$399,867
230
$417,573
54
$143,787
3
$1,108,053
87
$387,284
2
$148,575
APPLICATIONS WITHDRAWN
127
$364,273
137
$385,114
22
$183,606
7
$1,029,429
38
$301,625
0
$0
FILES CLOSED FOR INCOMPLETENESS
36
$373,239
35
$357,745
8
$203,205
1
$653,000
13
$345,858
0
$0
Aggregated Statistics For Year 2005 (Based on 20 full and 12 partial tracts)
A) FHA, FSA/RHS & VA Home Purchase Loans
B) Conventional Home Purchase Loans
C) Refinancings
D) Home Improvement Loans
E) Loans on Dwellings For 5+ Families
F) Non-occupant Loans on < 5 Family Dwellings (A B C & D)
G) Loans On Manufactured Home Dwelling (A B C & D)
Number
Average Value
Number
Average Value
Number
Average Value
Number
Average Value
Number
Average Value
Number
Average Value
Number
Average Value
LOANS ORIGINATED
3
$331,703
698
$303,703
384
$332,514
40
$236,588
29
$1,300,227
237
$295,127
0
$0
APPLICATIONS APPROVED, NOT ACCEPTED
0
$0
203
$314,188
70
$352,932
7
$142,073
6
$587,112
36
$249,864
0
$0
APPLICATIONS DENIED
0
$0
232
$385,967
214
$359,156
51
$152,915
4
$692,472
57
$306,573
2
$27,995
APPLICATIONS WITHDRAWN
2
$60,885
135
$357,014
155
$350,320
13
$219,121
11
$497,017
51
$349,778
0
$0
FILES CLOSED FOR INCOMPLETENESS
2
$298,430
53
$307,582
58
$393,899
4
$74,885
0
$0
10
$325,542
1
$235,000
Aggregated Statistics For Year 2004 (Based on 20 full and 12 partial tracts)
A) FHA, FSA/RHS & VA Home Purchase Loans
B) Conventional Home Purchase Loans
C) Refinancings
D) Home Improvement Loans
E) Loans on Dwellings For 5+ Families
F) Non-occupant Loans on < 5 Family Dwellings (A B C & D)
Number
Average Value
Number
Average Value
Number
Average Value
Number
Average Value
Number
Average Value
Number
Average Value
LOANS ORIGINATED
4
$370,648
521
$281,062
387
$278,656
27
$175,459
48
$1,381,818
159
$276,947
APPLICATIONS APPROVED, NOT ACCEPTED
0
$0
119
$314,509
106
$289,987
8
$140,861
2
$279,240
54
$302,369
APPLICATIONS DENIED
1
$189,210
213
$345,469
209
$309,923
44
$265,950
6
$1,399,838
64
$377,028
APPLICATIONS WITHDRAWN
3
$204,930
127
$337,774
163
$274,543
11
$111,983
5
$305,944
42
$332,188
FILES CLOSED FOR INCOMPLETENESS
0
$0
35
$283,052
59
$294,675
2
$146,615
0
$0
4
$214,072
Aggregated Statistics For Year 2003 (Based on 20 full and 12 partial tracts)
A) FHA, FSA/RHS & VA Home Purchase Loans
B) Conventional Home Purchase Loans
C) Refinancings
D) Home Improvement Loans
E) Loans on Dwellings For 5+ Families
F) Non-occupant Loans on < 5 Family Dwellings (A B C & D)
Number
Average Value
Number
Average Value
Number
Average Value
Number
Average Value
Number
Average Value
Number
Average Value
LOANS ORIGINATED
5
$329,572
586
$244,611
634
$246,462
15
$56,662
49
$748,514
216
$256,358
APPLICATIONS APPROVED, NOT ACCEPTED
1
$276,000
96
$280,743
133
$297,108
10
$140,837
5
$410,542
30
$249,550
APPLICATIONS DENIED
4
$200,258
179
$274,797
280
$292,519
34
$53,130
5
$472,570
87
$225,142
APPLICATIONS WITHDRAWN
3
$249,000
68
$306,741
166
$271,239
8
$131,375
3
$4,467,510
45
$287,190
FILES CLOSED FOR INCOMPLETENESS
0
$0
38
$199,530
43
$280,295
5
$15,732
0
$0
11
$408,065
Aggregated Statistics For Year 2002 (Based on 20 full and 12 partial tracts)
A) FHA, FSA/RHS & VA Home Purchase Loans
B) Conventional Home Purchase Loans
C) Refinancings
D) Home Improvement Loans
E) Loans on Dwellings For 5+ Families
F) Non-occupant Loans on < 5 Family Dwellings (A B C & D)
Number
Average Value
Number
Average Value
Number
Average Value
Number
Average Value
Number
Average Value
Number
Average Value
LOANS ORIGINATED
14
$374,247
351
$247,811
373
$258,790
19
$59,629
35
$507,096
122
$281,067
APPLICATIONS APPROVED, NOT ACCEPTED
0
$0
86
$292,295
118
$234,970
13
$21,594
6
$243,835
29
$285,829
APPLICATIONS DENIED
3
$347,197
114
$265,137
196
$277,300
75
$50,552
3
$446,180
59
$224,726
APPLICATIONS WITHDRAWN
1
$414,000
36
$265,351
119
$234,498
13
$50,262
4
$614,860
17
$290,814
FILES CLOSED FOR INCOMPLETENESS
0
$0
25
$228,098
75
$249,456
6
$16,850
0
$0
18
$209,758
Aggregated Statistics For Year 2001 (Based on 18 full and 12 partial tracts)
A) FHA, FSA/RHS & VA Home Purchase Loans
B) Conventional Home Purchase Loans
C) Refinancings
D) Home Improvement Loans
E) Loans on Dwellings For 5+ Families
F) Non-occupant Loans on < 5 Family Dwellings (A B C & D)
Number
Average Value
Number
Average Value
Number
Average Value
Number
Average Value
Number
Average Value
Number
Average Value
LOANS ORIGINATED
17
$311,436
300
$200,600
243
$241,716
26
$99,448
11
$291,454
68
$259,303
APPLICATIONS APPROVED, NOT ACCEPTED
0
$0
58
$233,782
120
$192,548
11
$100,196
3
$198,507
24
$236,932
APPLICATIONS DENIED
4
$257,500
140
$203,423
205
$215,021
58
$59,058
1
$193,860
44
$187,457
APPLICATIONS WITHDRAWN
7
$284,387
48
$272,704
141
$191,354
24
$64,741
5
$290,184
15
$255,380
FILES CLOSED FOR INCOMPLETENESS
1
$143,000
18
$341,089
39
$242,029
6
$41,165
0
$0
1
$525,000
Aggregated Statistics For Year 2000 (Based on 20 full and 12 partial tracts)
A) FHA, FSA/RHS & VA Home Purchase Loans
B) Conventional Home Purchase Loans
C) Refinancings
D) Home Improvement Loans
E) Loans on Dwellings For 5+ Families
F) Non-occupant Loans on < 5 Family Dwellings (A B C & D)
Number
Average Value
Number
Average Value
Number
Average Value
Number
Average Value
Number
Average Value
Number
Average Value
LOANS ORIGINATED
12
$238,347
320
$199,891
115
$167,902
44
$20,708
15
$613,189
45
$207,924
APPLICATIONS APPROVED, NOT ACCEPTED
2
$495,260
50
$236,431
59
$166,830
14
$17,001
2
$199,620
19
$204,117
APPLICATIONS DENIED
10
$290,089
184
$233,025
153
$145,245
63
$46,657
3
$186,980
57
$198,611
APPLICATIONS WITHDRAWN
4
$216,288
45
$214,415
176
$110,997
12
$37,173
3
$10,043,907
11
$141,285
FILES CLOSED FOR INCOMPLETENESS
3
$262,163
14
$148,367
26
$193,917
8
$27,794
0
$0
3
$265,333
Aggregated Statistics For Year 1999 (Based on 9 full and 13 partial tracts)
A) FHA, FSA/RHS & VA Home Purchase Loans
B) Conventional Home Purchase Loans
C) Refinancings
D) Home Improvement Loans
E) Loans on Dwellings For 5+ Families
F) Non-occupant Loans on < 5 Family Dwellings (A B C & D)
2007 - 2018 National Fire Incident Reporting System (NFIRS) incidents
According to the data from the years 2007 - 2018 the average number of fire incidents per year is 236. The highest number of reported fire incidents - 263 took place in 2008, and the least - 197 in 2018. The data has a declining trend.
When looking into fire subcategories, the most reports belonged to: Structure Fires (76.6%), and Outside Fires (15.6%).
Fire incident types reported to NFIRS in Zip Code 11205

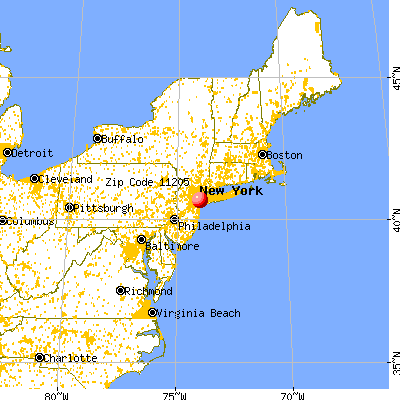


 Nearest zip codes: 11238, 11217, 11216, 11211, 11201, 11206.


 According to the data from the years 2007 - 2018 the average number of fire incidents per year is 236. The highest number of reported fire incidents - 263 took place in 2008, and the least - 197 in 2018. The data has a declining trend.
 When looking into fire subcategories, the most reports belonged to: Structure Fires (76.6%), and Outside Fires (15.6%).