Estimated zip code population in 2022: 57,548 Zip code population in 2010: 56,829 Zip code population in 2000: 63,774
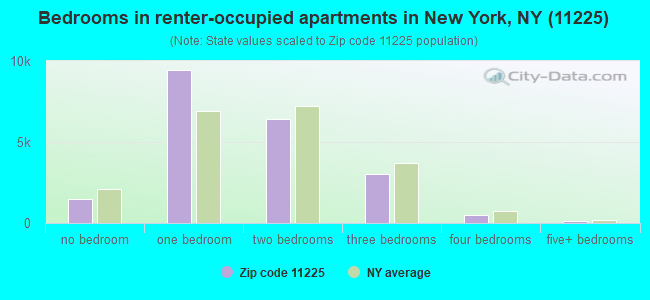
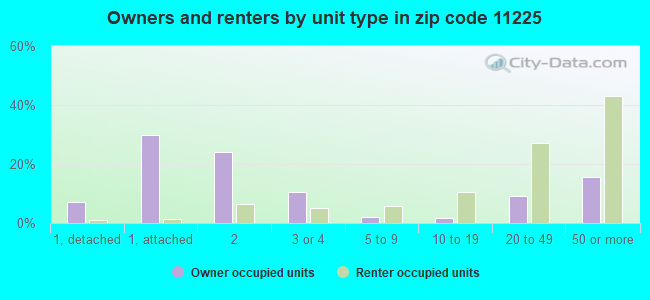
Houses and condos: 26,990 Renter-occupied apartments: 20,916
% of renters here:
82%
State:
46%
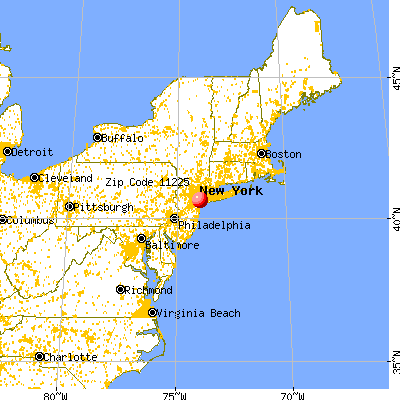
March 2022 cost of living index in zip code 11225: 160.1 (very high, U.S. average is 100)
Land area: 0.9 sq. mi. Water area: 0.0 sq. mi.
Population density: 65,108 people per square mile
(very high).
OSM Map
General Map
Google Map
MSN Map
OSM Map
General Map
Google Map
MSN Map
OSM Map
General Map
Google Map
MSN Map
OSM Map
General Map
Google Map
MSN Map
Please wait while loading the map...
Real estate property taxes paid for housing units in 2022:
This zip code:
0.5% ($6,032)
New York:
1.5% ($6,180)
Median real estate property taxes paid for housing units with mortgages in 2022: $5,875 (0.5%) Median real estate property taxes paid for housing units with no mortgage in 2022: $6,604 (0.6%)
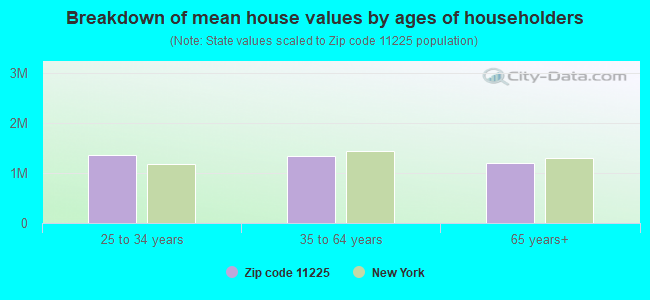
Estimated median house/condo value in 2022: $1,220,485
11225:
$1,220,485
New York:
$400,400
According to our research of New York and other state lists, there were 52 registered sex offenders living in 11225 zip code as of April 27, 2024. The ratio of all residents to sex offenders in zip code 11225 is 1,177 to 1. The ratio of registered sex offenders to all residents in this zip code is lower than the state average.
Median resident age:
This zip code:
36.6 years
New York median age:
40.0 years
Average household size:
This zip code:
2.2 people
New York:
2.5 people
Averages for the 2020 tax year for zip code 11225, filed in 2021:
Average Adjusted Gross Income (AGI) in 2020: $58,604 (Individual Income Tax Returns)
Here:
$58,604
State:
$90,930
Salary/wage: $55,102 (reported on 83.4% of returns)
Here:
$55,102
State:
$72,104
(% of AGI for various income ranges: 962.1% for AGIs below $25k, 3633.8% for AGIs $25k-50k, 7096.4% for AGIs $50k-75k, 11188.5% for AGIs $75k-100k, 19021.4% for AGIs $100k-200k, 108612.1% for AGIs over 200k)
Taxable interest for individuals: $669 (reported on 20.0% of returns)
This zip code:
$669
New York:
$3,075
(% of AGI for various income ranges: 5.0% for AGIs below $25k, 6.9% for AGIs $25k-50k, 9.7% for AGIs $50k-75k, 18.9% for AGIs $75k-100k, 58.3% for AGIs $100k-200k, 633.3% for AGIs over 200k)
Ordinary dividends: $2,780 (reported on 13.2% of returns)
Here:
$2,780
State:
$11,095
(% of AGI for various income ranges: 8.9% for AGIs below $25k, 15.1% for AGIs $25k-50k, 24.2% for AGIs $50k-75k, 56.0% for AGIs $75k-100k, 148.9% for AGIs $100k-200k, 2071.2% for AGIs over 200k)
Net capital gain/loss in AGI: +$16,599 (reported on 12.3% of returns)
Here:
+$16,599
State:
+$44,925
(% of AGI for various income ranges: 4.7% for AGIs below $25k, 17.5% for AGIs $25k-50k, 31.1% for AGIs $50k-75k, 73.3% for AGIs $75k-100k, 303.5% for AGIs $100k-200k, 22186.7% for AGIs over 200k)
Profit/loss from business: +$9,409 (reported on 20.6% of returns)
Here:
+$9,409
State:
+$14,940
(% of AGI for various income ranges: 209.6% for AGIs below $25k, 151.1% for AGIs $25k-50k, 191.4% for AGIs $50k-75k, 267.4% for AGIs $75k-100k, 565.3% for AGIs $100k-200k, 4954.6% for AGIs over 200k)
Taxable individual retirement arrangement distribution: $12,847 (reported on 2.5% of returns)
11225:
$12,847
New York:
$19,609
(% of AGI for various income ranges: 16.7% for AGIs below $25k, 20.5% for AGIs $25k-50k, 35.3% for AGIs $50k-75k, 62.6% for AGIs $75k-100k, 168.4% for AGIs $100k-200k, 779.2% for AGIs over 200k)
Self-employed (Keogh) retirement plans: $22,944 (reported on 0.6% of returns)
11225:
$22,944
New York:
$32,497
(% of AGI for various income ranges: 9.8% for AGIs $50k-75k, 38.7% for AGIs $100k-200k, 1272.9% for AGIs over 200k)
Total itemized deductions: $31,770 (reported on 6.5% of returns)
Here:
$31,770
State:
$39,326
(% of AGI for various income ranges: 20.4% for AGIs below $25k, 63.5% for AGIs $25k-50k, 174.3% for AGIs $50k-75k, 418.8% for AGIs $75k-100k, 1016.1% for AGIs $100k-200k, 10490.4% for AGIs over 200k)
Charity contributions: $12,742 (reported on 5.5% of returns)
Here:
$12,742
State:
$15,420
(% of AGI for various income ranges: 1.5% for AGIs below $25k, 11.8% for AGIs $25k-50k, 39.3% for AGIs $50k-75k, 94.5% for AGIs $75k-100k, 280.6% for AGIs $100k-200k, 5232.1% for AGIs over 200k)
Taxes paid: $8,556 (reported on 6.5% of returns)
11225:
$8,556
State:
$9,183
(% of AGI for various income ranges: 5.3% for AGIs below $25k, 17.3% for AGIs $25k-50k, 55.3% for AGIs $50k-75k, 151.9% for AGIs $75k-100k, 349.5% for AGIs $100k-200k, 1785.4% for AGIs over 200k)
Earned income credit: $1,898 (reported on 17.7% of returns)
Here:
$1,898
State:
$2,138
(% of AGI for various income ranges: 94.3% for AGIs below $25k, 55.4% for AGIs $25k-50k, 0.4% for AGIs $50k-75k)
Percentage of individuals using paid preparers for their 2020 taxes: 94.1%
Here:
94%
State:
95%
(% for various income ranges: 92.1% for AGIs below $25k, 95.3% for AGIs $25k-50k, 94.6% for AGIs $50k-75k, 94.1% for AGIs $75k-100k, 94.9% for AGIs $100k-200k, 97.7% for AGIs over 200k)
Averages for the 2012 tax year for zip code 11225, filed in 2013:
Average Adjusted Gross Income (AGI) in 2012: $38,637 (Individual Income Tax Returns)
Here:
$38,637
State:
$77,088
Salary/wage: $37,667 (reported on 84.8% of returns)
Here:
$37,667
State:
$60,593
(% of AGI for various income ranges: 71.7% for AGIs below $25k, 90.3% for AGIs $25k-50k, 89.4% for AGIs $50k-75k, 87.2% for AGIs $75k-100k, 82.2% for AGIs $100k-200k, 56.5% for AGIs over 200k)
Taxable interest for individuals: $559 (reported on 19.2% of returns)
This zip code:
$559
New York:
$3,125
(% of AGI for various income ranges: 0.3% for AGIs below $25k, 0.1% for AGIs $25k-50k, 0.2% for AGIs $50k-75k, 0.3% for AGIs $75k-100k, 0.5% for AGIs $100k-200k, 0.6% for AGIs over 200k)
Ordinary dividends: $2,736 (reported on 7.8% of returns)
Here:
$2,736
State:
$10,299
(% of AGI for various income ranges: 0.4% for AGIs below $25k, 0.2% for AGIs $25k-50k, 0.3% for AGIs $50k-75k, 0.3% for AGIs $75k-100k, 0.8% for AGIs $100k-200k, 2.3% for AGIs over 200k)
Net capital gain/loss in AGI: +$3,471 (reported on 5.6% of returns)
Here:
+$3,471
State:
+$42,474
(% of AGI for various income ranges: 0.2% for AGIs $75k-100k, 0.8% for AGIs $100k-200k, 3.9% for AGIs over 200k)
Profit/loss from business: +$8,784 (reported on 19.1% of returns)
Here:
+$8,784
State:
+$16,168
(% of AGI for various income ranges: 15.2% for AGIs below $25k, 2.2% for AGIs $25k-50k, 1.4% for AGIs $50k-75k, 1.6% for AGIs $75k-100k, 3.4% for AGIs $100k-200k, 4.8% for AGIs over 200k)
Taxable individual retirement arrangement distribution: $10,105 (reported on 2.7% of returns)
11225:
$10,105
New York:
$17,621
(% of AGI for various income ranges: 0.7% for AGIs below $25k, 0.5% for AGIs $25k-50k, 0.7% for AGIs $50k-75k, 0.7% for AGIs $75k-100k, 1.0% for AGIs $100k-200k, 1.0% for AGIs over 200k)
Self-employment retirement plans: $20,850 (reported on 0.2% of returns)
11225:
$20,850
New York:
$27,330
Total itemized deductions: $19,938 (26% of AGI, reported on 25.6% of returns)
Here:
$19,938
State:
$34,985
Here:
25.9% of AGI
State:
21.3% of AGI
(% of AGI for various income ranges: 4.6% for AGIs below $25k, 9.7% for AGIs $25k-50k, 13.5% for AGIs $50k-75k, 16.5% for AGIs $75k-100k, 18.9% for AGIs $100k-200k, 24.0% for AGIs over 200k)
Charity contributions: $3,893 (reported on 21.7% of returns)
Here:
$3,893
State:
$5,572
(% of AGI for various income ranges: 0.6% for AGIs below $25k, 1.8% for AGIs $25k-50k, 2.5% for AGIs $50k-75k, 2.9% for AGIs $75k-100k, 2.9% for AGIs $100k-200k, 3.0% for AGIs over 200k)
Taxes paid: $7,660 (reported on 25.4% of returns)
11225:
$7,660
State:
$18,656
(% of AGI for various income ranges: 0.8% for AGIs below $25k, 2.5% for AGIs $25k-50k, 4.9% for AGIs $50k-75k, 7.2% for AGIs $75k-100k, 8.9% for AGIs $100k-200k, 11.3% for AGIs over 200k)
Earned income credit: $2,207 (reported on 28.2% of returns)
Here:
$2,207
State:
$2,230
(% of AGI for various income ranges: 8.8% for AGIs below $25k, 1.0% for AGIs $25k-50k)
Percentage of individuals using paid preparers for their 2012 taxes: 63.4%
Here:
63%
State:
66%
(% for various income ranges: 62.9% for AGIs below $25k, 62.7% for AGIs $25k-50k, 61.6% for AGIs $50k-75k, 66.9% for AGIs $75k-100k, 72.1% for AGIs $100k-200k, 79.2% for AGIs over 200k)
Averages for the 2004 tax year for zip code 11225, filed in 2005:
Average Adjusted Gross Income (AGI) in 2004: $29,972 (Individual Income Tax Returns)
Here:
$29,972
State:
$59,519
Salary/wage: $30,392 (reported on 87.0% of returns)
Here:
$30,392
State:
$50,673
(% of AGI for various income ranges: 72.0% for AGIs below $10k, 84.3% for AGIs $10k-25k, 94.5% for AGIs $25k-50k, 91.2% for AGIs $50k-75k, 86.6% for AGIs $75k-100k, 72.6% for AGIs over 100k)
Taxable interest for individuals: $519 (reported on 27.2% of returns)
This zip code:
$519
New York:
$2,377
(% of AGI for various income ranges: 1.1% for AGIs below $10k, 0.5% for AGIs $10k-25k, 0.2% for AGIs $25k-50k, 0.5% for AGIs $50k-75k, 0.8% for AGIs $75k-100k, 0.8% for AGIs over 100k)
Taxable dividends: $1,227 (reported on 7.4% of returns)
Here:
$1,227
State:
$5,394
(% of AGI for various income ranges: 0.5% for AGIs below $10k, 0.2% for AGIs $10k-25k, 0.1% for AGIs $25k-50k, 0.2% for AGIs $50k-75k, 0.4% for AGIs $75k-100k, 1.2% for AGIs over 100k)
Net capital gain/loss: +$3,040 (reported on 5.0% of returns)
Here:
+$3,040
State:
+$23,581
(% of AGI for various income ranges: -0.5% for AGIs below $10k, 0.0% for AGIs $10k-25k, 0.1% for AGIs $25k-50k, 0.2% for AGIs $50k-75k, 0.8% for AGIs $75k-100k, 3.3% for AGIs over 100k)
Profit/loss from business: +$6,481 (reported on 14.5% of returns)
Here:
+$6,481
State:
+$13,809
(% of AGI for various income ranges: 27.7% for AGIs below $10k, 7.0% for AGIs $10k-25k, 0.8% for AGIs $25k-50k, 0.6% for AGIs $50k-75k, 1.0% for AGIs $75k-100k, 3.7% for AGIs over 100k)
IRA payment deduction: $2,264 (reported on 1.6% of returns)
11225:
$2,264
New York:
$3,115
(% of AGI for various income ranges: 0.1% for AGIs below $10k, 0.1% for AGIs $10k-25k, 0.1% for AGIs $25k-50k, 0.1% for AGIs $50k-75k, 0.1% for AGIs $75k-100k, 0.1% for AGIs over 100k)
Self-employed pension: $12,000 (reported on 0.1% of returns)
Here:
$12,000
New York:
$19,016
Total itemized deductions: $16,671 (32% of AGI, reported on 30.1% of returns)
Here:
$16,671
State:
$25,864
Here:
31.8% of AGI
State:
21.9% of AGI
(% of AGI for various income ranges: 4.2% for AGIs below $10k, 8.2% for AGIs $10k-25k, 16.8% for AGIs $25k-50k, 20.6% for AGIs $50k-75k, 21.8% for AGIs $75k-100k, 23.4% for AGIs over 100k)
Charity contributions deductions: $3,993 (8% of AGI, reported on 28.3% of returns)
Here:
$3,993
State:
$4,439
Here:
7.5% of AGI
State:
3.6% of AGI
(% of AGI for various income ranges: 0.4% for AGIs below $10k, 1.5% for AGIs $10k-25k, 3.8% for AGIs $25k-50k, 4.7% for AGIs $50k-75k, 4.8% for AGIs $75k-100k, 5.8% for AGIs over 100k)
Total tax: $3,367 (reported on 66.2% of returns)
11225:
$3,367
State:
$11,730
(% of AGI for various income ranges: 4.8% for AGIs below $10k, 3.3% for AGIs $10k-25k, 5.5% for AGIs $25k-50k, 9.1% for AGIs $50k-75k, 11.2% for AGIs $75k-100k, 16.0% for AGIs over 100k)
Earned income credit: $1,770 (reported on 31.4% of returns)
Here:
$1,770
State:
$1,757
Percentage of individuals using paid preparers for their 2004 taxes: 68.1%
Here:
68%
State:
67%
(% for various income ranges: 65.6% for AGIs below $10k, 70.1% for AGIs $10k-25k, 67.6% for AGIs $25k-50k, 66.6% for AGIs $50k-75k, 73.2% for AGIs $75k-100k, 74.0% for AGIs over 100k)
Likely homosexual households (counted as self-reported same-sex unmarried-partner households)
Lesbian couples: 0.3% of all households
Gay men: 0.3% of all households
Household received Food Stamps/SNAP in the past 12 months: 4,721 Household did not receive Food Stamps/SNAP in the past 12 months: 20,775
Women who had a birth in the past 12 months: 531 (382 now married, 148 unmarried) Women who did not have a birth in the past 12 months: 15,018 (3,479 now married, 11,634 unmarried)
Housing units in zip code 11225 with a mortgage: 3,064 (322 second mortgage, 292 both second mortgage and home equity loan) Houses without a mortgage: 123
Median monthly owner costs for units with a mortgage: $3,088 Median monthly owner costs for units without a mortgage: $1,107
Residents with income below the poverty level in 2022:
This zip code:
15.8%
Whole state:
14.3%
Residents with income below 50% of the poverty level in 2022:
This zip code:
8.8%
Whole state:
6.8%
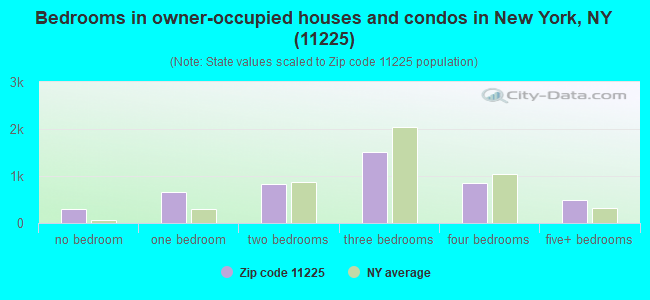
Median number of rooms in houses and condos:
Here:
5.3
State:
6.3
Median number of rooms in apartments:
Here:
3.6
State:
3.8
Notable locations in this zip code not listed on our city pages
Notable locations in zip code 11225: Linden Recreation Hall (A), Fire Department New York City Engine 249 Ladder 113 (B), New York Ladder Company 113 (C). Display/hide their locations on the map
Churches in zip code 11225 include: Brooklyn Miracle Temple (A), Philadelphian Sabbath Cathedral (B), Deeper Life World Outreach (C), Living Word Church of God (D), Jesus of Nazareth Christian Church (E), Victory Church of the Nazarene (F), Grace Reformed Church (G), Marantha Assembly of God Church (H), Upper Room Church of the Nazarene (I). Display/hide their locations on the map
Parks in zip code 11225 include: Doctor Ronald McNair Park (1), Jackie Robinson Playground (2), Doger Playground (3), Marc And Jason's Playground (4). Display/hide their locations on the map
4,893 married couples with children.
2,698 single-parent households (714 men, 1,984 women).
76.0% of residents of 11225 zip code speak English at home.
7.5% of residents speak Spanish at home (72% very well, 18% well, 7% not well, 3% not at all).
11.2% of residents speak other Indo-European language at home (77% very well, 15% well, 8% not well).
1.6% of residents speak Asian or Pacific Island language at home (75% very well, 15% well, 9% not well, 1% not at all).
3.4% of residents speak other language at home (77% very well, 13% well, 11% not well).
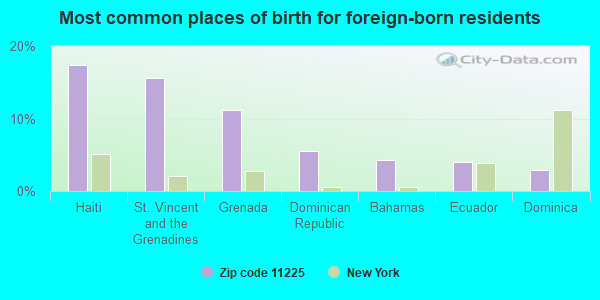
Foreign born population: 19,039 (33.1%) (66.3% of them are naturalized citizens)
This zip code:
33.1%
Whole state:
22.7%
17%Haiti
16%St. Vincent and the Grenadines
11%Grenada
5%Dominican Republic
4%Bahamas
4%Ecuador
3%Dominica
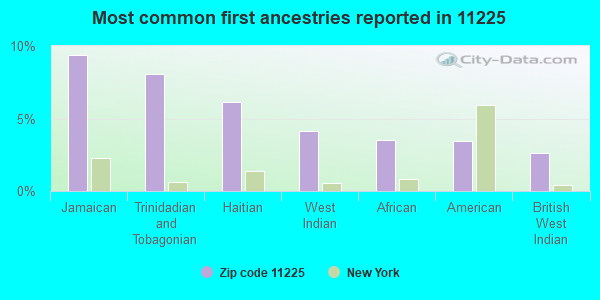
9%Jamaican
8%Trinidadian and Tobagonian
6%Haitian
4%West Indian
3%African
3%American
3%British West Indian
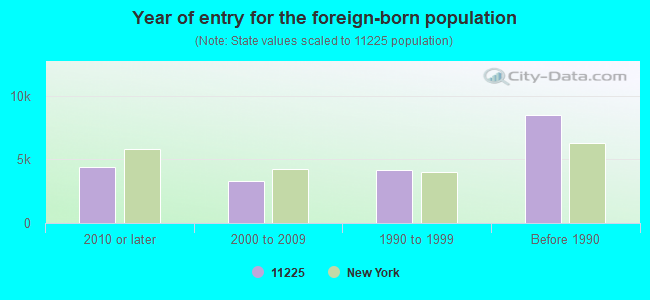
Year of entry for the foreign-born population
4,4102010 or later
3,3022000 to 2009
4,2081990 to 1999
8,499Before 1990
Major facilities with environmental interests located in this zip code:
GROUP HOME ( in BROOKLYN, NY)
(National Center for Education Statistics) - STATE ID-331300898252 (National Center for Education Statistics) - STATE ID-331300898253 (National Center for Education Statistics) - STATE ID-331700894006 (National Center for Education Statistics) - STATE ID-331800894002 (National Center for Education Statistics) - STATE ID-332100891154 (National Center for Education Statistics) - STATE ID-332200894003 Organizations: NEW YORK CITY PUBLIC SCHOOLS (SCHOOL DISTRICT)
1645 BEDFORD CLEANERS (1645 BEDFORD AVENUE in BROOKLYN, NY)
AIR MINOR (AIRS/AFS) STATE MASTER (New York facility tracking) - AIR PROGRAM (Resource Conservation and Recovery Act (tracking hazardous waste)) Business SIC classification: DRYCLEANING PLANTS, EXCEPT RUG CLEANING Business NAICS classification: DRYCLEANING AND LAUNDRY SERVICES (EXCEPT COIN-OPERATED). Organizations: 1645 BEDFORD INC (LEGALLY RESPONSIBLE PARTY)
Alternative names: 1645 BEDFORD INC
ACE FRENCH DRY CLEANERS (619 FLATBUSH AVENUE in BROOKLYN, NY)
AIR MINOR (AIRS/AFS) STATE MASTER (New York facility tracking) - AIR PROGRAM Small Quantity Generators, between 100 kg and 1000 kg of hazardous waste/month (Resource Conservation and Recovery Act (tracking hazardous waste)) - notification Business SIC classification: DRYCLEANING PLANTS, EXCEPT RUG CLEANING Business NAICS classification: DRYCLEANING AND LAUNDRY SERVICES (EXCEPT COIN-OPERATED). Organizations: TONG CHIN CHANG (CONTACT/OWNER)
, BUSY BEE CLEANERS (LEGALLY RESPONSIBLE PARTY)
ANNA CLEANERS (898 NOSTRAND AVENUE in BROOKLYN, NY)
AIR MINOR (AIRS/AFS) STATE MASTER (New York facility tracking) - AIR PROGRAM (Resource Conservation and Recovery Act (tracking hazardous waste)) Business SIC classification: DRYCLEANING PLANTS, EXCEPT RUG CLEANING Business NAICS classification: DRYCLEANING AND LAUNDRY SERVICES (EXCEPT COIN-OPERATED). Alternative names: BAHN CLEANERS, VINNIES DRY CLEANERS
GOODY S CLEANERS (812A FRANKLIN AVE in BROOKLYN, NY)
AIR MINOR (AIRS/AFS) STATE MASTER (New York facility tracking) - AIR PROGRAM, HAZARDOUS WASTE PROGRAM Business SIC classification: DRYCLEANING PLANTS, EXCEPT RUG CLEANING Business NAICS classification: DRYCLEANING AND LAUNDRY SERVICES (EXCEPT COIN-OPERATED). Organizations: MR GOODY CLEANERS (LEGALLY RESPONSIBLE PARTY)
, GOODY S CLEANERS INC (LEGALLY RESPONSIBLE PARTY)
, 812A CLEANERS CORP (LEGALLY RESPONSIBLE PARTY)
Alternative names: GOODY'S CLEANERS INC, GOODY'S FRENCH CLEANERS
AMOCO - 51500479 (250 EMPIRE BLVD in BROOKLYN, NY)
AIR MINOR (AIRS/AFS) STATE MASTER (New York facility tracking) - AIR PROGRAM Business SIC classification: GASOLINE SERVICE STATIONS Organizations: AMOCO OIL CO (LEGALLY RESPONSIBLE PARTY)
AMOCO-513 FLATBUSH AVE (513 FLATBUSH AVE in BROOKLYN, NY)
AIR MINOR (AIRS/AFS) STATE MASTER (New York facility tracking) - AIR PROGRAM Business SIC classification: GASOLINE SERVICE STATIONS Organizations: AMOCO OIL CO (LEGALLY RESPONSIBLE PARTY)
CLARA BARTON HIGH SCHOOL (901 CLASSON AVENUE in BROOKLYN, NY)
STATE MASTER (New York facility tracking) - AIR PROGRAM Small Quantity Generators, between 100 kg and 1000 kg of hazardous waste/month (Resource Conservation and Recovery Act (tracking hazardous waste)) - notification Business SIC and NAICS classification: ELEMENTARY AND SECONDARY SCHOOLS Organizations: NYC BOARD OF EDUCATION (CONTACT/OWNER)
, NYC DEPT OF EDUCATION (LEGALLY RESPONSIBLE PARTY)
Alternative names: NYC BD OF ED - CLARA BARTON H S
CLARA BARTON HS ( in BROOKLYN, NY)
(National Center for Education Statistics) - STATE ID-337800010600 Organizations: NEW YORK CITY PUBLIC SCHOOLS (SCHOOL DISTRICT)
(Integrated Compliance Information System) - ICIS-02-2003-1029, FORMAL ENFORCEMENT ACTION
CON ED - M/H 4797 (BEDFORD AVE & MILWOOD AVE in BROOKLYN, NY)
HAZARDOUS WASTE BIENNIAL REPORTER (Resource Conservation and Recovery Act (tracking hazardous waste)) (Resource Conservation and Recovery Act (tracking hazardous waste))
CON ED - MH 27807 (S/INT NEW YORK AVE & TILDEN AV in BROOKLYN, NY)
HAZARDOUS WASTE BIENNIAL REPORTER (Resource Conservation and Recovery Act (tracking hazardous waste)) (Resource Conservation and Recovery Act (tracking hazardous waste))
CON ED - MH 3122 (BEDFORD AVE & CLARKSON AVE in BROOKLYN, NY)
HAZARDOUS WASTE BIENNIAL REPORTER (Resource Conservation and Recovery Act (tracking hazardous waste)) (Resource Conservation and Recovery Act (tracking hazardous waste))
Housing units lacking complete plumbing facilities: 1.2% Housing units lacking complete kitchen facilities: 2.4%
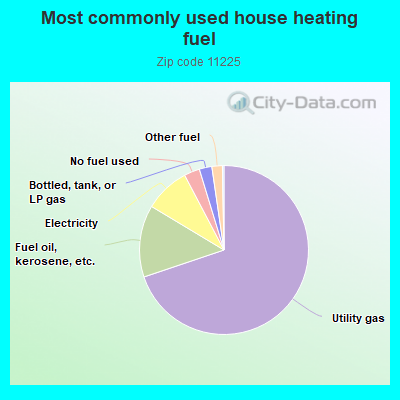
69.9%Utility gas
13.8%Fuel oil, kerosene, etc.
8.7%Electricity
3.0%No fuel used
2.4%Bottled, tank, or LP gas
2.0%Other fuel
Population in 1990: 66,752.
Place of birth for U.S.-born residents:
This state: 25,085
Northeast: 3,665
Midwest: 2,034
South: 3,954
West: 2,304
70% of the 11225 zip code residents lived in the same house 5 years ago. Out of people who lived in different houses, 79% lived in this county. Out of people who lived in different counties, 50% lived in New York.
88% of the 11225 zip code residents lived in the same house 1 year ago. Out of people who lived in different houses, 56% moved from this county. Out of people who lived in different houses, 23% moved from different county within same state. Out of people who lived in different houses, 18% moved from different state. Out of people who lived in different houses, 4% moved from abroad.
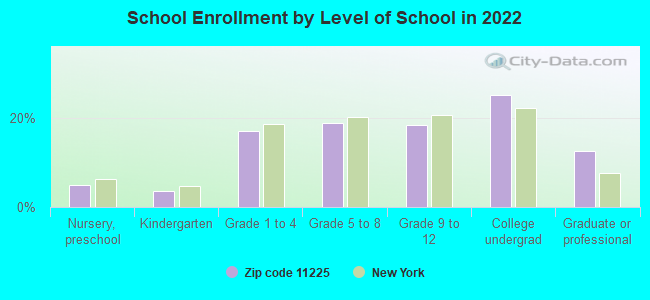
Private vs. public school enrollment:
Students in private schools in grades 1 to 8 (elementary and middle school): 1,120
Here:
26.5%
New York:
15.6%
Students in private schools in grades 9 to 12 (high school): 403
Here:
18.6%
New York:
15.0%
Students in private undergraduate colleges: 1,238
Here:
42.0%
New York:
39.2%
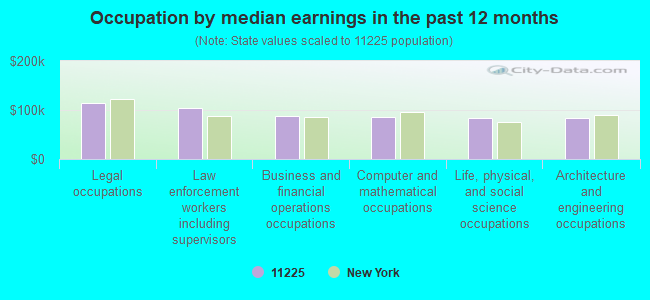
Occupation by median earnings in the past 12 months ($)
115,216Legal occupations
103,308Law enforcement workers including supervisors
87,080Business and financial operations occupations
84,773Computer and mathematical occupations
84,375Life, physical, and social science occupations
82,677Architecture and engineering occupations
Top industries in this zip code by the number of employees in 2005:
Health Care and Social Assistance: Child Day Care Services (50-99 employees: 2 establishments, 20-49 employees: 3 establishments, 10-19 employees: 6 establishments, 5-9 employees: 2 establishments, 1-4 employees: 15 establishments)
Real Estate and Rental and Leasing: Lessors of Residential Buildings and Dwellings (50-99: 1, 20-49: 1, 10-19: 1, 5-9: 6, 1-4: 56)
2007 - 2018 National Fire Incident Reporting System (NFIRS) incidents
According to the data from the years 2007 - 2018 the average number of fires per year is 244. The highest number of reported fires - 293 took place in 2008, and the least - 201 in 2017. The data has a decreasing trend.
When looking into fire subcategories, the most reports belonged to: Structure Fires (78.9%), and Outside Fires (13.3%).
Fire incident types reported to NFIRS in Zip Code 11225


 Nearest zip codes: 11226, 11216, 11238, 11213, 11203, 11218.


 According to the data from the years 2007 - 2018 the average number of fires per year is 244. The highest number of reported fires - 293 took place in 2008, and the least - 201 in 2017. The data has a decreasing trend.
 When looking into fire subcategories, the most reports belonged to: Structure Fires (78.9%), and Outside Fires (13.3%).