Estimated zip code population in 2022: 99,449 Zip code population in 2010: 101,572 Zip code population in 2000: 106,154
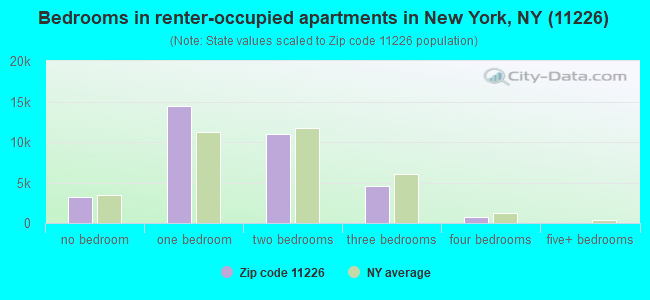
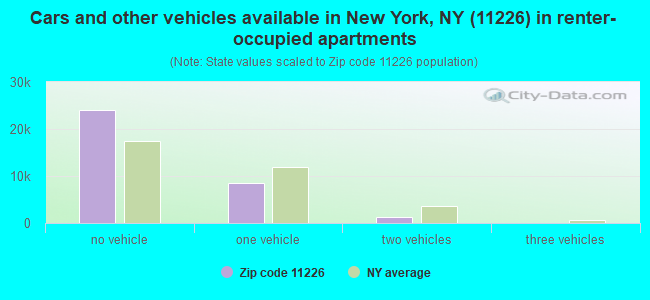
Houses and condos: 42,270 Renter-occupied apartments: 33,920
% of renters here:
86%
State:
46%
March 2022 cost of living index in zip code 11226: 154.2 (very high, U.S. average is 100)
Land area: 1.3 sq. mi. Water area: 0.0 sq. mi.
Population density: 77,129 people per square mile
(very high).
OSM Map
General Map
Google Map
MSN Map
OSM Map
General Map
Google Map
MSN Map
OSM Map
General Map
Google Map
MSN Map
OSM Map
General Map
Google Map
MSN Map
Please wait while loading the map...
Real estate property taxes paid for housing units in 2022:
This zip code:
0.5% ($4,262)
New York:
1.5% ($6,180)
Median real estate property taxes paid for housing units with mortgages in 2022: $4,153 (0.5%) Median real estate property taxes paid for housing units with no mortgage in 2022: $4,584 (0.6%)
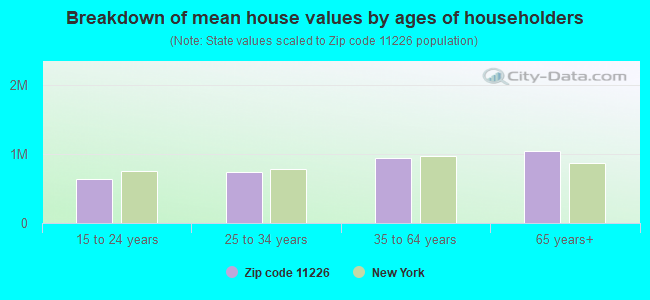
Estimated median house/condo value in 2022: $841,247
11226:
$841,247
New York:
$400,400
According to our research of New York and other state lists, there were 93 registered sex offenders living in 11226 zip code as of April 26, 2024. The ratio of all residents to sex offenders in zip code 11226 is 1,110 to 1. The ratio of registered sex offenders to all residents in this zip code is near the state average.
Median resident age:
This zip code:
36.3 years
New York median age:
40.0 years
Average household size:
This zip code:
2.5 people
New York:
2.5 people
Averages for the 2020 tax year for zip code 11226, filed in 2021:
Average Adjusted Gross Income (AGI) in 2020: $48,104 (Individual Income Tax Returns)
Here:
$48,104
State:
$90,930
Salary/wage: $46,655 (reported on 83.5% of returns)
Here:
$46,655
State:
$72,104
(% of AGI for various income ranges: 1024.2% for AGIs below $25k, 3674.0% for AGIs $25k-50k, 7065.8% for AGIs $50k-75k, 10773.2% for AGIs $75k-100k, 18830.0% for AGIs $100k-200k, 80505.9% for AGIs over 200k)
Taxable interest for individuals: $562 (reported on 15.0% of returns)
This zip code:
$562
New York:
$3,075
(% of AGI for various income ranges: 3.1% for AGIs below $25k, 3.0% for AGIs $25k-50k, 7.8% for AGIs $50k-75k, 16.1% for AGIs $75k-100k, 37.0% for AGIs $100k-200k, 644.1% for AGIs over 200k)
Ordinary dividends: $2,568 (reported on 8.5% of returns)
Here:
$2,568
State:
$11,095
(% of AGI for various income ranges: 5.2% for AGIs below $25k, 6.3% for AGIs $25k-50k, 15.5% for AGIs $50k-75k, 43.7% for AGIs $75k-100k, 127.0% for AGIs $100k-200k, 1715.5% for AGIs over 200k)
Net capital gain/loss in AGI: +$6,672 (reported on 8.7% of returns)
Here:
+$6,672
State:
+$44,925
(% of AGI for various income ranges: 2.9% for AGIs below $25k, 7.0% for AGIs $25k-50k, 17.4% for AGIs $50k-75k, 51.8% for AGIs $75k-100k, 265.2% for AGIs $100k-200k, 7276.2% for AGIs over 200k)
Profit/loss from business: +$8,567 (reported on 19.2% of returns)
Here:
+$8,567
State:
+$14,940
(% of AGI for various income ranges: 214.0% for AGIs below $25k, 97.1% for AGIs $25k-50k, 94.9% for AGIs $50k-75k, 174.0% for AGIs $75k-100k, 481.5% for AGIs $100k-200k, 8187.9% for AGIs over 200k)
Taxable individual retirement arrangement distribution: $13,886 (reported on 2.0% of returns)
11226:
$13,886
New York:
$19,609
(% of AGI for various income ranges: 14.5% for AGIs below $25k, 13.9% for AGIs $25k-50k, 33.5% for AGIs $50k-75k, 61.2% for AGIs $75k-100k, 162.6% for AGIs $100k-200k, 1116.9% for AGIs over 200k)
Self-employed (Keogh) retirement plans: $20,211 (reported on 0.4% of returns)
11226:
$20,211
New York:
$32,497
(% of AGI for various income ranges: 9.6% for AGIs $50k-75k, 34.8% for AGIs $100k-200k, 825.2% for AGIs over 200k)
Total itemized deductions: $26,930 (reported on 5.0% of returns)
Here:
$26,930
State:
$39,326
(% of AGI for various income ranges: 24.7% for AGIs below $25k, 54.5% for AGIs $25k-50k, 170.7% for AGIs $50k-75k, 398.7% for AGIs $75k-100k, 963.7% for AGIs $100k-200k, 5714.5% for AGIs over 200k)
Charity contributions: $7,086 (reported on 4.0% of returns)
Here:
$7,086
State:
$15,420
(% of AGI for various income ranges: 1.7% for AGIs below $25k, 8.5% for AGIs $25k-50k, 35.3% for AGIs $50k-75k, 96.2% for AGIs $75k-100k, 232.3% for AGIs $100k-200k, 1213.8% for AGIs over 200k)
Taxes paid: $8,266 (reported on 5.0% of returns)
11226:
$8,266
State:
$9,183
(% of AGI for various income ranges: 4.5% for AGIs below $25k, 13.8% for AGIs $25k-50k, 54.3% for AGIs $50k-75k, 137.8% for AGIs $75k-100k, 349.1% for AGIs $100k-200k, 1392.8% for AGIs over 200k)
Earned income credit: $1,971 (reported on 20.5% of returns)
Here:
$1,971
State:
$2,138
(% of AGI for various income ranges: 100.3% for AGIs below $25k, 60.1% for AGIs $25k-50k, 0.3% for AGIs $50k-75k)
Percentage of individuals using paid preparers for their 2020 taxes: 94.0%
Here:
94%
State:
95%
(% for various income ranges: 91.7% for AGIs below $25k, 95.5% for AGIs $25k-50k, 95.0% for AGIs $50k-75k, 94.9% for AGIs $75k-100k, 94.9% for AGIs $100k-200k, 96.7% for AGIs over 200k)
Averages for the 2012 tax year for zip code 11226, filed in 2013:
Average Adjusted Gross Income (AGI) in 2012: $33,386 (Individual Income Tax Returns)
Here:
$33,386
State:
$77,088
Salary/wage: $33,680 (reported on 84.6% of returns)
Here:
$33,680
State:
$60,593
(% of AGI for various income ranges: 73.5% for AGIs below $25k, 92.9% for AGIs $25k-50k, 91.7% for AGIs $50k-75k, 88.9% for AGIs $75k-100k, 84.9% for AGIs $100k-200k, 60.6% for AGIs over 200k)
Taxable interest for individuals: $458 (reported on 14.4% of returns)
This zip code:
$458
New York:
$3,125
(% of AGI for various income ranges: 0.2% for AGIs below $25k, 0.1% for AGIs $25k-50k, 0.1% for AGIs $50k-75k, 0.2% for AGIs $75k-100k, 0.3% for AGIs $100k-200k, 0.7% for AGIs over 200k)
Ordinary dividends: $2,094 (reported on 5.1% of returns)
Here:
$2,094
State:
$10,299
(% of AGI for various income ranges: 0.2% for AGIs below $25k, 0.1% for AGIs $25k-50k, 0.2% for AGIs $50k-75k, 0.3% for AGIs $75k-100k, 0.7% for AGIs $100k-200k, 1.5% for AGIs over 200k)
Net capital gain/loss in AGI: +$6,681 (reported on 3.8% of returns)
Here:
+$6,681
State:
+$42,474
(% of AGI for various income ranges: 0.5% for AGIs $100k-200k, 10.8% for AGIs over 200k)
Profit/loss from business: +$8,564 (reported on 18.4% of returns)
Here:
+$8,564
State:
+$16,168
(% of AGI for various income ranges: 16.8% for AGIs below $25k, 1.6% for AGIs $25k-50k, 1.0% for AGIs $50k-75k, 1.4% for AGIs $75k-100k, 1.9% for AGIs $100k-200k, 4.6% for AGIs over 200k)
Taxable individual retirement arrangement distribution: $11,499 (reported on 2.0% of returns)
11226:
$11,499
New York:
$17,621
(% of AGI for various income ranges: 0.4% for AGIs below $25k, 0.4% for AGIs $25k-50k, 0.6% for AGIs $50k-75k, 0.8% for AGIs $75k-100k, 1.2% for AGIs $100k-200k, 1.9% for AGIs over 200k)
Self-employment retirement plans: $16,462 (reported on 0.2% of returns)
11226:
$16,462
New York:
$27,330
(% of AGI for various income ranges: 0.1% for AGIs $75k-100k, 0.9% for AGIs over 200k)
Total itemized deductions: $18,388 (27% of AGI, reported on 22.2% of returns)
Here:
$18,388
State:
$34,985
Here:
26.7% of AGI
State:
21.3% of AGI
(% of AGI for various income ranges: 3.9% for AGIs below $25k, 10.6% for AGIs $25k-50k, 14.4% for AGIs $50k-75k, 16.9% for AGIs $75k-100k, 19.1% for AGIs $100k-200k, 18.4% for AGIs over 200k)
Charity contributions: $3,496 (reported on 18.8% of returns)
Here:
$3,496
State:
$5,572
(% of AGI for various income ranges: 0.5% for AGIs below $25k, 1.9% for AGIs $25k-50k, 2.6% for AGIs $50k-75k, 2.8% for AGIs $75k-100k, 2.7% for AGIs $100k-200k, 2.4% for AGIs over 200k)
Taxes paid: $6,765 (reported on 22.0% of returns)
11226:
$6,765
State:
$18,656
(% of AGI for various income ranges: 0.9% for AGIs below $25k, 2.5% for AGIs $25k-50k, 5.0% for AGIs $50k-75k, 7.1% for AGIs $75k-100k, 8.8% for AGIs $100k-200k, 11.1% for AGIs over 200k)
Earned income credit: $2,300 (reported on 34.8% of returns)
Here:
$2,300
State:
$2,230
(% of AGI for various income ranges: 10.1% for AGIs below $25k, 1.3% for AGIs $25k-50k)
Percentage of individuals using paid preparers for their 2012 taxes: 69.5%
Here:
70%
State:
66%
(% for various income ranges: 70.1% for AGIs below $25k, 68.5% for AGIs $25k-50k, 68.7% for AGIs $50k-75k, 70.1% for AGIs $75k-100k, 69.0% for AGIs $100k-200k, 79.3% for AGIs over 200k)
Averages for the 2004 tax year for zip code 11226, filed in 2005:
Average Adjusted Gross Income (AGI) in 2004: $27,966 (Individual Income Tax Returns)
Here:
$27,966
State:
$59,519
Salary/wage: $28,646 (reported on 87.9% of returns)
Here:
$28,646
State:
$50,673
(% of AGI for various income ranges: 73.9% for AGIs below $10k, 87.3% for AGIs $10k-25k, 96.4% for AGIs $25k-50k, 93.9% for AGIs $50k-75k, 91.5% for AGIs $75k-100k, 69.9% for AGIs over 100k)
Taxable interest for individuals: $499 (reported on 23.7% of returns)
This zip code:
$499
New York:
$2,377
(% of AGI for various income ranges: 0.9% for AGIs below $10k, 0.3% for AGIs $10k-25k, 0.3% for AGIs $25k-50k, 0.4% for AGIs $50k-75k, 0.5% for AGIs $75k-100k, 0.9% for AGIs over 100k)
Taxable dividends: $1,353 (reported on 5.4% of returns)
Here:
$1,353
State:
$5,394
(% of AGI for various income ranges: 0.4% for AGIs below $10k, 0.1% for AGIs $10k-25k, 0.1% for AGIs $25k-50k, 0.3% for AGIs $50k-75k, 0.2% for AGIs $75k-100k, 1.1% for AGIs over 100k)
Net capital gain/loss: +$4,822 (reported on 3.5% of returns)
Here:
+$4,822
State:
+$23,581
(% of AGI for various income ranges: -0.5% for AGIs below $10k, 0.0% for AGIs $10k-25k, -0.0% for AGIs $25k-50k, 0.2% for AGIs $50k-75k, 0.1% for AGIs $75k-100k, 5.5% for AGIs over 100k)
Profit/loss from business: +$6,678 (reported on 14.7% of returns)
Here:
+$6,678
State:
+$13,809
(% of AGI for various income ranges: 30.0% for AGIs below $10k, 7.9% for AGIs $10k-25k, 0.7% for AGIs $25k-50k, 0.4% for AGIs $50k-75k, 1.0% for AGIs $75k-100k, 2.3% for AGIs over 100k)
IRA payment deduction: $2,268 (reported on 1.4% of returns)
11226:
$2,268
New York:
$3,115
(% of AGI for various income ranges: 0.1% for AGIs below $10k, 0.1% for AGIs $10k-25k, 0.1% for AGIs $25k-50k, 0.1% for AGIs $50k-75k, 0.1% for AGIs $75k-100k, 0.1% for AGIs over 100k)
Self-employed pension: $12,427 (reported on 0.2% of returns)
Here:
$12,427
New York:
$19,016
(% of AGI for various income ranges: 0.0% for AGIs $10k-25k, 0.0% for AGIs $50k-75k, 0.6% for AGIs over 100k)
Total itemized deductions: $16,205 (32% of AGI, reported on 27.7% of returns)
Here:
$16,205
State:
$25,864
Here:
31.8% of AGI
State:
21.9% of AGI
(% of AGI for various income ranges: 3.3% for AGIs below $10k, 7.1% for AGIs $10k-25k, 17.5% for AGIs $25k-50k, 21.1% for AGIs $50k-75k, 23.1% for AGIs $75k-100k, 19.3% for AGIs over 100k)
Charity contributions deductions: $3,610 (7% of AGI, reported on 26.0% of returns)
Here:
$3,610
State:
$4,439
Here:
7.0% of AGI
State:
3.6% of AGI
(% of AGI for various income ranges: 0.3% for AGIs below $10k, 1.3% for AGIs $10k-25k, 3.9% for AGIs $25k-50k, 4.5% for AGIs $50k-75k, 4.3% for AGIs $75k-100k, 3.8% for AGIs over 100k)
Total tax: $3,082 (reported on 63.1% of returns)
11226:
$3,082
State:
$11,730
(% of AGI for various income ranges: 5.0% for AGIs below $10k, 3.1% for AGIs $10k-25k, 5.0% for AGIs $25k-50k, 8.6% for AGIs $50k-75k, 11.1% for AGIs $75k-100k, 17.2% for AGIs over 100k)
Earned income credit: $1,826 (reported on 36.4% of returns)
Here:
$1,826
State:
$1,757
Percentage of individuals using paid preparers for their 2004 taxes: 70.2%
Here:
70%
State:
67%
(% for various income ranges: 68.4% for AGIs below $10k, 72.9% for AGIs $10k-25k, 68.6% for AGIs $25k-50k, 68.6% for AGIs $50k-75k, 72.4% for AGIs $75k-100k, 73.2% for AGIs over 100k)
Likely homosexual households (counted as self-reported same-sex unmarried-partner households)
Lesbian couples: 0.4% of all households
Gay men: 0.1% of all households
Household received Food Stamps/SNAP in the past 12 months: 10,908 Household did not receive Food Stamps/SNAP in the past 12 months: 28,936
Women who had a birth in the past 12 months: 710 (437 now married, 275 unmarried) Women who did not have a birth in the past 12 months: 27,677 (8,378 now married, 19,381 unmarried)
Housing units in zip code 11226 with a mortgage: 3,979 (278 second mortgage, 22 home equity loan, 187 both second mortgage and home equity loan) Houses without a mortgage: 131
Median monthly owner costs for units with a mortgage: $2,964 Median monthly owner costs for units without a mortgage: $1,101
Residents with income below the poverty level in 2022:
This zip code:
15.1%
Whole state:
14.3%
Residents with income below 50% of the poverty level in 2022:
This zip code:
7.6%
Whole state:
6.8%
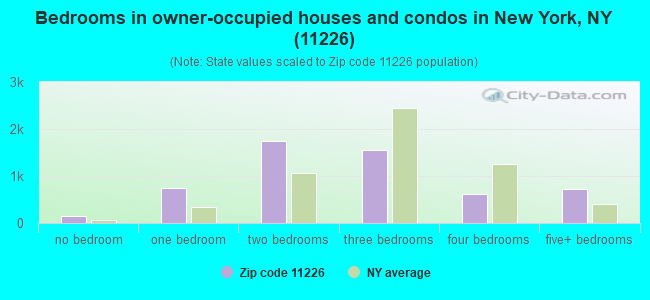
Median number of rooms in houses and condos:
Here:
5.2
State:
6.3
Median number of rooms in apartments:
Here:
3.6
State:
3.8
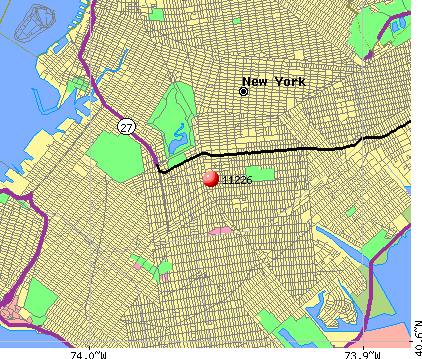
Notable locations in this zip code not listed on our city pages
Notable locations in zip code 11226: Flatbush Branch Brooklyn Public Library (A), Flatbush Boys Club (B), New York Congreagational Home for the Aged (C), Loew's Kings Theater (D), Shaair Torah Community Center (E), Erasmus Hall Museum (F), Fire Department New York City Engine 248 Battalion 44 (G), Flatbush Town Hall (H). Display/hide their locations on the map
Churches in zip code 11226 include: Kingdom Hall of Jehovahs Witnesses (A), Redemption Gospel Outreach (B), Immanuel Tabernacle (C), Pilgrim Wesleyan Church (D), Prospect Park Temple Issac (E), Flatbush-Tompkins Church (F), Christis Community Christian Missionary Alliance Church (G), Baptist Church of The Redeemer (H), Christian Community Alliance (I). Display/hide their locations on the map
Parks in zip code 11226 include: Captain Oakley Junior Square (1), Albemarle-Kenmore Terraces Historic District (2), Ditmus Park Historic District (3), Lott Park (4), Rolf Henry Playground (5), Parkside Playground (6), Umma Park (7). Display/hide their locations on the map
7,908 married couples with children.
6,400 single-parent households (893 men, 5,507 women).
67.1% of residents of 11226 zip code speak English at home.
11.9% of residents speak Spanish at home (63% very well, 18% well, 15% not well, 4% not at all).
15.5% of residents speak other Indo-European language at home (62% very well, 21% well, 16% not well, 1% not at all).
1.7% of residents speak Asian or Pacific Island language at home (61% very well, 17% well, 10% not well, 12% not at all).
3.2% of residents speak other language at home (70% very well, 22% well, 8% not well).
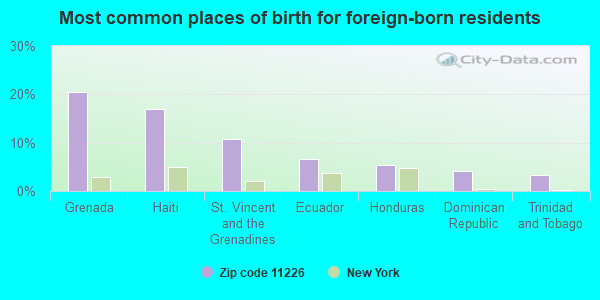
Foreign born population: 42,452 (42.7%) (63.9% of them are naturalized citizens)
This zip code:
42.7%
Whole state:
22.7%
21%Grenada
17%Haiti
11%St. Vincent and the Grenadines
7%Ecuador
5%Honduras
4%Dominican Republic
3%Trinidad and Tobago
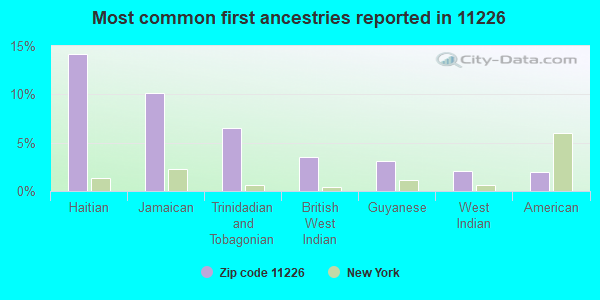
14%Haitian
10%Jamaican
7%Trinidadian and Tobagonian
3%British West Indian
3%Guyanese
2%West Indian
2%American
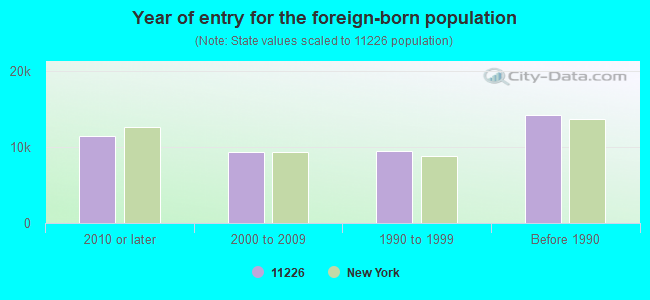
Year of entry for the foreign-born population
11,4462010 or later
9,3312000 to 2009
9,4141990 to 1999
14,192Before 1990
Major facilities with environmental interests located in this zip code:
J & H FRENCH CLEANERS (3011 CHURCH AVENUE in BROOKLYN, NY)
AIR MINOR (AIRS/AFS) STATE MASTER (New York facility tracking) - AIR PROGRAM Small Quantity Generators, between 100 kg and 1000 kg of hazardous waste/month (Resource Conservation and Recovery Act (tracking hazardous waste)) - notification Business SIC classification: DRYCLEANING PLANTS, EXCEPT RUG CLEANING Business NAICS classification: DRYCLEANING AND LAUNDRY SERVICES (EXCEPT COIN-OPERATED). Organizations: BYUNG KYU JO (CONTACT/OWNER)
, J & H FRENCH CLEANERS INC (LEGALLY RESPONSIBLE PARTY)
J S CLEANERS (1602 NEWKIRK AVE in BROOKLYN, NY)
AIR MINOR (AIRS/AFS) STATE MASTER (New York facility tracking) - AIR PROGRAM Conditionally Exempt Small Quantity Generators, less than 100 kg/month of hazardous waste (Resource Conservation and Recovery Act (tracking hazardous waste)) - notification Business SIC classification: DRYCLEANING PLANTS, EXCEPT RUG CLEANING Business NAICS classification: DRYCLEANING AND LAUNDRY SERVICES (EXCEPT COIN-OPERATED). Organizations: J S FRENCH CLEANERS (CONTACT/OWNER)
, J S FRENCH CLEANERS INC (LEGALLY RESPONSIBLE PARTY)
Alternative names: J S FRENCH CLEANERS
COURTESY CLEANERS (1250 FLATBUSH AVENUE in BROOKLYN, NY)
AIR MINOR (AIRS/AFS) STATE MASTER (New York facility tracking) - AIR PROGRAM, HAZARDOUS WASTE PROGRAM Small Quantity Generators, between 100 kg and 1000 kg of hazardous waste/month (Resource Conservation and Recovery Act (tracking hazardous waste)) Business SIC classification: DRYCLEANING PLANTS, EXCEPT RUG CLEANING Business NAICS classification: DRYCLEANING AND LAUNDRY SERVICES (EXCEPT COIN-OPERATED). Organizations: NANA CLEANERS INC (LEGALLY RESPONSIBLE PARTY)
CON ED (AVENUE D AND FLATBUSH AVENUE in BROOKLYN, NY)
HAZARDOUS WASTE BIENNIAL REPORTER (Resource Conservation and Recovery Act (tracking hazardous waste)) (Resource Conservation and Recovery Act (tracking hazardous waste)) Alternative names: CON ED - M/H 36074, CON ED - MH 36074
865 ROGERS AVENUE SERVICE CENTER (865 ROGERS AVE in BROOKLYN, NY)
(Integrated Compliance Information System) - ICIS-02-1997-0297, FORMAL ENFORCEMENT ACTION (Resource Conservation and Recovery Act (tracking hazardous waste)) Business SIC classification: GASOLINE SERVICE STATIONS
IS 246 WALT WHITMAN IS ( in BROOKLYN, NY)
(National Center for Education Statistics) - STATE ID-338500010246 Organizations: NEW YORK CITY PUBLIC SCHOOLS (SCHOOL DISTRICT)
CLAREDON ROAD GROUP HOME ( in BROOKLYN, NY)
(National Center for Education Statistics) - STATE ID-332200890211 Organizations: NEW YORK CITY PUBLIC SCHOOLS (SCHOOL DISTRICT)
AMOCO SERVICE STATION (2193 BEDFORD AVE in BROOKLYN, NY)
(Integrated Compliance Information System) - ICIS-02-1997-0297, FORMAL ENFORCEMENT ACTION
INTERMEDIATE SCHOOL 246 (WALT WHITMAN IS) (72 VERONICA AVENUE in BROOKLYN, NY)
Housing units lacking complete plumbing facilities: 0.7% Housing units lacking complete kitchen facilities: 1.1%
81.5%Utility gas
7.3%Electricity
6.2%Fuel oil, kerosene, etc.
2.2%Bottled, tank, or LP gas
1.7%No fuel used
1.0%Other fuel
Population in 1990: 111,396.
Place of birth for U.S.-born residents:
This state: 43,867
Northeast: 3,094
Midwest: 1,871
South: 3,849
West: 2,390
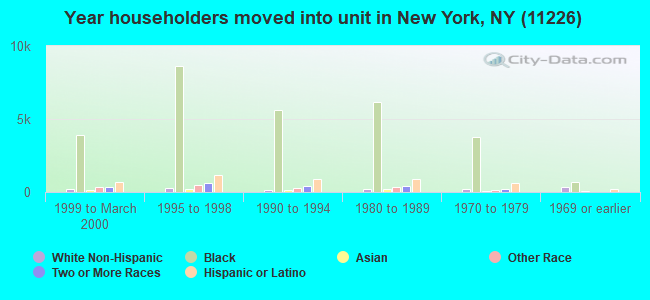
67% of the 11226 zip code residents lived in the same house 5 years ago. Out of people who lived in different houses, 84% lived in this county. Out of people who lived in different counties, 50% lived in New York.
92% of the 11226 zip code residents lived in the same house 1 year ago. Out of people who lived in different houses, 61% moved from this county. Out of people who lived in different houses, 20% moved from different county within same state. Out of people who lived in different houses, 13% moved from different state. Out of people who lived in different houses, 5% moved from abroad.
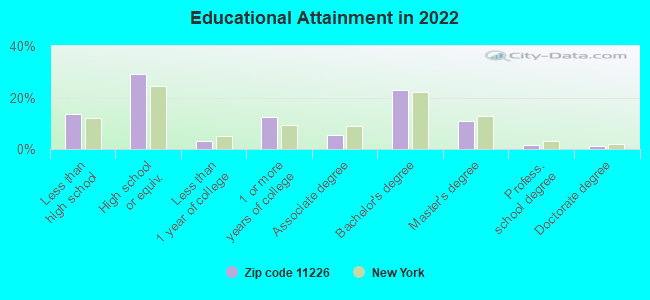
Private vs. public school enrollment:
Students in private schools in grades 1 to 8 (elementary and middle school): 964
Here:
12.2%
New York:
15.6%
Students in private schools in grades 9 to 12 (high school): 233
Here:
5.3%
New York:
15.0%
Students in private undergraduate colleges: 1,748
Here:
33.8%
New York:
39.2%
Occupation by median earnings in the past 12 months ($)
98,904Legal occupations
95,433Computer and mathematical occupations
85,377Health diagnosing and treating practitioners and other technical occupations
83,088Architecture and engineering occupations
81,635Management occupations
78,202Life, physical, and social science occupations
Companies with federal contracts located in this zip code:
CHANNEL REALTY CO OF N A CORP (1713 NOSTRAND AVE in BROOKLYN, NY; small business)
$5,000 with Army for Real Property Appraisals Services (SIC 6531). Signed on 2005-12-01. Completion date: 2005-11-14.
DATA RECOVERY SERVICE, INC (1620 DITMAS AVENUE in BROOKLYN, NY; small business)
$3,975 with Army for ADP Input/Output and Storage Devices. Signed on 2001-09-30. Completion date: 2001-10-02.
Top industries in this zip code by the number of employees in 2005:
2007 - 2018 National Fire Incident Reporting System (NFIRS) incidents
According to the data from the years 2007 - 2018 the average number of fires per year is 508. The highest number of reported fires - 633 took place in 2008, and the least - 432 in 2018. The data has a decreasing trend.
When looking into fire subcategories, the most reports belonged to: Structure Fires (79.1%), and Outside Fires (11.9%).
Fire incident types reported to NFIRS in Zip Code 11226

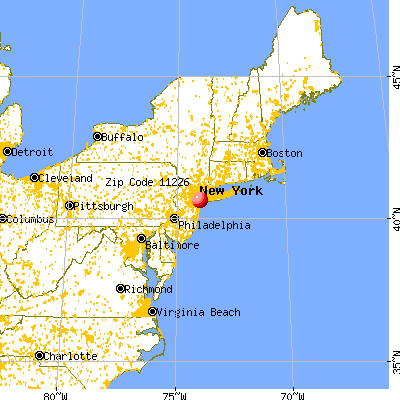


 Nearest zip codes: 11225, 11218, 11210, 11203, 11230, 11213.


 According to the data from the years 2007 - 2018 the average number of fires per year is 508. The highest number of reported fires - 633 took place in 2008, and the least - 432 in 2018. The data has a decreasing trend.
 When looking into fire subcategories, the most reports belonged to: Structure Fires (79.1%), and Outside Fires (11.9%).