Estimated zip code population in 2022: 77,260 Zip code population in 2010: 76,174 Zip code population in 2000: 84,498
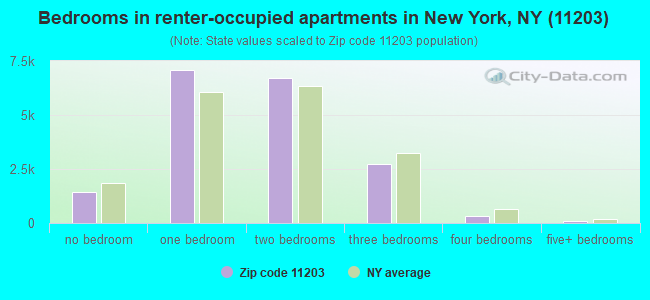
Houses and condos: 33,095 Renter-occupied apartments: 18,397
% of renters here:
61%
State:
46%
March 2022 cost of living index in zip code 11203: 151.7 (very high, U.S. average is 100)
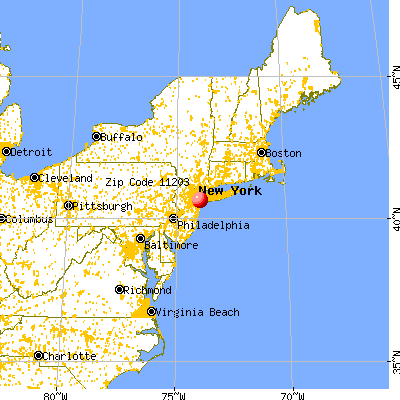
Land area: 2.1 sq. mi. Water area: 0.0 sq. mi.
Population density: 36,009 people per square mile
(very high).
OSM Map
General Map
Google Map
MSN Map
OSM Map
General Map
Google Map
MSN Map
OSM Map
General Map
Google Map
MSN Map
OSM Map
General Map
Google Map
MSN Map
Please wait while loading the map...
Real estate property taxes paid for housing units in 2022:
This zip code:
0.7% ($4,967)
New York:
1.5% ($6,180)
Median real estate property taxes paid for housing units with mortgages in 2022: $4,995 (0.7%) Median real estate property taxes paid for housing units with no mortgage in 2022: $4,935 (0.7%)
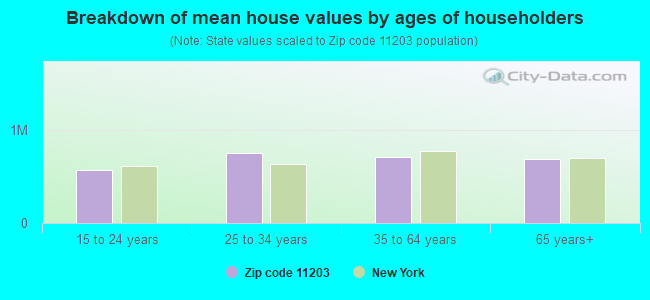
Estimated median house/condo value in 2022: $673,831
11203:
$673,831
New York:
$400,400
According to our research of New York and other state lists, there were 64 registered sex offenders living in 11203 zip code as of April 27, 2024. The ratio of all residents to sex offenders in zip code 11203 is 1,203 to 1. The ratio of registered sex offenders to all residents in this zip code is lower than the state average.
Median resident age:
This zip code:
43.1 years
New York median age:
40.0 years
Average household size:
This zip code:
2.5 people
New York:
2.5 people
Averages for the 2020 tax year for zip code 11203, filed in 2021:
Average Adjusted Gross Income (AGI) in 2020: $45,661 (Individual Income Tax Returns)
Here:
$45,661
State:
$90,930
Salary/wage: $45,235 (reported on 81.3% of returns)
Here:
$45,235
State:
$72,104
(% of AGI for various income ranges: 964.2% for AGIs below $25k, 3645.6% for AGIs $25k-50k, 6865.5% for AGIs $50k-75k, 10494.3% for AGIs $75k-100k, 17100.3% for AGIs $100k-200k, 59656.4% for AGIs over 200k)
Taxable interest for individuals: $347 (reported on 17.6% of returns)
This zip code:
$347
New York:
$3,075
(% of AGI for various income ranges: 4.3% for AGIs below $25k, 4.4% for AGIs $25k-50k, 8.7% for AGIs $50k-75k, 13.2% for AGIs $75k-100k, 32.7% for AGIs $100k-200k, 165.5% for AGIs over 200k)
Ordinary dividends: $1,222 (reported on 7.0% of returns)
Here:
$1,222
State:
$11,095
(% of AGI for various income ranges: 4.6% for AGIs below $25k, 3.5% for AGIs $25k-50k, 11.5% for AGIs $50k-75k, 16.2% for AGIs $75k-100k, 45.8% for AGIs $100k-200k, 638.2% for AGIs over 200k)
Net capital gain/loss in AGI: +$2,885 (reported on 6.9% of returns)
Here:
+$2,885
State:
+$44,925
(% of AGI for various income ranges: 0.6% for AGIs below $25k, 1.2% for AGIs $25k-50k, 9.8% for AGIs $50k-75k, 22.3% for AGIs $75k-100k, 182.2% for AGIs $100k-200k, 2871.8% for AGIs over 200k)
Profit/loss from business: +$5,417 (reported on 16.3% of returns)
Here:
+$5,417
State:
+$14,940
(% of AGI for various income ranges: 190.1% for AGIs below $25k, 48.4% for AGIs $25k-50k, 40.3% for AGIs $50k-75k, 65.8% for AGIs $75k-100k, 208.6% for AGIs $100k-200k, 3705.5% for AGIs over 200k)
Taxable individual retirement arrangement distribution: $12,667 (reported on 3.1% of returns)
11203:
$12,667
New York:
$19,609
(% of AGI for various income ranges: 22.0% for AGIs below $25k, 24.3% for AGIs $25k-50k, 50.6% for AGIs $50k-75k, 88.6% for AGIs $75k-100k, 250.6% for AGIs $100k-200k, 1424.5% for AGIs over 200k)
Total itemized deductions: $26,439 (reported on 9.2% of returns)
Here:
$26,439
State:
$39,326
(% of AGI for various income ranges: 49.9% for AGIs below $25k, 113.8% for AGIs $25k-50k, 383.4% for AGIs $50k-75k, 838.8% for AGIs $75k-100k, 1688.0% for AGIs $100k-200k, 7329.1% for AGIs over 200k)
Charity contributions: $7,107 (reported on 7.4% of returns)
Here:
$7,107
State:
$15,420
(% of AGI for various income ranges: 3.7% for AGIs below $25k, 17.4% for AGIs $25k-50k, 69.4% for AGIs $50k-75k, 171.2% for AGIs $75k-100k, 418.5% for AGIs $100k-200k, 2916.4% for AGIs over 200k)
Taxes paid: $8,565 (reported on 9.2% of returns)
11203:
$8,565
State:
$9,183
(% of AGI for various income ranges: 12.7% for AGIs below $25k, 32.2% for AGIs $25k-50k, 129.8% for AGIs $50k-75k, 304.0% for AGIs $75k-100k, 586.3% for AGIs $100k-200k, 1531.8% for AGIs over 200k)
Earned income credit: $1,995 (reported on 20.7% of returns)
Here:
$1,995
State:
$2,138
(% of AGI for various income ranges: 106.9% for AGIs below $25k, 59.7% for AGIs $25k-50k, 0.4% for AGIs $50k-75k)
Percentage of individuals using paid preparers for their 2020 taxes: 93.4%
Here:
93%
State:
95%
(% for various income ranges: 91.2% for AGIs below $25k, 94.9% for AGIs $25k-50k, 94.7% for AGIs $50k-75k, 93.2% for AGIs $75k-100k, 94.2% for AGIs $100k-200k, 93.9% for AGIs over 200k)
Averages for the 2012 tax year for zip code 11203, filed in 2013:
Average Adjusted Gross Income (AGI) in 2012: $36,170 (Individual Income Tax Returns)
Here:
$36,170
State:
$77,088
Salary/wage: $36,630 (reported on 83.0% of returns)
Here:
$36,630
State:
$60,593
(% of AGI for various income ranges: 70.4% for AGIs below $25k, 89.8% for AGIs $25k-50k, 87.8% for AGIs $50k-75k, 87.5% for AGIs $75k-100k, 83.6% for AGIs $100k-200k, 51.9% for AGIs over 200k)
Taxable interest for individuals: $348 (reported on 19.1% of returns)
This zip code:
$348
New York:
$3,125
(% of AGI for various income ranges: 0.2% for AGIs below $25k, 0.1% for AGIs $25k-50k, 0.2% for AGIs $50k-75k, 0.2% for AGIs $75k-100k, 0.2% for AGIs $100k-200k, 0.3% for AGIs over 200k)
Ordinary dividends: $1,150 (reported on 6.2% of returns)
Here:
$1,150
State:
$10,299
(% of AGI for various income ranges: 0.2% for AGIs below $25k, 0.2% for AGIs $25k-50k, 0.2% for AGIs $50k-75k, 0.2% for AGIs $75k-100k, 0.3% for AGIs $100k-200k, 0.4% for AGIs over 200k)
Net capital gain/loss in AGI: +$4,371 (reported on 4.0% of returns)
Here:
+$4,371
State:
+$42,474
(% of AGI for various income ranges: 0.2% for AGIs $100k-200k, 20.6% for AGIs over 200k)
Profit/loss from business: +$6,949 (reported on 15.0% of returns)
Here:
+$6,949
State:
+$16,168
(% of AGI for various income ranges: 14.0% for AGIs below $25k, 0.9% for AGIs $25k-50k, 0.5% for AGIs $50k-75k, 0.6% for AGIs $75k-100k, 1.0% for AGIs $100k-200k)
Taxable individual retirement arrangement distribution: $10,287 (reported on 3.6% of returns)
11203:
$10,287
New York:
$17,621
(% of AGI for various income ranges: 1.0% for AGIs below $25k, 0.7% for AGIs $25k-50k, 1.0% for AGIs $50k-75k, 1.2% for AGIs $75k-100k, 1.7% for AGIs $100k-200k)
Total itemized deductions: $19,536 (30% of AGI, reported on 30.5% of returns)
Here:
$19,536
State:
$34,985
Here:
30.3% of AGI
State:
21.3% of AGI
(% of AGI for various income ranges: 7.0% for AGIs below $25k, 14.0% for AGIs $25k-50k, 19.4% for AGIs $50k-75k, 22.6% for AGIs $75k-100k, 21.4% for AGIs $100k-200k, 17.4% for AGIs over 200k)
Charity contributions: $3,696 (reported on 26.5% of returns)
Here:
$3,696
State:
$5,572
(% of AGI for various income ranges: 0.9% for AGIs below $25k, 2.4% for AGIs $25k-50k, 3.4% for AGIs $50k-75k, 3.5% for AGIs $75k-100k, 3.4% for AGIs $100k-200k, 2.6% for AGIs over 200k)
Taxes paid: $6,655 (reported on 30.3% of returns)
11203:
$6,655
State:
$18,656
(% of AGI for various income ranges: 1.5% for AGIs below $25k, 3.7% for AGIs $25k-50k, 6.5% for AGIs $50k-75k, 8.5% for AGIs $75k-100k, 9.2% for AGIs $100k-200k, 7.9% for AGIs over 200k)
Earned income credit: $2,195 (reported on 29.8% of returns)
Here:
$2,195
State:
$2,230
(% of AGI for various income ranges: 9.0% for AGIs below $25k, 1.2% for AGIs $25k-50k)
Percentage of individuals using paid preparers for their 2012 taxes: 70.3%
Here:
70%
State:
66%
(% for various income ranges: 68.6% for AGIs below $25k, 70.8% for AGIs $25k-50k, 72.2% for AGIs $50k-75k, 73.8% for AGIs $75k-100k, 73.9% for AGIs $100k-200k, 81.8% for AGIs over 200k)
Averages for the 2004 tax year for zip code 11203, filed in 2005:
Average Adjusted Gross Income (AGI) in 2004: $31,524 (Individual Income Tax Returns)
Here:
$31,524
State:
$59,519
Salary/wage: $32,716 (reported on 87.3% of returns)
Here:
$32,716
State:
$50,673
(% of AGI for various income ranges: 80.5% for AGIs below $10k, 85.9% for AGIs $10k-25k, 95.2% for AGIs $25k-50k, 91.9% for AGIs $50k-75k, 89.9% for AGIs $75k-100k, 80.9% for AGIs over 100k)
Taxable interest for individuals: $457 (reported on 32.3% of returns)
This zip code:
$457
New York:
$2,377
(% of AGI for various income ranges: 1.4% for AGIs below $10k, 0.5% for AGIs $10k-25k, 0.3% for AGIs $25k-50k, 0.4% for AGIs $50k-75k, 0.5% for AGIs $75k-100k, 0.8% for AGIs over 100k)
Taxable dividends: $682 (reported on 8.5% of returns)
Here:
$682
State:
$5,394
(% of AGI for various income ranges: 0.5% for AGIs below $10k, 0.2% for AGIs $10k-25k, 0.1% for AGIs $25k-50k, 0.2% for AGIs $50k-75k, 0.2% for AGIs $75k-100k, 0.3% for AGIs over 100k)
Net capital gain/loss: +$2,739 (reported on 4.6% of returns)
Here:
+$2,739
State:
+$23,581
(% of AGI for various income ranges: -0.3% for AGIs below $10k, -0.0% for AGIs $10k-25k, -0.0% for AGIs $25k-50k, 0.2% for AGIs $50k-75k, 0.4% for AGIs $75k-100k, 3.5% for AGIs over 100k)
Profit/loss from business: +$5,205 (reported on 12.3% of returns)
Here:
+$5,205
State:
+$13,809
(% of AGI for various income ranges: 27.0% for AGIs below $10k, 6.2% for AGIs $10k-25k, 0.4% for AGIs $25k-50k, 0.3% for AGIs $50k-75k, 0.3% for AGIs $75k-100k, 0.5% for AGIs over 100k)
IRA payment deduction: $2,312 (reported on 1.4% of returns)
11203:
$2,312
New York:
$3,115
(% of AGI for various income ranges: 0.1% for AGIs below $10k, 0.1% for AGIs $10k-25k, 0.1% for AGIs $25k-50k, 0.1% for AGIs $50k-75k, 0.1% for AGIs $75k-100k, 0.1% for AGIs over 100k)
Self-employed pension: $3,875 (reported on 0.0% of returns)
Here:
$3,875
New York:
$19,016
Total itemized deductions: $17,565 (35% of AGI, reported on 38.4% of returns)
Here:
$17,565
State:
$25,864
Here:
34.9% of AGI
State:
21.9% of AGI
(% of AGI for various income ranges: 9.5% for AGIs below $10k, 12.2% for AGIs $10k-25k, 21.8% for AGIs $25k-50k, 25.8% for AGIs $50k-75k, 26.0% for AGIs $75k-100k, 22.3% for AGIs over 100k)
Charity contributions deductions: $3,680 (7% of AGI, reported on 35.7% of returns)
Here:
$3,680
State:
$4,439
Here:
7.2% of AGI
State:
3.6% of AGI
(% of AGI for various income ranges: 0.7% for AGIs below $10k, 2.1% for AGIs $10k-25k, 4.3% for AGIs $25k-50k, 5.1% for AGIs $50k-75k, 5.1% for AGIs $75k-100k, 4.7% for AGIs over 100k)
Total tax: $3,226 (reported on 66.5% of returns)
11203:
$3,226
State:
$11,730
(% of AGI for various income ranges: 4.7% for AGIs below $10k, 3.0% for AGIs $10k-25k, 4.9% for AGIs $25k-50k, 8.1% for AGIs $50k-75k, 10.0% for AGIs $75k-100k, 14.1% for AGIs over 100k)
Earned income credit: $1,727 (reported on 28.1% of returns)
Here:
$1,727
State:
$1,757
Percentage of individuals using paid preparers for their 2004 taxes: 68.7%
Here:
69%
State:
67%
(% for various income ranges: 65.1% for AGIs below $10k, 70.5% for AGIs $10k-25k, 68.5% for AGIs $25k-50k, 69.3% for AGIs $50k-75k, 70.6% for AGIs $75k-100k, 73.2% for AGIs over 100k)
Likely homosexual households (counted as self-reported same-sex unmarried-partner households)
Lesbian couples: 0.1% of all households
Gay men: 0.0% of all households
Household received Food Stamps/SNAP in the past 12 months: 6,045 Household did not receive Food Stamps/SNAP in the past 12 months: 24,157
Women who had a birth in the past 12 months: 486 (312 now married, 175 unmarried) Women who did not have a birth in the past 12 months: 17,612 (4,658 now married, 13,038 unmarried)
Housing units in zip code 11203 with a mortgage: 7,752 (420 second mortgage, 11 home equity loan, 319 both second mortgage and home equity loan) Houses without a mortgage: 104
Median monthly owner costs for units with a mortgage: $2,886 Median monthly owner costs for units without a mortgage: $1,073
Residents with income below the poverty level in 2022:
This zip code:
14.9%
Whole state:
14.3%
Residents with income below 50% of the poverty level in 2022:
This zip code:
8.0%
Whole state:
6.8%
Median number of rooms in houses and condos:
Here:
5.2
State:
6.3
Median number of rooms in apartments:
Here:
3.7
State:
3.8
Notable locations in this zip code not listed on our city pages
Notable locations in zip code 11203: Rugby Branch Brooklyn Public Library (A), Bethany Methodist Home for the Aged (B), Sutton Hall (C), Saint Blaise Youth Center (D), Fire Department New York Engine 310 Ladder 174 Battalion 58 (E), New York Ladder Company 174 (F). Display/hide their locations on the map
Churches in zip code 11203 include: Eglise De Dieu (A), Saint Augustine's Episcopal Church (B), Kingdom Hall of Jehovah's Witness (C), Beulah Church of God Seventh Day (D), Truth Center For Higher Conscious (E), Church of God of Prophecy (F), Shekinah Temple of Praise (G), Triumphant Full Gospel Assembly Church (H), United Community Baptist Church (I). Display/hide their locations on the map
Parks in zip code 11203 include: Wingate Park (1), Hamilton-Metz Field (2), Harry Maze Memorial Park (3), Fidler-Wyckoff House Park (4), Anthony Chiarantano Park (5), Tilden Playground (6), Hawthorne Field (7). Display/hide their locations on the map
5,436 married couples with children.
4,925 single-parent households (1,048 men, 3,877 women).
80.0% of residents of 11203 zip code speak English at home.
4.9% of residents speak Spanish at home (57% very well, 20% well, 19% not well, 3% not at all).
11.9% of residents speak other Indo-European language at home (66% very well, 26% well, 7% not well, 1% not at all).
0.8% of residents speak Asian or Pacific Island language at home (51% very well, 16% well, 21% not well, 11% not at all).
2.3% of residents speak other language at home (92% very well, 6% well, 2% not well).
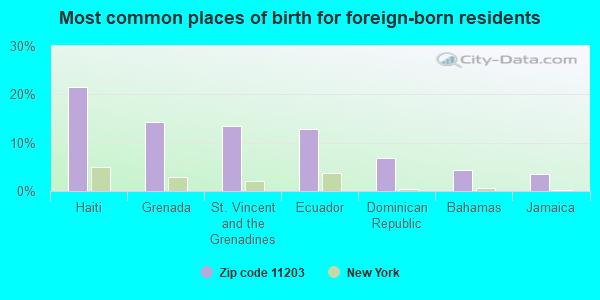
Foreign born population: 39,223 (50.8%) (73.1% of them are naturalized citizens)
This zip code:
50.8%
Whole state:
22.7%
22%Haiti
14%Grenada
14%St. Vincent and the Grenadines
13%Ecuador
7%Dominican Republic
4%Bahamas
3%Jamaica
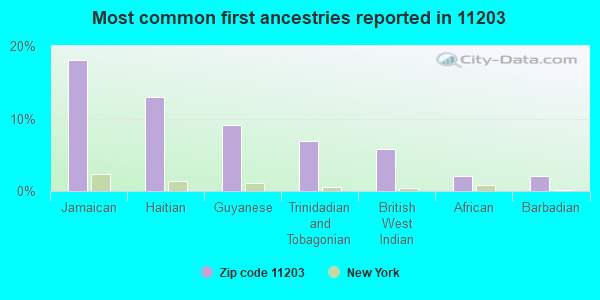
18%Jamaican
13%Haitian
9%Guyanese
7%Trinidadian and Tobagonian
6%British West Indian
2%African
2%Barbadian
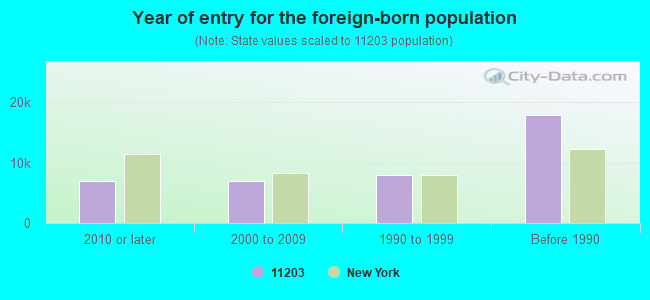
Year of entry for the foreign-born population
7,0282010 or later
6,9212000 to 2009
7,9951990 to 1999
17,872Before 1990
Major facilities with environmental interests located in this zip code:
AMOCO-182221498005 (720 NEW YORK AVENUE in BROOKLYN, NY)
AIR MINOR (AIRS/AFS) STATE MASTER (New York facility tracking) - AIR PROGRAM, (Resource Conservation and Recovery Act (tracking hazardous waste)) Business SIC classification: GASOLINE SERVICE STATIONS Organizations: AMOCO OIL CO (LEGALLY RESPONSIBLE PARTY)
Alternative names: 720 NEW YORK AVENUE GAS STATION INC
ANDY S CLEANERS (5301 CHURCH AVENUE in BROOKLYN, NY)
AIR MINOR (AIRS/AFS) STATE MASTER (New York facility tracking) - AIR PROGRAM, HAZARDOUS WASTE PROGRAM (Resource Conservation and Recovery Act (tracking hazardous waste)) Business SIC classification: DRYCLEANING PLANTS, EXCEPT RUG CLEANING Business NAICS classification: DRYCLEANING AND LAUNDRY SERVICES (EXCEPT COIN-OPERATED). Organizations: KAJA INC (LEGALLY RESPONSIBLE PARTY)
Alternative names: ANDYS CLEANERS
456 LLC - SCHENECTADY AVE BUILDING (456 SCHENECTADY AVE in BROOKLYN, NY)
AIR MINOR (AIRS/AFS) STATE MASTER (New York facility tracking) - AIR PROGRAM Business SIC classification: OPERATORS OF APARTMENT BUILDINGS Organizations: J R D MANAGEMENT CORP (LEGALLY RESPONSIBLE PARTY)
1149 UT SVCE INC (1149 UTICA AVE. in BROOKLYN, NY)
AIR MINOR (AIRS/AFS) STATE MASTER (New York facility tracking) - AIR PROGRAM Business SIC classification: GASOLINE SERVICE STATIONS Organizations: 1149 UT SERVICE INC (LEGALLY RESPONSIBLE PARTY)
Alternative names: COVEN
3902 CHURCH GAS STA INC-3902 CHURCH AVE (3902 CHURCH AVE. in BROOKLYN, NY)
AIR MINOR (AIRS/AFS) STATE MASTER (New York facility tracking) - AIR PROGRAM Business SIC classification: GASOLINE SERVICE STATIONS Organizations: EM ESS PETROLEUM CORPORATION (LEGALLY RESPONSIBLE PARTY)
Alternative names: CHURCH AVENUE SERVIC
GIL BROS CLEANERS (5015 AVENUE D in BROOKLYN, NY)
AIR MINOR (AIRS/AFS) STATE MASTER (New York facility tracking) - AIR PROGRAM Small Quantity Generators, between 100 kg and 1000 kg of hazardous waste/month (Resource Conservation and Recovery Act (tracking hazardous waste)) Business SIC classification: DRYCLEANING PLANTS, EXCEPT RUG CLEANING Business NAICS classification: DRYCLEANING AND LAUNDRY SERVICES (EXCEPT COIN-OPERATED). Alternative names: GILBROS CLEANERS
A1 GAS STOP (7702 FLATLANDS AVE in BROOKLYN, NY)
AIR MINOR (AIRS/AFS) STATE MASTER (New York facility tracking) - AIR PROGRAM, Business SIC classification: GASOLINE SERVICE STATIONS Organizations: AMOCO OIL CO (LEGALLY RESPONSIBLE PARTY)
Alternative names: AMOCO, MOBIL SERVICE STATION
1408 NEW YORK AVENUE BLDG (1408 NEW YORK AVE in BROOKLYN, NY)
AIR SYNTHETIC MINOR (AIRS/AFS) STATE MASTER (New York facility tracking) - AIR PROGRAM Business SIC classification: OPERATORS OF APARTMENT BUILDINGS Business NAICS classification: LESSORS OF RESIDENTIAL BUILDINGS AND DWELLINGS. Organizations: VANDERVEER ESTATES LLC (LEGALLY RESPONSIBLE PARTY)
, FOSTER APARTMENTS GROUP (LEGALLY RESPONSIBLE PARTY)
Alternative names: FOSTER APTS. GROUP
CNR AUTO BODY (5614 CLARENDON RD in BROOKLYN, NY)
STATE MASTER (New York facility tracking) - AIR PROGRAM, Small Quantity Generators, between 100 kg and 1000 kg of hazardous waste/month (Resource Conservation and Recovery Act (tracking hazardous waste)) - notification Business SIC classification: TOP, BODY, AND UPHOLSTERY REPAIR SHOPS AND PAINT SHOPS Organizations: 5612 REALTY CORP (CONTACT/OWNER)
, CNR AUTO BODY & FENDER WORKS INC (LEGALLY RESPONSIBLE PARTY)
Alternative names: C N R AUTO BODY & FENDER WORKS INC, CNR AUTO BODY & FENDER WORKS INC
5400 TILDEN AVENUE SCHOOL - P.S. 244 (5400 TILDEN AVENUE in BROOKLYN, NY)
STATE MASTER (New York facility tracking) - AIR PROGRAM Conditionally Exempt Small Quantity Generators, less than 100 kg/month of hazardous waste (Resource Conservation and Recovery Act (tracking hazardous waste)) - notification Business SIC and NAICS classification: ELEMENTARY AND SECONDARY SCHOOLS Organizations: NYC BOARD OF EDUCATION (CONTACT/OWNER)
, NYC DEPT OF EDUCATION (LEGALLY RESPONSIBLE PARTY)
Alternative names: NYC BD OF ED - PUBLIC SCHOOL 244K
ABC COLLISION-1279 UTICA AVE (1279 UTICA AVE in BROOKLYN, NY)
STATE MASTER (New York facility tracking) - AIR PROGRAM, Conditionally Exempt Small Quantity Generators, less than 100 kg/month of hazardous waste (Resource Conservation and Recovery Act (tracking hazardous waste)) - notification Business SIC classification: TOP, BODY, AND UPHOLSTERY REPAIR SHOPS AND PAINT SHOPS Organizations: HOWARD HOROWITZ (CONTACT/OWNER)
, A & H AUTO BODY AND COLLISION INC (LEGALLY RESPONSIBLE PARTY)
Alternative names: A B C COLLISION
HAN'S DRY CLEANERS (852 E NEW YORK AVE in BROOKLYN, NY)
AIR MINOR (AIRS/AFS) (Resource Conservation and Recovery Act (tracking hazardous waste)) Small Quantity Generators, between 100 kg and 1000 kg of hazardous waste/month (Resource Conservation and Recovery Act (tracking hazardous waste)) - notification Business SIC classification: DRYCLEANING PLANTS, EXCEPT RUG CLEANING Organizations: OWNERNAME (CONTACT/OWNER)
, SPEEDWAY FOOD STORES INC (CONTACT/OWNER)
Alternative names: EAST NEW YORK CLEANING, HANIS DRY CLEANER
GEORGE WINGATE HIGH SCHOOL (600 KINGSTON AVE in BROOKLYN, NY)
AIR SYNTHETIC MINOR (AIRS/AFS) STATE MASTER (New York facility tracking) - AIR PROGRAM Business SIC and NAICS classification: ELEMENTARY AND SECONDARY SCHOOLS Organizations: NYC DEPT OF EDUCATION (LEGALLY RESPONSIBLE PARTY)
Housing units lacking complete plumbing facilities: 1.0% Housing units lacking complete kitchen facilities: 3.2%
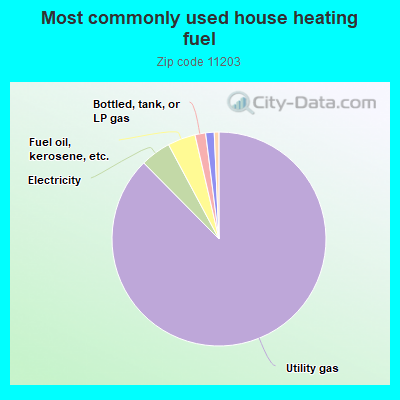
87.6%Utility gas
4.6%Electricity
4.2%Fuel oil, kerosene, etc.
1.6%Bottled, tank, or LP gas
1.3%No fuel used
Population in 1990: 80,566. Population change in the 1990s: +3,932 (+4.9%).
Place of birth for U.S.-born residents:
This state: 33,134
Northeast: 728
Midwest: 460
South: 2,031
West: 358
73% of the 11203 zip code residents lived in the same house 5 years ago. Out of people who lived in different houses, 84% lived in this county. Out of people who lived in different counties, 50% lived in New York.
95% of the 11203 zip code residents lived in the same house 1 year ago. Out of people who lived in different houses, 67% moved from this county. Out of people who lived in different houses, 13% moved from different county within same state. Out of people who lived in different houses, 9% moved from different state. Out of people who lived in different houses, 10% moved from abroad.
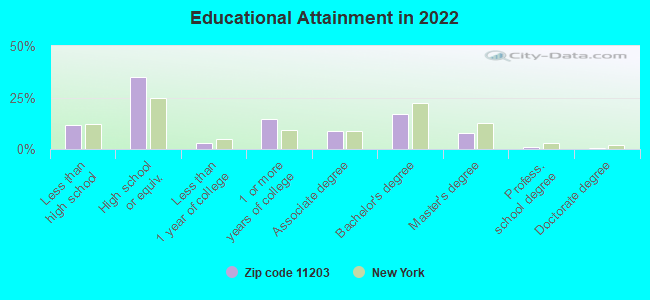
Private vs. public school enrollment:
Students in private schools in grades 1 to 8 (elementary and middle school): 929
Here:
14.4%
New York:
15.6%
Students in private schools in grades 9 to 12 (high school): 318
Here:
8.9%
New York:
15.0%
Students in private undergraduate colleges: 1,173
Here:
29.8%
New York:
39.2%
Occupation by median earnings in the past 12 months ($)
91,932Legal occupations
89,727Health diagnosing and treating practitioners and other technical occupations
86,850Architecture and engineering occupations
72,805Management occupations
71,826Computer and mathematical occupations
66,572Life, physical, and social science occupations
Companies with federal contracts located in this zip code:
STATE UNIVERSITY OF NEW YORK (450 CLARKSON AVE in BROOKLYN, NY) : $1,290,867 in 13 contractsfrom 2002 to 2006
Contracts for Cardio-Vascular Services, Other Medical Services, Educational Services, Tuition, Registration, and Membership Fees by Department of Veterans Affairs, Army Signed by year:2000: $0; 2001: $0; 2002: $1,086,506; 2003: $102,465; 2004: $9,650; 2005: $63,350; 2006: $28,896.
Biggest contracts:
$468,000 with Department of Veterans Affairs for Cardio-Vascular Services. Signed on 2002-10-15. Completion date: 2003-09-15.
$400,000 with Department of Veterans Affairs for Other Medical Services. Signed on 2002-09-15. Completion date: 2002-09-15.
$190,000 with Department of Veterans Affairs for Cardio-Vascular Services. Signed on 2002-09-15. Completion date: 2002-12-15.
$84,375 with Department of Veterans Affairs for Other Medical Services. Signed on 2003-09-15. Completion date: 2003-09-15.
SUNY DOWNSTATE MEDICAL CENTER (450 CLARKSON AVENUE, BROOKLYN, NY in NEW YORK, NY) : $680,844 in 9 contractsfrom 2000 to 2006
Contracts for Biomedical -- Basic Research (R&D) by National Institutes of Health Signed by year:2000: $97,000; 2001: $50,000; 2002: $258,000; 2003: $0; 2004: $129,149; 2005: $80,695; 2006: $66,000.
Biggest contracts:
$173,000 with National Institutes of Health for Biomedical -- Basic Research (R&D). Signed on 2002-08-15. Completion date: 2006-07-15.
$129,149, same as above.Signed on 2004-03-23. Completion date: 2006-07-31.
$97,000, same as above.Signed on 2000-08-15. Completion date: 2006-07-15.
$85,000, same as above.Signed on 2002-01-15. Completion date: 2006-07-15.
CROSSLAND ELECTRICAL SYSTEMS, (846 EAST 52ND STREET in BROOKLYN, NY; small business) : $95,029 in 2 contractsfrom 2000 to 2001
$79,000 with Army for Fire Protection Services. Signed on 2000-09-23. Completion date: 2000-11-30.
$16,029, same as above.Signed on 2001-09-11. Completion date: 2001-12-31.
Top industries in this zip code by the number of employees in 2005:
Health Care and Social Assistance: General Medical and Surgical Hospitals (over 1000 employees: 3 establishments)
Health Care and Social Assistance: Psychiatric and Substance Abuse Hospitals (500-999: 1)
Administrative and Support and Waste Management and Remediation Services: Office Administrative Services (250-499: 1)
Professional, Scientific, and Technical Services: Research and Development in the Physical, Engineering, and Life Sciences (250-499: 1)
2007 - 2018 National Fire Incident Reporting System (NFIRS) incidents
Based on the data from the years 2007 - 2018 the average number of fires per year is 392. The highest number of fires - 436 took place in 2008, and the least - 310 in 2007. The data has a growing trend.
When looking into fire subcategories, the most incidents belonged to: Structure Fires (78.3%), and Outside Fires (10.2%).
Fire incident types reported to NFIRS in Zip Code 11203


 Nearest zip codes: 11213, 11226, 11225, 11210, 11212, 11233.


 Based on the data from the years 2007 - 2018 the average number of fires per year is 392. The highest number of fires - 436 took place in 2008, and the least - 310 in 2007. The data has a growing trend.
 When looking into fire subcategories, the most incidents belonged to: Structure Fires (78.3%), and Outside Fires (10.2%).