Estimated zip code population in 2022: 37,709 Zip code population in 2010: 36,256 Zip code population in 2000: 36,571
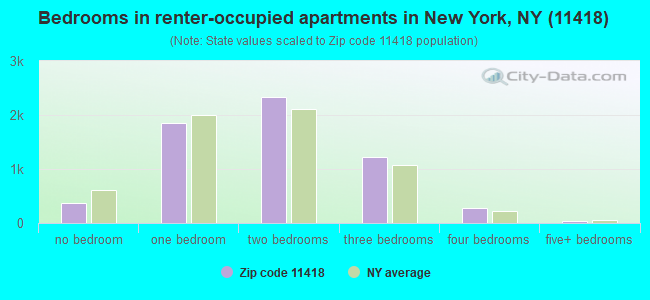
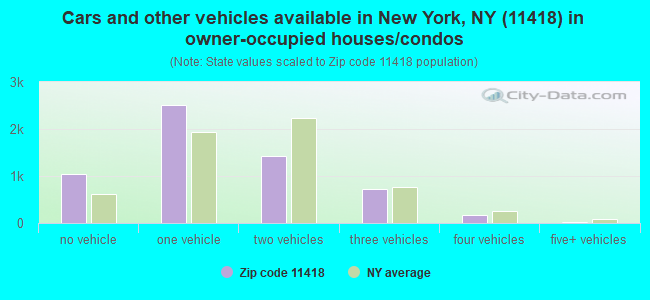
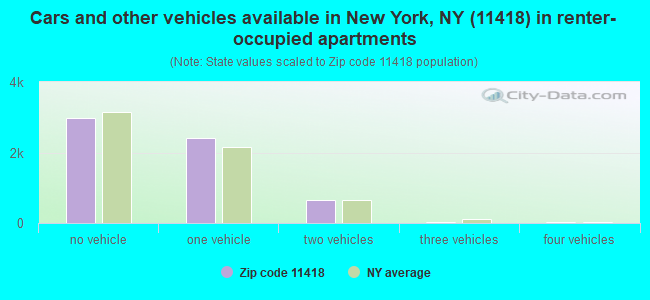
Houses and condos: 12,282 Renter-occupied apartments: 6,101
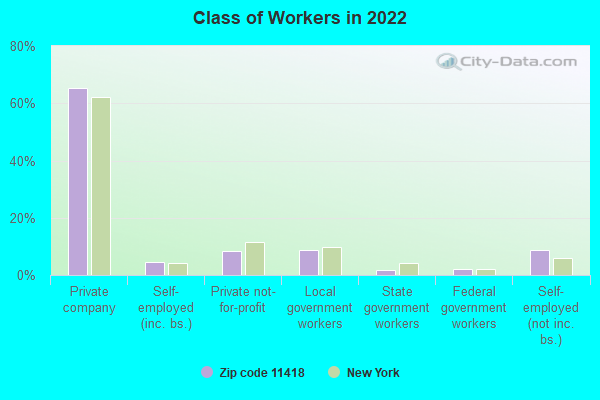
% of renters here:
51%
State:
46%
March 2022 cost of living index in zip code 11418: 152.2 (very high, U.S. average is 100)
Land area: 1.6 sq. mi. Water area: 0.0 sq. mi.
Population density: 23,091 people per square mile
(very high).
OSM Map
General Map
Google Map
MSN Map
OSM Map
General Map
Google Map
MSN Map
OSM Map
General Map
Google Map
MSN Map
OSM Map
General Map
Google Map
MSN Map
Please wait while loading the map...
Real estate property taxes paid for housing units in 2022:
This zip code:
0.8% ($6,133)
New York:
1.5% ($6,180)
Median real estate property taxes paid for housing units with mortgages in 2022: $6,133 (0.8%) Median real estate property taxes paid for housing units with no mortgage in 2022: $6,152 (0.8%)
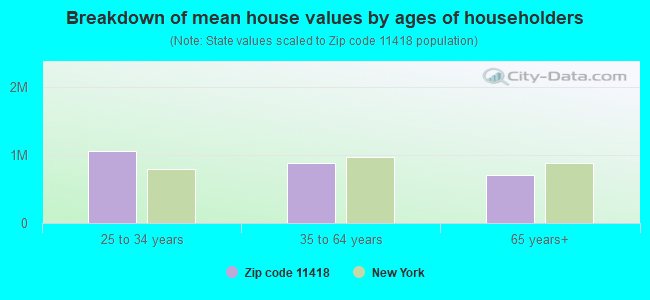
Estimated median house/condo value in 2022: $760,353
11418:
$760,353
New York:
$400,400
According to our research of New York and other state lists, there were 25 registered sex offenders living in 11418 zip code as of April 27, 2024. The ratio of all residents to sex offenders in zip code 11418 is 1,619 to 1. The ratio of registered sex offenders to all residents in this zip code is lower than the state average.
Median resident age:
This zip code:
40.0 years
New York median age:
40.0 years
Average household size:
This zip code:
3.1 people
New York:
2.5 people
Averages for the 2020 tax year for zip code 11418, filed in 2021:
Average Adjusted Gross Income (AGI) in 2020: $45,511 (Individual Income Tax Returns)
Here:
$45,511
State:
$90,930
Salary/wage: $45,945 (reported on 75.3% of returns)
Here:
$45,945
State:
$72,104
(% of AGI for various income ranges: 958.1% for AGIs below $25k, 3447.2% for AGIs $25k-50k, 7015.3% for AGIs $50k-75k, 10815.8% for AGIs $75k-100k, 19180.2% for AGIs $100k-200k, 62078.2% for AGIs over 200k)
Taxable interest for individuals: $993 (reported on 20.2% of returns)
This zip code:
$993
New York:
$3,075
(% of AGI for various income ranges: 9.7% for AGIs below $25k, 10.0% for AGIs $25k-50k, 17.6% for AGIs $50k-75k, 52.6% for AGIs $75k-100k, 125.7% for AGIs $100k-200k, 965.5% for AGIs over 200k)
Ordinary dividends: $3,285 (reported on 8.9% of returns)
Here:
$3,285
State:
$11,095
(% of AGI for various income ranges: 7.3% for AGIs below $25k, 8.5% for AGIs $25k-50k, 21.5% for AGIs $50k-75k, 61.1% for AGIs $75k-100k, 184.3% for AGIs $100k-200k, 2120.0% for AGIs over 200k)
Net capital gain/loss in AGI: +$6,295 (reported on 9.7% of returns)
Here:
+$6,295
State:
+$44,925
(% of AGI for various income ranges: 1.8% for AGIs below $25k, 11.3% for AGIs $25k-50k, 37.2% for AGIs $50k-75k, 74.3% for AGIs $75k-100k, 399.0% for AGIs $100k-200k, 5763.6% for AGIs over 200k)
Profit/loss from business: +$8,504 (reported on 26.3% of returns)
Here:
+$8,504
State:
+$14,940
(% of AGI for various income ranges: 457.8% for AGIs below $25k, 250.1% for AGIs $25k-50k, 182.8% for AGIs $50k-75k, 264.5% for AGIs $75k-100k, 282.1% for AGIs $100k-200k, 2698.2% for AGIs over 200k)
Taxable individual retirement arrangement distribution: $14,684 (reported on 2.2% of returns)
11418:
$14,684
New York:
$19,609
(% of AGI for various income ranges: 12.7% for AGIs below $25k, 19.0% for AGIs $25k-50k, 29.0% for AGIs $50k-75k, 80.2% for AGIs $75k-100k, 249.1% for AGIs $100k-200k, 1270.0% for AGIs over 200k)
Self-employed (Keogh) retirement plans: $20,167 (reported on 0.2% of returns)
11418:
$20,167
New York:
$32,497
(% of AGI for various income ranges: 63.0% for AGIs $75k-100k)
Total itemized deductions: $27,604 (reported on 6.4% of returns)
Here:
$27,604
State:
$39,326
(% of AGI for various income ranges: 38.9% for AGIs below $25k, 95.7% for AGIs $25k-50k, 266.0% for AGIs $50k-75k, 656.4% for AGIs $75k-100k, 1317.8% for AGIs $100k-200k, 5042.7% for AGIs over 200k)
Charity contributions: $5,949 (reported on 4.8% of returns)
Here:
$5,949
State:
$15,420
(% of AGI for various income ranges: 1.7% for AGIs below $25k, 9.5% for AGIs $25k-50k, 30.9% for AGIs $50k-75k, 100.0% for AGIs $75k-100k, 222.5% for AGIs $100k-200k, 1448.2% for AGIs over 200k)
Taxes paid: $8,754 (reported on 6.4% of returns)
11418:
$8,754
State:
$9,183
(% of AGI for various income ranges: 10.2% for AGIs below $25k, 26.8% for AGIs $25k-50k, 88.5% for AGIs $50k-75k, 235.9% for AGIs $75k-100k, 450.7% for AGIs $100k-200k, 1247.3% for AGIs over 200k)
Earned income credit: $2,061 (reported on 20.7% of returns)
Here:
$2,061
State:
$2,138
(% of AGI for various income ranges: 105.4% for AGIs below $25k, 79.3% for AGIs $25k-50k, 1.0% for AGIs $50k-75k)
Percentage of individuals using paid preparers for their 2020 taxes: 93.5%
Here:
93%
State:
95%
(% for various income ranges: 90.3% for AGIs below $25k, 95.9% for AGIs $25k-50k, 95.1% for AGIs $50k-75k, 96.5% for AGIs $75k-100k, 94.8% for AGIs $100k-200k, 96.9% for AGIs over 200k)
Averages for the 2012 tax year for zip code 11418, filed in 2013:
Average Adjusted Gross Income (AGI) in 2012: $38,700 (Individual Income Tax Returns)
Here:
$38,700
State:
$77,088
Salary/wage: $40,434 (reported on 78.6% of returns)
Here:
$40,434
State:
$60,593
(% of AGI for various income ranges: 66.8% for AGIs below $25k, 90.1% for AGIs $25k-50k, 90.5% for AGIs $50k-75k, 86.1% for AGIs $75k-100k, 83.0% for AGIs $100k-200k, 59.6% for AGIs over 200k)
Taxable interest for individuals: $800 (reported on 25.2% of returns)
This zip code:
$800
New York:
$3,125
(% of AGI for various income ranges: 0.5% for AGIs below $25k, 0.3% for AGIs $25k-50k, 0.4% for AGIs $50k-75k, 0.6% for AGIs $75k-100k, 0.5% for AGIs $100k-200k, 1.6% for AGIs over 200k)
Ordinary dividends: $3,092 (reported on 9.0% of returns)
Here:
$3,092
State:
$10,299
(% of AGI for various income ranges: 0.5% for AGIs below $25k, 0.5% for AGIs $25k-50k, 0.5% for AGIs $50k-75k, 1.0% for AGIs $75k-100k, 0.8% for AGIs $100k-200k, 1.9% for AGIs over 200k)
Net capital gain/loss in AGI: +$7,543 (reported on 6.6% of returns)
Here:
+$7,543
State:
+$42,474
(% of AGI for various income ranges: 0.2% for AGIs $75k-100k, 0.6% for AGIs $100k-200k, 15.3% for AGIs over 200k)
Profit/loss from business: +$10,478 (reported on 24.4% of returns)
Here:
+$10,478
State:
+$16,168
(% of AGI for various income ranges: 27.1% for AGIs below $25k, 4.5% for AGIs $25k-50k, 1.6% for AGIs $50k-75k, 2.0% for AGIs $75k-100k, 2.6% for AGIs $100k-200k, 2.5% for AGIs over 200k)
Taxable individual retirement arrangement distribution: $10,938 (reported on 3.4% of returns)
11418:
$10,938
New York:
$17,621
(% of AGI for various income ranges: 0.8% for AGIs below $25k, 0.8% for AGIs $25k-50k, 0.9% for AGIs $50k-75k, 1.2% for AGIs $75k-100k, 1.6% for AGIs $100k-200k)
Self-employment retirement plans: $17,425 (reported on 0.2% of returns)
11418:
$17,425
New York:
$27,330
Total itemized deductions: $21,768 (28% of AGI, reported on 27.8% of returns)
Here:
$21,768
State:
$34,985
Here:
28.3% of AGI
State:
21.3% of AGI
(% of AGI for various income ranges: 6.6% for AGIs below $25k, 12.5% for AGIs $25k-50k, 16.6% for AGIs $50k-75k, 18.9% for AGIs $75k-100k, 20.1% for AGIs $100k-200k, 24.1% for AGIs over 200k)
Charity contributions: $2,610 (reported on 22.1% of returns)
Here:
$2,610
State:
$5,572
(% of AGI for various income ranges: 0.5% for AGIs below $25k, 1.2% for AGIs $25k-50k, 1.6% for AGIs $50k-75k, 1.9% for AGIs $75k-100k, 2.0% for AGIs $100k-200k, 2.1% for AGIs over 200k)
Taxes paid: $8,470 (reported on 27.7% of returns)
11418:
$8,470
State:
$18,656
(% of AGI for various income ranges: 1.4% for AGIs below $25k, 3.3% for AGIs $25k-50k, 6.0% for AGIs $50k-75k, 8.0% for AGIs $75k-100k, 9.9% for AGIs $100k-200k, 10.8% for AGIs over 200k)
Earned income credit: $2,377 (reported on 30.2% of returns)
Here:
$2,377
State:
$2,230
(% of AGI for various income ranges: 9.8% for AGIs below $25k, 1.4% for AGIs $25k-50k)
Percentage of individuals using paid preparers for their 2012 taxes: 76.1%
Here:
76%
State:
66%
(% for various income ranges: 77.0% for AGIs below $25k, 75.2% for AGIs $25k-50k, 75.1% for AGIs $50k-75k, 74.5% for AGIs $75k-100k, 75.8% for AGIs $100k-200k, 78.6% for AGIs over 200k)
Averages for the 2004 tax year for zip code 11418, filed in 2005:
Average Adjusted Gross Income (AGI) in 2004: $33,326 (Individual Income Tax Returns)
Here:
$33,326
State:
$59,519
Salary/wage: $34,467 (reported on 81.2% of returns)
Here:
$34,467
State:
$50,673
(% of AGI for various income ranges: 93.2% for AGIs below $10k, 80.2% for AGIs $10k-25k, 93.1% for AGIs $25k-50k, 89.9% for AGIs $50k-75k, 86.3% for AGIs $75k-100k, 65.3% for AGIs over 100k)
Taxable interest for individuals: $1,147 (reported on 38.4% of returns)
This zip code:
$1,147
New York:
$2,377
(% of AGI for various income ranges: 4.2% for AGIs below $10k, 1.1% for AGIs $10k-25k, 0.7% for AGIs $25k-50k, 1.3% for AGIs $50k-75k, 0.7% for AGIs $75k-100k, 2.5% for AGIs over 100k)
Taxable dividends: $2,053 (reported on 12.5% of returns)
Here:
$2,053
State:
$5,394
(% of AGI for various income ranges: 2.3% for AGIs below $10k, 0.6% for AGIs $10k-25k, 0.5% for AGIs $25k-50k, 0.8% for AGIs $50k-75k, 0.6% for AGIs $75k-100k, 1.2% for AGIs over 100k)
Net capital gain/loss: +$5,952 (reported on 9.3% of returns)
Here:
+$5,952
State:
+$23,581
(% of AGI for various income ranges: -1.4% for AGIs below $10k, -0.0% for AGIs $10k-25k, 0.1% for AGIs $25k-50k, 0.3% for AGIs $50k-75k, 0.9% for AGIs $75k-100k, 7.2% for AGIs over 100k)
Profit/loss from business: +$9,077 (reported on 21.1% of returns)
Here:
+$9,077
State:
+$13,809
(% of AGI for various income ranges: 48.9% for AGIs below $10k, 15.4% for AGIs $10k-25k, 3.0% for AGIs $25k-50k, 1.8% for AGIs $50k-75k, 2.6% for AGIs $75k-100k, 3.2% for AGIs over 100k)
IRA payment deduction: $2,978 (reported on 2.2% of returns)
11418:
$2,978
New York:
$3,115
(% of AGI for various income ranges: 0.2% for AGIs $10k-25k, 0.3% for AGIs $25k-50k, 0.2% for AGIs $50k-75k, 0.2% for AGIs $75k-100k, 0.1% for AGIs over 100k)
Self-employed pension: $15,590 (reported on 0.3% of returns)
Here:
$15,590
New York:
$19,016
Total itemized deductions: $18,595 (31% of AGI, reported on 34.8% of returns)
Here:
$18,595
State:
$25,864
Here:
31.4% of AGI
State:
21.9% of AGI
(% of AGI for various income ranges: 12.6% for AGIs below $10k, 12.9% for AGIs $10k-25k, 19.8% for AGIs $25k-50k, 21.5% for AGIs $50k-75k, 22.1% for AGIs $75k-100k, 21.0% for AGIs over 100k)
Charity contributions deductions: $2,589 (4% of AGI, reported on 30.7% of returns)
Here:
$2,589
State:
$4,439
Here:
4.3% of AGI
State:
3.6% of AGI
(% of AGI for various income ranges: 0.5% for AGIs below $10k, 1.3% for AGIs $10k-25k, 2.7% for AGIs $25k-50k, 2.8% for AGIs $50k-75k, 2.9% for AGIs $75k-100k, 2.4% for AGIs over 100k)
Total tax: $4,108 (reported on 70.3% of returns)
11418:
$4,108
State:
$11,730
(% of AGI for various income ranges: 8.9% for AGIs below $10k, 4.3% for AGIs $10k-25k, 5.6% for AGIs $25k-50k, 8.4% for AGIs $50k-75k, 10.1% for AGIs $75k-100k, 15.7% for AGIs over 100k)
Earned income credit: $1,821 (reported on 26.6% of returns)
Here:
$1,821
State:
$1,757
Percentage of individuals using paid preparers for their 2004 taxes: 72.7%
Here:
73%
State:
67%
(% for various income ranges: 69.1% for AGIs below $10k, 75.4% for AGIs $10k-25k, 72.9% for AGIs $25k-50k, 71.5% for AGIs $50k-75k, 75.3% for AGIs $75k-100k, 72.1% for AGIs over 100k)
Likely homosexual households (counted as self-reported same-sex unmarried-partner households)
Lesbian couples: 0.3% of all households
Gay men: 0.1% of all households
Household received Food Stamps/SNAP in the past 12 months: 1,817 Household did not receive Food Stamps/SNAP in the past 12 months: 10,109
Women who had a birth in the past 12 months: 510 (458 now married, 46 unmarried) Women who did not have a birth in the past 12 months: 7,827 (3,394 now married, 4,406 unmarried)
Housing units in zip code 11418 with a mortgage: 3,561 (222 second mortgage, 174 both second mortgage and home equity loan) Houses without a mortgage: 96
Median monthly owner costs for units with a mortgage: $2,957 Median monthly owner costs for units without a mortgage: $1,173
Residents with income below the poverty level in 2022:
This zip code:
12.5%
Whole state:
14.3%
Residents with income below 50% of the poverty level in 2022:
This zip code:
5.7%
Whole state:
6.8%
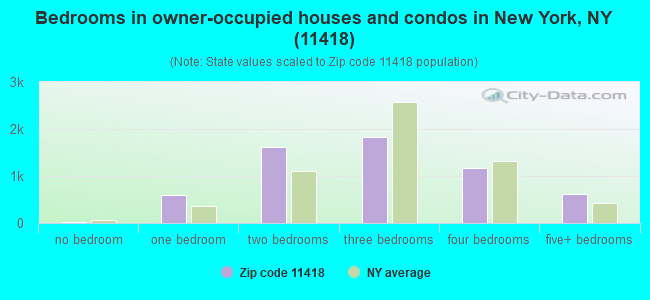
Median number of rooms in houses and condos:
Here:
5.9
State:
6.3
Median number of rooms in apartments:
Here:
4.1
State:
3.8
Notable locations in this zip code not listed on our city pages
Notable locations in zip code 11418: The Overlook (A), Casa Latina (B), Richmond Hill Branch Queens Borough Public Library (C), Fire Department New York Engine 294 Ladder 143 (D), Fire Department New York Engine 270 Division 13 (E), New York Ladder Company 143 (F). Display/hide their locations on the map
Churches in zip code 11418 include: Union Congregational Church (A), Trinity United Methodist Church (B), Saint Paul's Evangelical Church (C), Saint John's Lutheran Church (D), Richmond Hill Baptist Church (E), Pilgrim Congregational Church (F), Our Lady of Cenacle Church (G), Holy Child Jesus Church (H), Deeper Life Christian Church (I). Display/hide their locations on the map
5,100 married couples with children.
1,566 single-parent households (276 men, 1,290 women).
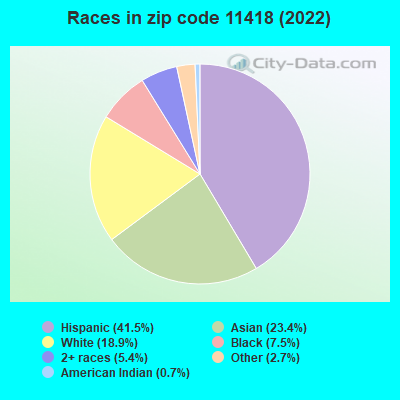
40.6% of residents of 11418 zip code speak English at home.
35.7% of residents speak Spanish at home (54% very well, 23% well, 19% not well, 4% not at all).
17.8% of residents speak other Indo-European language at home (55% very well, 32% well, 12% not well, 2% not at all).
3.4% of residents speak Asian or Pacific Island language at home (47% very well, 33% well, 12% not well, 8% not at all).
2.1% of residents speak other language at home (74% very well, 16% well, 8% not well, 2% not at all).
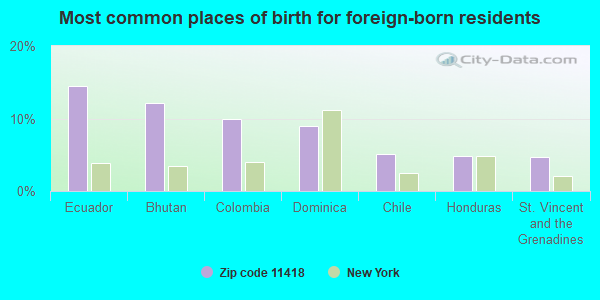
Foreign born population: 18,615 (49.4%) (64.5% of them are naturalized citizens)
This zip code:
49.4%
Whole state:
22.7%
14%Ecuador
12%Bhutan
10%Colombia
9%Dominica
5%Chile
5%Honduras
5%St. Vincent and the Grenadines
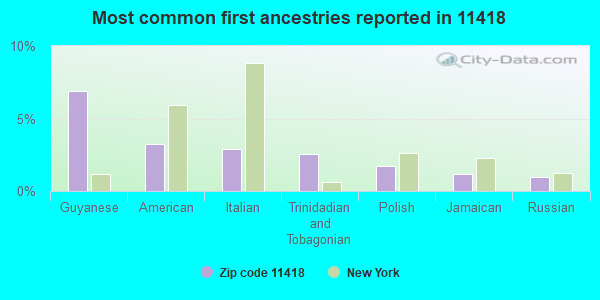
7%Guyanese
3%American
3%Italian
3%Trinidadian and Tobagonian
2%Polish
1%Jamaican
1%Russian
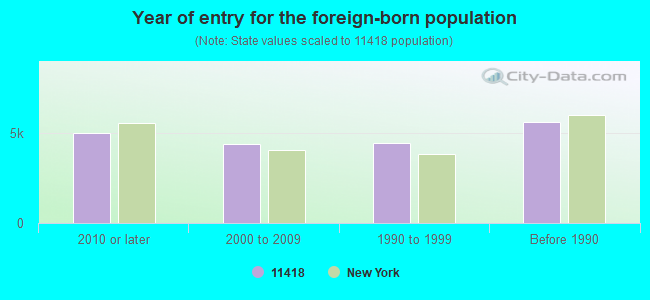
Year of entry for the foreign-born population
4,9932010 or later
4,4282000 to 2009
4,4661990 to 1999
5,630Before 1990
Major facilities with environmental interests located in this zip code:
COLONY CLEANERS (123-04 JAMAICA AVE in RICHMOND HILL, NY)
AIR MINOR (AIRS/AFS) STATE MASTER (New York facility tracking) - AIR PROGRAM Conditionally Exempt Small Quantity Generators, less than 100 kg/month of hazardous waste (Resource Conservation and Recovery Act (tracking hazardous waste)) - notification Business SIC classification: DRYCLEANING PLANTS, EXCEPT RUG CLEANING Business NAICS classification: DRYCLEANING AND LAUNDRY SERVICES (EXCEPT COIN-OPERATED). Organizations: DOT H NG (CONTACT/OWNER)
AMOCO#N6617/10847 (119-01 ATLANTIC AVENUE in JAMAICA, NY)
AIR MINOR (AIRS/AFS) STATE MASTER (New York facility tracking) - AIR PROGRAM Business SIC classification: GASOLINE SERVICE STATIONS Organizations: BP PRODUCTS NORTH AMERICA INC, RODBELL MANHATTAN OIL CORP (LEGALLY RESPONSIBLE PARTY)
Alternative names: MICHAEL KATZ S/S-10847, MICHAEL KATZ SERVICE STATION
HESS STATION #32318 (104-09 ATLANTIC AVE in RICHMOND HILL, NY)
STATE MASTER (New York facility tracking) - AIR PROGRAM Small Quantity Generators, between 100 kg and 1000 kg of hazardous waste/month (Resource Conservation and Recovery Act (tracking hazardous waste)) Organizations: HESS CORPORATION, AMERADA HESS CORP (CONTACT/OPERATOR)
GROUP HOME #1 ( in JAMAICA, NY)
(National Center for Education Statistics) - STATE ID-342700894004 Organizations: NEW YORK CITY PUBLIC SCHOOLS (SCHOOL DISTRICT)
AIRPORT CLEANERS (122-07 LIBERTY AVENUE in RICHMOND HILL, NY)
(Resource Conservation and Recovery Act (tracking hazardous waste)) Alternative names: AIRPORT CLEANERS I
APREX GARAGE CORP (87-36 LEFFERTS BLVD in RICHMOND HILL, NY)
ARCH AUTO PARTS CORP (89-15 127TH ST in RICHMOND HILL, NY)
HAZARDOUS WASTE BIENNIAL REPORTER (Resource Conservation and Recovery Act (tracking hazardous waste)) Large Quantity Generators, more that 1000 kg of hazardous waste/month (Resource Conservation and Recovery Act (tracking hazardous waste)) Alternative names: ARCH AUTO REBUILDING CORPORATION
HILLSIDE GETTY (130-14 HILLSIDE AVE in RICHMOND HILL, NY)
CON ED - MH 750 (125 ST & HILLSIDE AVE in RICHMOND HILL, NY)
HAZARDOUS WASTE BIENNIAL REPORTER (Resource Conservation and Recovery Act (tracking hazardous waste)) (Resource Conservation and Recovery Act (tracking hazardous waste))
CON ED-MH 18176 (130-34 90TH AVE in JAMAICA, NY)
HAZARDOUS WASTE BIENNIAL REPORTER (Resource Conservation and Recovery Act (tracking hazardous waste)) (Resource Conservation and Recovery Act (tracking hazardous waste))
135-15 87TH STREET CO (135-15 87TH ST STE 2 in JAMAICA, NY)
(Resource Conservation and Recovery Act (tracking hazardous waste))
A TO Z AUTO REPAIR (87-28 LEFFERTS BLVD in RICHMOND HILL, NY)
(Resource Conservation and Recovery Act (tracking hazardous waste))
APARA ENTERPRISES INC (130-14 HILLSIDE AVE in RICHMOND HILL, NY)
(Resource Conservation and Recovery Act (tracking hazardous waste))
Housing units lacking complete plumbing facilities: 1.1% Housing units lacking complete kitchen facilities: 2.5%
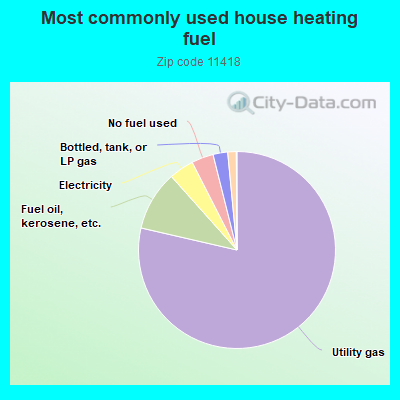
78.6%Utility gas
9.8%Fuel oil, kerosene, etc.
4.1%Electricity
3.6%No fuel used
2.4%Bottled, tank, or LP gas
1.4%Other fuel
Population in 1990: 29,382. Population change in the 1990s: +7,189 (+24.5%).
Place of birth for U.S.-born residents:
This state: 17,055
Northeast: 397
Midwest: 257
South: 303
West: 108
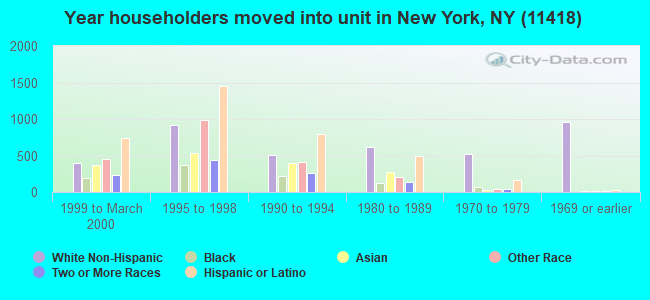
62% of the 11418 zip code residents lived in the same house 5 years ago. Out of people who lived in different houses, 69% lived in this county. Out of people who lived in different counties, 50% lived in New York.
91% of the 11418 zip code residents lived in the same house 1 year ago. Out of people who lived in different houses, 46% moved from this county. Out of people who lived in different houses, 21% moved from different county within same state. Out of people who lived in different houses, 19% moved from different state. Out of people who lived in different houses, 15% moved from abroad.
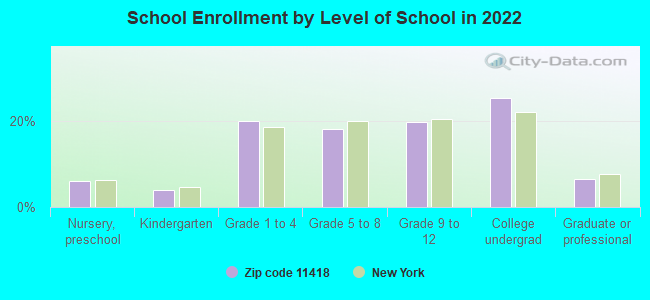
Private vs. public school enrollment:
Students in private schools in grades 1 to 8 (elementary and middle school): 502
Here:
13.9%
New York:
15.6%
Students in private schools in grades 9 to 12 (high school): 277
Here:
14.8%
New York:
15.0%
Students in private undergraduate colleges: 585
Here:
24.5%
New York:
39.2%
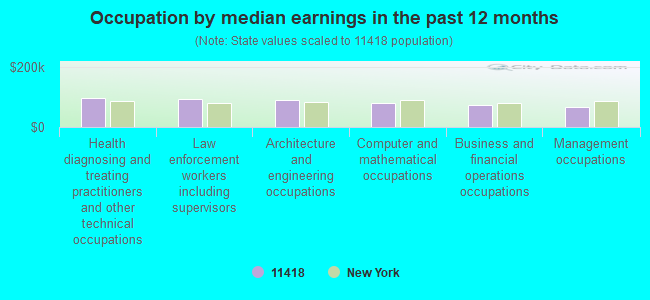
Occupation by median earnings in the past 12 months ($)
96,998Health diagnosing and treating practitioners and other technical occupations
94,117Law enforcement workers including supervisors
90,335Architecture and engineering occupations
80,909Computer and mathematical occupations
73,608Business and financial operations occupations
67,202Management occupations
Companies with federal contracts located in this zip code:
PORTAB INC (8384 116TH ST APT 1A in RICHMOND HILL, NY; small business) : $1,644,175 in 203 contractsfrom 2004 to 2006
Contracts for Hardware, Commercial, Packing and Gasket Materials, Power and Hand Pumps, Valves, Nonpowered, and moreby Defense Logistics Agency Signed by year:2000: $0; 2001: $0; 2002: $0; 2003: $0; 2004: $304,988; 2005: $718,213; 2006: $620,974.
Biggest contracts:
$75,570 with Defense Logistics Agency for Hardware, Commercial. Signed on 2006-01-11. Completion date: 2006-01-11.
$49,322, same as above.Signed on 2006-04-12. Completion date: 2006-06-06.
$35,931, same as above.Signed on 2006-01-26. Completion date: 2006-05-27.
$32,550 with Defense Logistics Agency for Packing and Gasket Materials. Signed on 2006-04-21. Completion date: 2006-08-04.
SANOVA-POLYTECH, INC (10910 PARK LANE SOUTH , SU in RICHMOND HILL, NY; small business) : $856,250 in 3 contractsfrom 2001 to 2002
$413,314 with Navy for Defense Ships -- Basic Research (R&D). Signed on 2001-02-23. Completion date: 2003-02-01.
$342,936, same as above.Signed on 2002-06-05. Completion date: 2003-02-01.
$100,000, same as above.Signed on 2002-12-08. Completion date: 2003-08-23.
SELTECH PRODUCTS INC (91-06 130TH STREET in RICHMOND HILL, NY; small business) : $31,619 in 8 contractsfrom 2004 to 2006
Contracts for Airframe Structural Components, Maintenance, Repair and Rebuilding of Equipment -- Aircraft Components and Accessories by Air Force, U.S. Coast Guard, Navy Signed by year:2000: $0; 2001: $0; 2002: $0; 2003: $0; 2004: $11,880; 2005: $395; 2006: $19,344.
Biggest contracts:
$11,880 with Air Force for Airframe Structural Components. Signed on 2004-12-23. Completion date: 2005-02-02.
$5,565, same as above.Signed on 2006-01-04. Completion date: 2006-01-05.
$5,249, same as above.Signed on 2006-03-20. Completion date: 2006-03-20.
$4,680 with U.S. Coast Guard for Maintenance, Repair and Rebuilding of Equipment -- Aircraft Components and Accessories. Signed on 2006-01-11. Completion date: 2006-01-20.
Top industries in this zip code by the number of employees in 2005:
Health Care and Social Assistance: Home Health Care Services (over 1000 employees: 1 establishment, 50-99 employees: 1 establishment)
Health Care and Social Assistance: General Medical and Surgical Hospitals (over 1000: 1)
Health Care and Social Assistance: Offices of Physicians (except Mental Health Specialists) (250-499: 1, 20-49: 2, 10-19: 3, 5-9: 3, 1-4: 18)
2007 - 2018 National Fire Incident Reporting System (NFIRS) incidents
According to the data from the years 2007 - 2018 the average number of fire incidents per year is 118. The highest number of reported fires - 162 took place in 2010, and the least - 86 in 2007. The data has a rising trend.
When looking into fire subcategories, the most incidents belonged to: Structure Fires (63.7%), and Outside Fires (21.3%).
Fire incident types reported to NFIRS in Zip Code 11418


 Nearest zip codes: 11415, 11424, 11419, 11416, 11375, 11421.
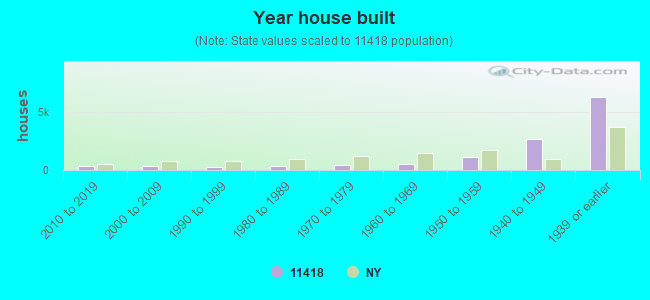


 According to the data from the years 2007 - 2018 the average number of fire incidents per year is 118. The highest number of reported fires - 162 took place in 2010, and the least - 86 in 2007. The data has a rising trend.
 When looking into fire subcategories, the most incidents belonged to: Structure Fires (63.7%), and Outside Fires (21.3%).