Estimated zip code population in 2022: 59,009 Zip code population in 2010: 53,687 Zip code population in 2000: 53,877
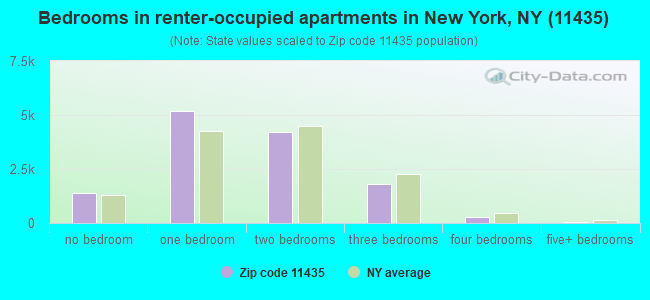
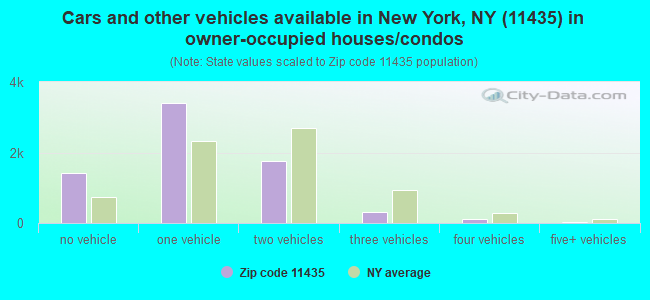
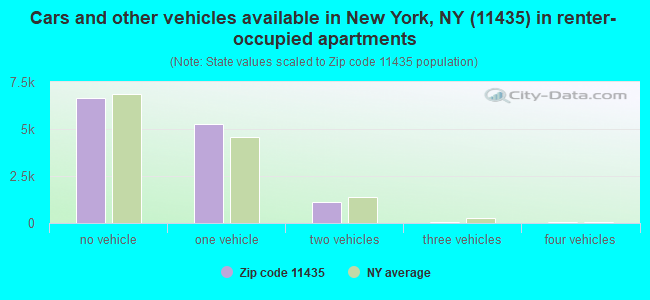
Houses and condos: 20,914 Renter-occupied apartments: 12,874
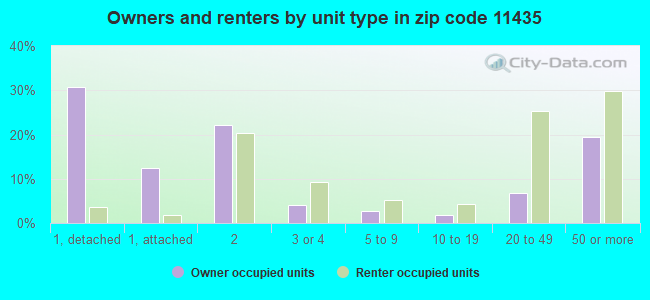
% of renters here:
65%
State:
46%
March 2022 cost of living index in zip code 11435: 148.3 (very high, U.S. average is 100)
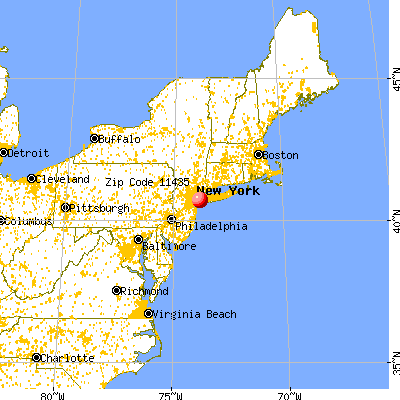
Land area: 1.5 sq. mi. Water area: 0.0 sq. mi.
Population density: 38,961 people per square mile
(very high).
OSM Map
General Map
Google Map
MSN Map
OSM Map
General Map
Google Map
MSN Map
OSM Map
General Map
Google Map
MSN Map
OSM Map
General Map
Google Map
MSN Map
Please wait while loading the map...
Real estate property taxes paid for housing units in 2022:
This zip code:
0.8% ($4,512)
New York:
1.5% ($6,180)
Median real estate property taxes paid for housing units with mortgages in 2022: $4,620 (0.7%) Median real estate property taxes paid for housing units with no mortgage in 2022: $4,196 (0.9%)
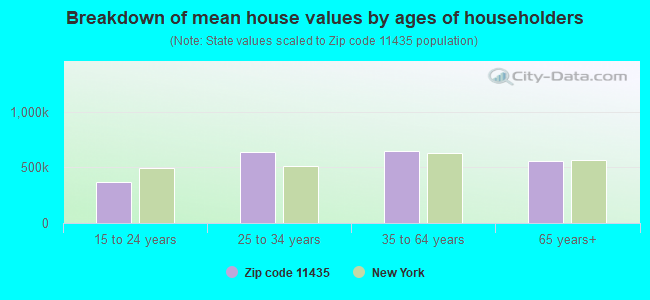
Estimated median house/condo value in 2022: $547,279
11435:
$547,279
New York:
$400,400
According to our research of New York and other state lists, there were 30 registered sex offenders living in 11435 zip code as of April 27, 2024. The ratio of all residents to sex offenders in zip code 11435 is 1,948 to 1. The ratio of registered sex offenders to all residents in this zip code is lower than the state average.
Median resident age:
This zip code:
36.7 years
New York median age:
40.0 years
Average household size:
This zip code:
2.9 people
New York:
2.5 people
Averages for the 2020 tax year for zip code 11435, filed in 2021:
Average Adjusted Gross Income (AGI) in 2020: $45,123 (Individual Income Tax Returns)
Here:
$45,123
State:
$90,930
Salary/wage: $45,674 (reported on 77.0% of returns)
Here:
$45,674
State:
$72,104
(% of AGI for various income ranges: 928.4% for AGIs below $25k, 3410.0% for AGIs $25k-50k, 6980.2% for AGIs $50k-75k, 10589.9% for AGIs $75k-100k, 18587.5% for AGIs $100k-200k, 65392.5% for AGIs over 200k)
Taxable interest for individuals: $819 (reported on 19.1% of returns)
This zip code:
$819
New York:
$3,075
(% of AGI for various income ranges: 8.5% for AGIs below $25k, 9.7% for AGIs $25k-50k, 19.0% for AGIs $50k-75k, 39.4% for AGIs $75k-100k, 89.1% for AGIs $100k-200k, 887.5% for AGIs over 200k)
Ordinary dividends: $2,504 (reported on 8.9% of returns)
Here:
$2,504
State:
$11,095
(% of AGI for various income ranges: 7.8% for AGIs below $25k, 8.7% for AGIs $25k-50k, 19.9% for AGIs $50k-75k, 51.8% for AGIs $75k-100k, 136.0% for AGIs $100k-200k, 2210.0% for AGIs over 200k)
Net capital gain/loss in AGI: +$6,160 (reported on 10.0% of returns)
Here:
+$6,160
State:
+$44,925
(% of AGI for various income ranges: 5.5% for AGIs below $25k, 12.7% for AGIs $25k-50k, 34.2% for AGIs $50k-75k, 84.0% for AGIs $75k-100k, 333.5% for AGIs $100k-200k, 11178.8% for AGIs over 200k)
Profit/loss from business: +$6,486 (reported on 24.1% of returns)
Here:
+$6,486
State:
+$14,940
(% of AGI for various income ranges: 337.5% for AGIs below $25k, 192.4% for AGIs $25k-50k, 83.1% for AGIs $50k-75k, 126.2% for AGIs $75k-100k, 195.6% for AGIs $100k-200k, 1780.0% for AGIs over 200k)
Taxable individual retirement arrangement distribution: $16,069 (reported on 2.5% of returns)
11435:
$16,069
New York:
$19,609
(% of AGI for various income ranges: 16.5% for AGIs below $25k, 21.4% for AGIs $25k-50k, 47.3% for AGIs $50k-75k, 95.9% for AGIs $75k-100k, 204.3% for AGIs $100k-200k, 3680.0% for AGIs over 200k)
Total itemized deductions: $24,792 (reported on 6.4% of returns)
Here:
$24,792
State:
$39,326
(% of AGI for various income ranges: 31.4% for AGIs below $25k, 95.3% for AGIs $25k-50k, 248.6% for AGIs $50k-75k, 561.0% for AGIs $75k-100k, 1116.3% for AGIs $100k-200k, 4340.0% for AGIs over 200k)
Charity contributions: $5,921 (reported on 5.1% of returns)
Here:
$5,921
State:
$15,420
(% of AGI for various income ranges: 2.0% for AGIs below $25k, 13.5% for AGIs $25k-50k, 46.4% for AGIs $50k-75k, 102.6% for AGIs $75k-100k, 235.5% for AGIs $100k-200k, 1212.5% for AGIs over 200k)
Taxes paid: $8,372 (reported on 6.3% of returns)
11435:
$8,372
State:
$9,183
(% of AGI for various income ranges: 6.8% for AGIs below $25k, 26.4% for AGIs $25k-50k, 85.5% for AGIs $50k-75k, 210.4% for AGIs $75k-100k, 409.8% for AGIs $100k-200k, 1067.5% for AGIs over 200k)
Earned income credit: $2,105 (reported on 21.2% of returns)
Here:
$2,105
State:
$2,138
(% of AGI for various income ranges: 108.8% for AGIs below $25k, 81.4% for AGIs $25k-50k, 1.1% for AGIs $50k-75k)
Percentage of individuals using paid preparers for their 2020 taxes: 93.1%
Here:
93%
State:
95%
(% for various income ranges: 89.7% for AGIs below $25k, 95.7% for AGIs $25k-50k, 95.4% for AGIs $50k-75k, 94.5% for AGIs $75k-100k, 94.5% for AGIs $100k-200k, 92.6% for AGIs over 200k)
Averages for the 2012 tax year for zip code 11435, filed in 2013:
Average Adjusted Gross Income (AGI) in 2012: $37,594 (Individual Income Tax Returns)
Here:
$37,594
State:
$77,088
Salary/wage: $39,623 (reported on 79.8% of returns)
Here:
$39,623
State:
$60,593
(% of AGI for various income ranges: 67.0% for AGIs below $25k, 89.9% for AGIs $25k-50k, 90.5% for AGIs $50k-75k, 86.8% for AGIs $75k-100k, 85.8% for AGIs $100k-200k, 64.9% for AGIs over 200k)
Taxable interest for individuals: $693 (reported on 23.1% of returns)
This zip code:
$693
New York:
$3,125
(% of AGI for various income ranges: 0.6% for AGIs below $25k, 0.3% for AGIs $25k-50k, 0.3% for AGIs $50k-75k, 0.5% for AGIs $75k-100k, 0.5% for AGIs $100k-200k, 0.5% for AGIs over 200k)
Ordinary dividends: $2,294 (reported on 8.3% of returns)
Here:
$2,294
State:
$10,299
(% of AGI for various income ranges: 0.5% for AGIs below $25k, 0.3% for AGIs $25k-50k, 0.3% for AGIs $50k-75k, 0.7% for AGIs $75k-100k, 0.7% for AGIs $100k-200k, 1.2% for AGIs over 200k)
Net capital gain/loss in AGI: +$1,749 (reported on 6.4% of returns)
Here:
+$1,749
State:
+$42,474
(% of AGI for various income ranges: 0.4% for AGIs $100k-200k, 5.8% for AGIs over 200k)
Profit/loss from business: +$9,305 (reported on 22.1% of returns)
Here:
+$9,305
State:
+$16,168
(% of AGI for various income ranges: 23.9% for AGIs below $25k, 3.3% for AGIs $25k-50k, 0.8% for AGIs $50k-75k, 1.3% for AGIs $75k-100k, 2.0% for AGIs $100k-200k, 3.4% for AGIs over 200k)
Taxable individual retirement arrangement distribution: $10,624 (reported on 3.3% of returns)
11435:
$10,624
New York:
$17,621
(% of AGI for various income ranges: 1.0% for AGIs below $25k, 0.7% for AGIs $25k-50k, 0.9% for AGIs $50k-75k, 1.2% for AGIs $75k-100k, 1.3% for AGIs $100k-200k)
Self-employment retirement plans: $13,550 (reported on 0.2% of returns)
11435:
$13,550
New York:
$27,330
Total itemized deductions: $18,951 (26% of AGI, reported on 27.9% of returns)
Here:
$18,951
State:
$34,985
Here:
26.3% of AGI
State:
21.3% of AGI
(% of AGI for various income ranges: 5.8% for AGIs below $25k, 11.9% for AGIs $25k-50k, 16.2% for AGIs $50k-75k, 17.4% for AGIs $75k-100k, 18.0% for AGIs $100k-200k, 16.7% for AGIs over 200k)
Charity contributions: $2,802 (reported on 22.6% of returns)
Here:
$2,802
State:
$5,572
(% of AGI for various income ranges: 0.4% for AGIs below $25k, 1.5% for AGIs $25k-50k, 2.1% for AGIs $50k-75k, 2.1% for AGIs $75k-100k, 2.2% for AGIs $100k-200k, 1.9% for AGIs over 200k)
Taxes paid: $7,593 (reported on 27.8% of returns)
11435:
$7,593
State:
$18,656
(% of AGI for various income ranges: 1.6% for AGIs below $25k, 3.1% for AGIs $25k-50k, 5.9% for AGIs $50k-75k, 7.5% for AGIs $75k-100k, 9.3% for AGIs $100k-200k, 10.5% for AGIs over 200k)
Earned income credit: $2,348 (reported on 29.1% of returns)
Here:
$2,348
State:
$2,230
(% of AGI for various income ranges: 9.5% for AGIs below $25k, 1.3% for AGIs $25k-50k)
Percentage of individuals using paid preparers for their 2012 taxes: 72.8%
Here:
73%
State:
66%
(% for various income ranges: 74.1% for AGIs below $25k, 71.7% for AGIs $25k-50k, 71.1% for AGIs $50k-75k, 71.1% for AGIs $75k-100k, 73.9% for AGIs $100k-200k, 64.3% for AGIs over 200k)
Averages for the 2004 tax year for zip code 11435, filed in 2005:
Average Adjusted Gross Income (AGI) in 2004: $32,700 (Individual Income Tax Returns)
Here:
$32,700
State:
$59,519
Salary/wage: $34,083 (reported on 84.0% of returns)
Here:
$34,083
State:
$50,673
(% of AGI for various income ranges: 71.3% for AGIs below $10k, 80.6% for AGIs $10k-25k, 92.5% for AGIs $25k-50k, 91.2% for AGIs $50k-75k, 89.9% for AGIs $75k-100k, 79.1% for AGIs over 100k)
Taxable interest for individuals: $805 (reported on 36.9% of returns)
This zip code:
$805
New York:
$2,377
(% of AGI for various income ranges: 2.1% for AGIs below $10k, 1.1% for AGIs $10k-25k, 0.7% for AGIs $25k-50k, 0.8% for AGIs $50k-75k, 0.8% for AGIs $75k-100k, 1.3% for AGIs over 100k)
Taxable dividends: $1,657 (reported on 11.2% of returns)
Here:
$1,657
State:
$5,394
(% of AGI for various income ranges: 1.0% for AGIs below $10k, 0.5% for AGIs $10k-25k, 0.3% for AGIs $25k-50k, 0.5% for AGIs $50k-75k, 0.7% for AGIs $75k-100k, 1.2% for AGIs over 100k)
Net capital gain/loss: +$2,494 (reported on 8.5% of returns)
Here:
+$2,494
State:
+$23,581
(% of AGI for various income ranges: -1.1% for AGIs below $10k, -0.1% for AGIs $10k-25k, -0.0% for AGIs $25k-50k, 0.2% for AGIs $50k-75k, 0.6% for AGIs $75k-100k, 4.1% for AGIs over 100k)
Profit/loss from business: +$7,942 (reported on 18.4% of returns)
Here:
+$7,942
State:
+$13,809
(% of AGI for various income ranges: 33.6% for AGIs below $10k, 13.0% for AGIs $10k-25k, 2.1% for AGIs $25k-50k, 1.1% for AGIs $50k-75k, 1.1% for AGIs $75k-100k, 2.9% for AGIs over 100k)
IRA payment deduction: $2,859 (reported on 2.5% of returns)
11435:
$2,859
New York:
$3,115
(% of AGI for various income ranges: 0.2% for AGIs below $10k, 0.2% for AGIs $10k-25k, 0.3% for AGIs $25k-50k, 0.2% for AGIs $50k-75k, 0.2% for AGIs $75k-100k, 0.2% for AGIs over 100k)
Self-employed pension: $11,422 (reported on 0.2% of returns)
Here:
$11,422
New York:
$19,016
(% of AGI for various income ranges: 0.1% for AGIs $10k-25k, 0.2% for AGIs $75k-100k, 0.3% for AGIs over 100k)
Total itemized deductions: $16,788 (30% of AGI, reported on 34.8% of returns)
Here:
$16,788
State:
$25,864
Here:
30.2% of AGI
State:
21.9% of AGI
(% of AGI for various income ranges: 5.5% for AGIs below $10k, 11.3% for AGIs $10k-25k, 18.8% for AGIs $25k-50k, 21.2% for AGIs $50k-75k, 20.3% for AGIs $75k-100k, 18.1% for AGIs over 100k)
Charity contributions deductions: $2,818 (5% of AGI, reported on 31.4% of returns)
Here:
$2,818
State:
$4,439
Here:
4.9% of AGI
State:
3.6% of AGI
(% of AGI for various income ranges: 0.4% for AGIs below $10k, 1.4% for AGIs $10k-25k, 2.9% for AGIs $25k-50k, 3.3% for AGIs $50k-75k, 3.1% for AGIs $75k-100k, 2.8% for AGIs over 100k)
Total tax: $3,860 (reported on 70.8% of returns)
11435:
$3,860
State:
$11,730
(% of AGI for various income ranges: 5.6% for AGIs below $10k, 4.1% for AGIs $10k-25k, 5.8% for AGIs $25k-50k, 9.0% for AGIs $50k-75k, 11.1% for AGIs $75k-100k, 15.8% for AGIs over 100k)
Earned income credit: $1,819 (reported on 27.2% of returns)
Here:
$1,819
State:
$1,757
Percentage of individuals using paid preparers for their 2004 taxes: 69.9%
Here:
70%
State:
67%
(% for various income ranges: 66.6% for AGIs below $10k, 73.0% for AGIs $10k-25k, 69.8% for AGIs $25k-50k, 67.8% for AGIs $50k-75k, 69.8% for AGIs $75k-100k, 71.0% for AGIs over 100k)
Likely homosexual households (counted as self-reported same-sex unmarried-partner households)
Lesbian couples: 0.1% of all households
Gay men: 0.1% of all households
Household received Food Stamps/SNAP in the past 12 months: 3,504 Household did not receive Food Stamps/SNAP in the past 12 months: 16,311
Women who had a birth in the past 12 months: 803 (542 now married, 262 unmarried) Women who did not have a birth in the past 12 months: 14,027 (5,793 now married, 8,200 unmarried)
Housing units in zip code 11435 with a mortgage: 4,170 (207 second mortgage, 21 home equity loan, 140 both second mortgage and home equity loan) Houses without a mortgage: 42
Median monthly owner costs for units with a mortgage: $2,557 Median monthly owner costs for units without a mortgage: $871
Residents with income below the poverty level in 2022:
This zip code:
13.7%
Whole state:
14.3%
Residents with income below 50% of the poverty level in 2022:
This zip code:
8.6%
Whole state:
6.8%
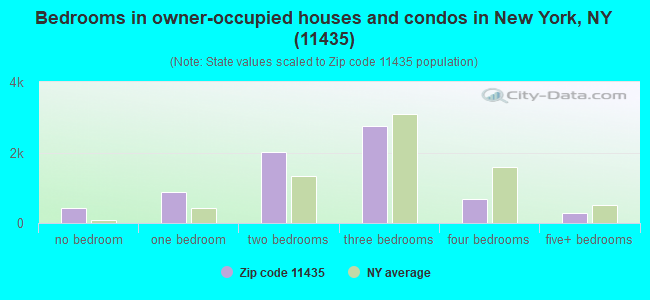
Median number of rooms in houses and condos:
Here:
5.2
State:
6.3
Median number of rooms in apartments:
Here:
3.7
State:
3.8
Notable locations in this zip code not listed on our city pages
Notable locations in zip code 11435: Jamaica Station (A), Queens Civil and Housing Court Building (B), Fire Department New York Engine 303 Ladder 126 (C), New York Ladder Company 126 (D). Display/hide their locations on the map
Churches in zip code 11435 include: Saint Pius V Roman Catholic Church (A), Friendship Baptist Church (B), Community Baptist Church (C), Brooks Memorial Methodist Church (D). Display/hide their locations on the map
Parks in zip code 11435 include: Manton Playground (1), Howard Von Dohlen Playground (2), Norelli-Hargreaves Memorial Triangle (3), Norelli-Hargreaves Playground (4). Display/hide their locations on the map
8,024 married couples with children.
2,702 single-parent households (638 men, 2,064 women).
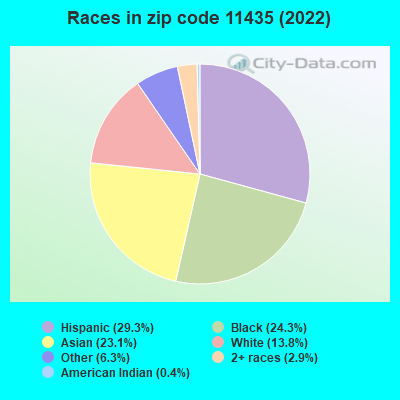
43.8% of residents of 11435 zip code speak English at home.
27.3% of residents speak Spanish at home (41% very well, 22% well, 32% not well, 6% not at all).
21.9% of residents speak other Indo-European language at home (38% very well, 33% well, 26% not well, 4% not at all).
5.4% of residents speak Asian or Pacific Island language at home (41% very well, 29% well, 19% not well, 11% not at all).
1.8% of residents speak other language at home (58% very well, 18% well, 24% not well).
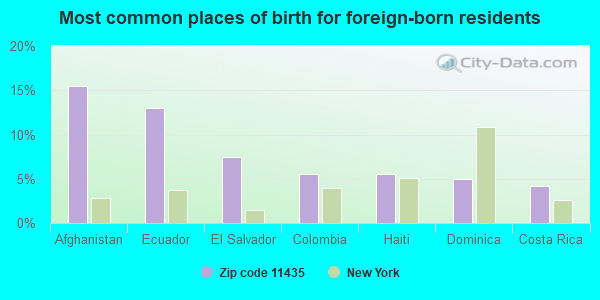
Foreign born population: 29,974 (50.8%) (60.8% of them are naturalized citizens)
This zip code:
50.8%
Whole state:
22.7%
17%Afghanistan
15%Ecuador
6%Dominica
5%El Salvador
5%Haiti
4%Colombia
4%Honduras
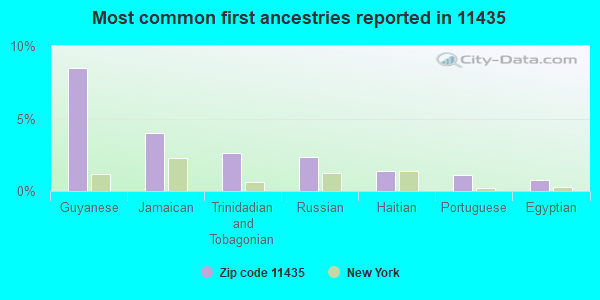
9%Guyanese
4%Jamaican
3%Trinidadian and Tobagonian
2%Russian
1%Haitian
1%Portuguese
1%Egyptian
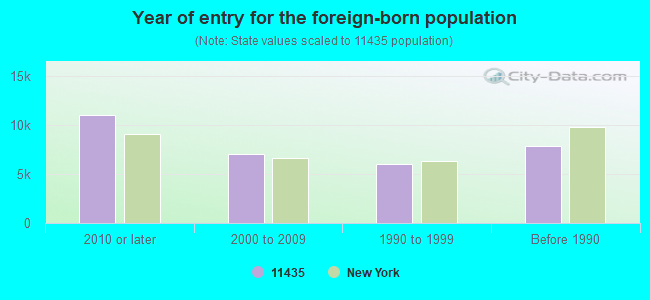
Year of entry for the foreign-born population
11,0302010 or later
7,0042000 to 2009
5,9961990 to 1999
7,867Before 1990
Private high school in in this zip code not listed on the city page:
AL-IMAN SCHOOL(Students: 139, Location: 8989 VAN WYCK EXPY, Grades: PK-12)
Public elementary/middle schools in in zip code 11435 not listed on the city page:
Major facilities with environmental interests located in this zip code:
A & C FRENCH CLEANERS (147-28 HILLSIDE AVENUE in JAMAICA, NY)
AIR MINOR (AIRS/AFS) STATE MASTER (New York facility tracking) - AIR PROGRAM Conditionally Exempt Small Quantity Generators, less than 100 kg/month of hazardous waste (Resource Conservation and Recovery Act (tracking hazardous waste)) - notification Business SIC classification: DRYCLEANING PLANTS, EXCEPT RUG CLEANING Organizations: A & C FRENCH CLEANER INC (CONTACT/OWNER)
, A & C FRENCH CLEANERS INC (LEGALLY RESPONSIBLE PARTY)
AMOCO SERVICE STATION (137-21 JAMAICA AVENUE in JAMAICA, NY)
AIR MINOR (AIRS/AFS) STATE MASTER (New York facility tracking) - AIR PROGRAM Business SIC classification: GASOLINE SERVICE STATIONS Organizations: AUTO DREAMS INTERNATIONAL INC Alternative names: KOSOL SERVICE STATION INCORPORATED, KOSOL SVCE STA INC
ABBOTT INDUSTRIES INCORPORATED (9525 149TH STREET in JAMAICA, NY)
AIR MINOR (AIRS/AFS) CRITERIA AND HAZARDOUS AIR POLLUTANT INVENTORY (Inventory of air pollution sources) Small Quantity Generators, between 100 kg and 1000 kg of hazardous waste/month (Resource Conservation and Recovery Act (tracking hazardous waste)) - notification TRI REPORTER (Tracking of toxic chemicals releasing facilities) Business SIC classification: COATING, ENGRAVING, AND ALLIED SERVICES; MISCELLANEOUS FABRICATED WIRE PRODUCTS Organizations: LEONARD A GROSSMAN (CONTACT/OWNER)
IMPRESS CLEANERS (138-47 QUEENS BLVD in JAMAICA, NY)
AIR MINOR (AIRS/AFS) Conditionally Exempt Small Quantity Generators, less than 100 kg/month of hazardous waste (Resource Conservation and Recovery Act (tracking hazardous waste)) - notification Business SIC classification: DRYCLEANING PLANTS, EXCEPT RUG CLEANING Organizations: GI HA CHOI (CONTACT/OPERATOR)
, DANS SUPREME MOIP ASSOCIATE (CONTACT/OWNER)
, CHUNG AE CHOI (CONTACT/OWNER)
Alternative names: BEST GRACE CLEANERS
CITY READY MIX CORP (14707 LIBERTY AVE in JAMAICA, NY)
(Integrated Compliance Information System) - ICIS-HQ-1997-0302, FORMAL ENFORCEMENT ACTION Business SIC classification: LOCAL TRUCKING WITHOUT STORAGE; CANDY, NUT, AND CONFECTIONERY STORES; AUTOMOTIVE SERVICES, EXCEPT REPAIR AND CARWASHES
HWC DRY CLEANERS (95-19 SUTPHIN BOULEVARD in JAMAICA, NY)
AIR MINOR (AIRS/AFS) Conditionally Exempt Small Quantity Generators, less than 100 kg/month of hazardous waste (Resource Conservation and Recovery Act (tracking hazardous waste)) - notification Business SIC classification: DRYCLEANING PLANTS, EXCEPT RUG CLEANING Organizations: C & G INC (CONTACT/OWNER)
Alternative names: C & G CLEANERS
HAROLDS AUTO REPAIR (139-01 JAMAICA AVE in JAMAICA, NY)
CON ED-MH 2186 (NWC DITMARS BLVD & 28 ST in QUEENS, NY)
HAZARDOUS WASTE BIENNIAL REPORTER (Resource Conservation and Recovery Act (tracking hazardous waste)) (Resource Conservation and Recovery Act (tracking hazardous waste))
CON ED-VAN WYCK EXPWY SER RD (E/S VAN WYCK EXPWY SERVICE RD in QUEENS, NY)
HAZARDOUS WASTE BIENNIAL REPORTER (Resource Conservation and Recovery Act (tracking hazardous waste)) (Resource Conservation and Recovery Act (tracking hazardous waste))
135-10 GRAND CENTRAL PARK BUILDING (135-10 GRAND CENTRAL PARK in QUEENS, NY)
AIR MINOR (AIRS/AFS) Business SIC classification: OPERATORS OF APARTMENT BUILDINGS
GIBRALTAR TRANSMISSION (139-24 HILLSIDE AVE in JAMAICA, NY)
(Resource Conservation and Recovery Act (tracking hazardous waste))
GLOBE PLATING CO INC (148-19 LIBERTY AVE in JAMAICA, NY)
(Resource Conservation and Recovery Act (tracking hazardous waste)) Business NAICS classification: ELECTROPLATING, PLATING, POLISHING, ANODIZING, AND COLORING.
GOLDSMITH CADILLAC (13854 94TH AVE in JAMAICA, NY)
(Resource Conservation and Recovery Act (tracking hazardous waste))
Housing units lacking complete plumbing facilities: 0.3% Housing units lacking complete kitchen facilities: 0.8%
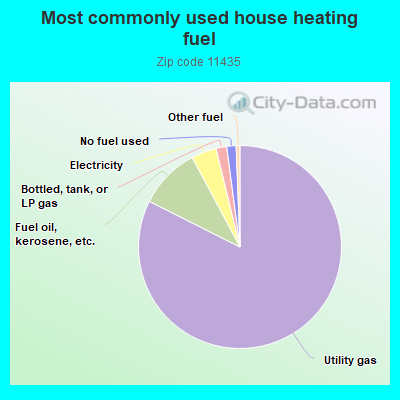
82.5%Utility gas
9.8%Fuel oil, kerosene, etc.
4.0%Electricity
1.7%Bottled, tank, or LP gas
1.5%No fuel used
0.6%Other fuel
Population in 1990: 47,987. Population change in the 1990s: +5,890 (+12.3%).
Place of birth for U.S.-born residents:
This state: 24,940
Northeast: 417
Midwest: 205
South: 1,795
West: 182
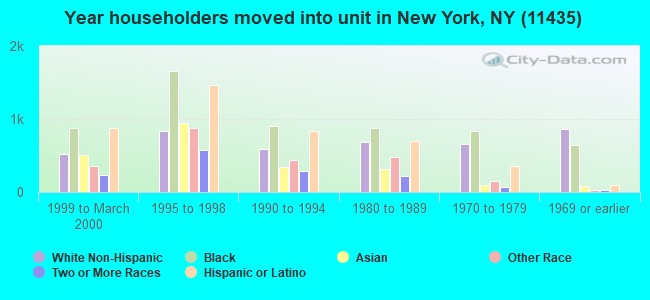
65% of the 11435 zip code residents lived in the same house 5 years ago. Out of people who lived in different houses, 70% lived in this county. Out of people who lived in different counties, 50% lived in New York.
91% of the 11435 zip code residents lived in the same house 1 year ago. Out of people who lived in different houses, 64% moved from this county. Out of people who lived in different houses, 22% moved from different county within same state. Out of people who lived in different houses, 4% moved from different state. Out of people who lived in different houses, 9% moved from abroad.
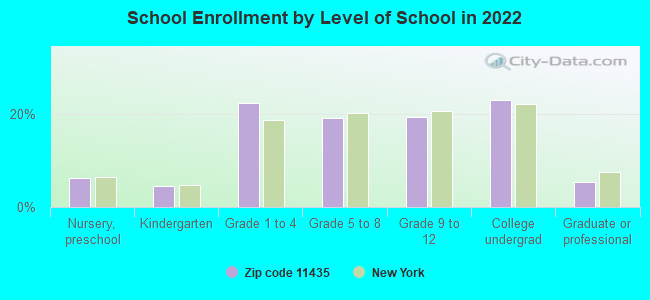
Private vs. public school enrollment:
Students in private schools in grades 1 to 8 (elementary and middle school): 851
Here:
15.8%
New York:
15.6%
Students in private schools in grades 9 to 12 (high school): 392
Here:
15.6%
New York:
15.0%
Students in private undergraduate colleges: 842
Here:
28.4%
New York:
39.2%
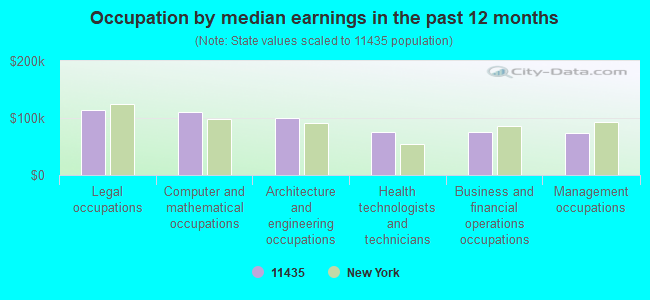
Occupation by median earnings in the past 12 months ($)
113,664Legal occupations
109,939Computer and mathematical occupations
100,014Architecture and engineering occupations
76,031Health technologists and technicians
74,922Business and financial operations occupations
73,632Management occupations
Companies with federal contracts located in this zip code:
ROSCO INC (14431 91ST AVE in JAMAICA, NY; small business) : $5,913,905 in 66 contractsfrom 2000 to 2006
Contracts for Vehicular Furniture and Accessories by Defense Logistics Agency Signed by year:2000: $543,787; 2001: $214,963; 2002: $373,909; 2003: $1,833,659; 2004: $1,242,969; 2005: $884,096; 2006: $820,522.
Biggest contracts:
$718,524 with Defense Logistics Agency for Vehicular Furniture and Accessories. Signed on 2006-05-10. Completion date: 2006-09-30.
$595,322, same as above.Signed on 2004-12-01. Completion date: 2005-08-03.
$429,000, same as above.Signed on 2003-12-08. Completion date: 2004-08-04.
$400,400, same as above.Signed on 2003-10-30. Completion date: 2004-06-06.
MAJESTIC SISTERS CONTRACTING L (147-07 LIBERTY AVENUE in JAMAICA, NY; small business) : $15,800 in 2 contractsin 2003
$9,500 with Army for Maintenance, Repair or Alteration of Real Property -- Other Administrative Facilities and Service Buildings. Signed on 2003-07-03. Completion date: 2003-09-30.
$6,300 with Army for Installation of Equipment -- Electrical and Electronic Equipment Components. Signed on 2003-07-03. Completion date: 2003-07-25.
CAPRI HOUSEKEEPING INC (11133 147TH ST in JAMAICA, NY; small business) : $14,375 in 3 contractsin 2005
$8,625 with Army for Custodial Janitorial Services. Signed on 2005-03-18. Completion date: 2005-05-15.
$2,875, same as above.Signed on 2005-01-26. Completion date: 2005-02-05.
$2,875, same as above.Signed on 2005-01-07. Completion date: 2005-01-09.
Top industries in this zip code by the number of employees in 2005:
Health Care and Social Assistance: Nursing Care Facilities (500-999 employees: 1 establishment)
Health Care and Social Assistance: Home Health Care Services (250-499: 1)
Health Care and Social Assistance: Residential Mental Health and Substance Abuse Facilities (250-499: 1)
2007 - 2018 National Fire Incident Reporting System (NFIRS) incidents
According to the data from the years 2007 - 2018 the average number of fire incidents per year is 195. The highest number of reported fires - 265 took place in 2008, and the least - 140 in 2007. The data has a rising trend.
When looking into fire subcategories, the most incidents belonged to: Structure Fires (67.1%), and Outside Fires (16.8%).
Fire incident types reported to NFIRS in Zip Code 11435


 Nearest zip codes: 11451, 11419, 11415, 11432, 11424, 11433.


 (Students: 139, Location: 8989 VAN WYCK EXPY, Grades: PK-12)
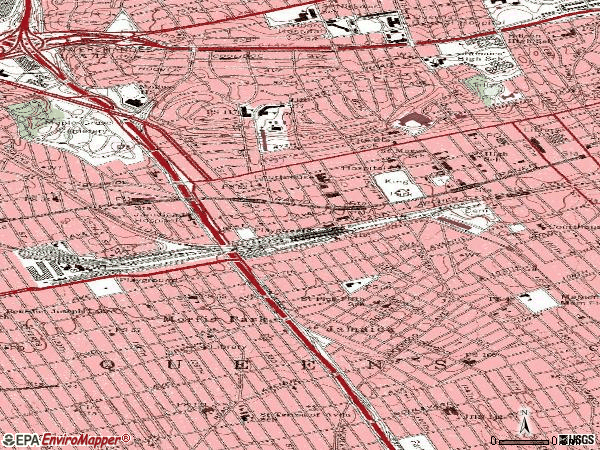
 According to the data from the years 2007 - 2018 the average number of fire incidents per year is 195. The highest number of reported fires - 265 took place in 2008, and the least - 140 in 2007. The data has a rising trend.
 When looking into fire subcategories, the most incidents belonged to: Structure Fires (67.1%), and Outside Fires (16.8%).