Estimated zip code population in 2022: 110,961 Zip code population in 2010: 109,931 Zip code population in 2000: 98,841
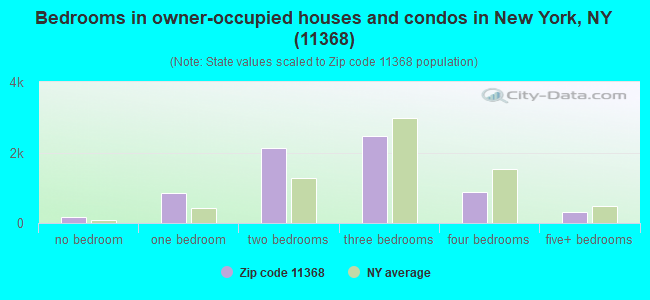
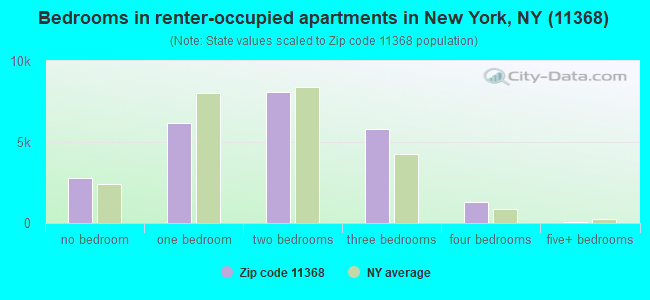
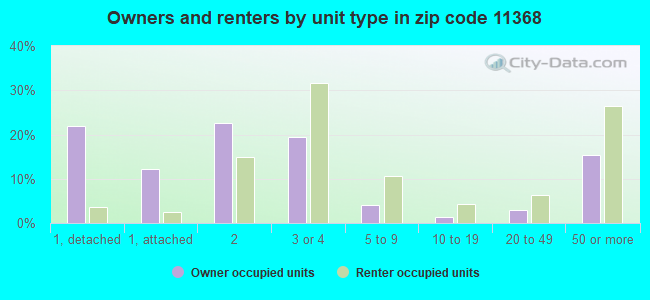
Houses and condos: 31,910 Renter-occupied apartments: 24,138
% of renters here:
78%
State:
46%
March 2022 cost of living index in zip code 11368: 156.9 (very high, U.S. average is 100)
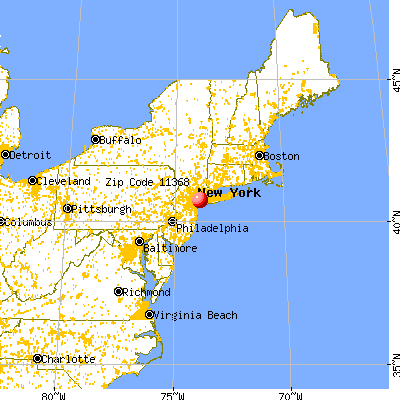
Land area: 2.6 sq. mi. Water area: 0.0 sq. mi.
Population density: 42,166 people per square mile
(very high).
OSM Map
General Map
Google Map
MSN Map
OSM Map
General Map
Google Map
MSN Map
OSM Map
General Map
Google Map
MSN Map
OSM Map
General Map
Google Map
MSN Map
Please wait while loading the map...
Real estate property taxes paid for housing units in 2022:
This zip code:
0.6% ($5,017)
New York:
1.5% ($6,180)
Median real estate property taxes paid for housing units with mortgages in 2022: $5,173 (0.6%) Median real estate property taxes paid for housing units with no mortgage in 2022: $4,793 (0.7%)
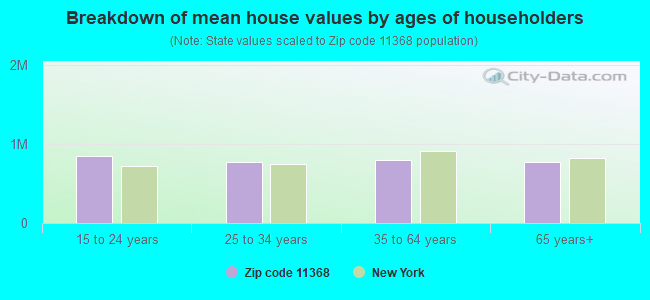
Estimated median house/condo value in 2022: $831,031
11368:
$831,031
New York:
$400,400
According to our research of New York and other state lists, there were 70 registered sex offenders living in 11368 zip code as of April 27, 2024. The ratio of all residents to sex offenders in zip code 11368 is 1,637 to 1. The ratio of registered sex offenders to all residents in this zip code is lower than the state average.
Median resident age:
This zip code:
35.2 years
New York median age:
40.0 years
Average household size:
This zip code:
3.6 people
New York:
2.5 people
Averages for the 2020 tax year for zip code 11368, filed in 2021:
Average Adjusted Gross Income (AGI) in 2020: $31,097 (Individual Income Tax Returns)
Here:
$31,097
State:
$90,930
Salary/wage: $32,961 (reported on 69.6% of returns)
Here:
$32,961
State:
$72,104
(% of AGI for various income ranges: 1060.6% for AGIs below $25k, 3455.6% for AGIs $25k-50k, 7031.4% for AGIs $50k-75k, 10457.4% for AGIs $75k-100k, 17476.8% for AGIs $100k-200k, 47941.7% for AGIs over 200k)
Taxable interest for individuals: $557 (reported on 10.0% of returns)
This zip code:
$557
New York:
$3,075
(% of AGI for various income ranges: 4.3% for AGIs below $25k, 4.6% for AGIs $25k-50k, 12.7% for AGIs $50k-75k, 20.8% for AGIs $75k-100k, 78.1% for AGIs $100k-200k, 295.0% for AGIs over 200k)
Ordinary dividends: $1,496 (reported on 3.8% of returns)
Here:
$1,496
State:
$11,095
(% of AGI for various income ranges: 2.3% for AGIs below $25k, 2.7% for AGIs $25k-50k, 9.1% for AGIs $50k-75k, 25.7% for AGIs $75k-100k, 116.0% for AGIs $100k-200k, 775.0% for AGIs over 200k)
Net capital gain/loss in AGI: +$4,760 (reported on 4.9% of returns)
Here:
+$4,760
State:
+$44,925
(% of AGI for various income ranges: 0.1% for AGIs below $25k, 6.9% for AGIs $25k-50k, 22.8% for AGIs $50k-75k, 71.9% for AGIs $75k-100k, 289.2% for AGIs $100k-200k, 11090.0% for AGIs over 200k)
Profit/loss from business: +$7,920 (reported on 31.6% of returns)
Here:
+$7,920
State:
+$14,940
(% of AGI for various income ranges: 606.5% for AGIs below $25k, 253.7% for AGIs $25k-50k, 139.8% for AGIs $50k-75k, 181.9% for AGIs $75k-100k, 337.3% for AGIs $100k-200k, 3580.0% for AGIs over 200k)
Taxable individual retirement arrangement distribution: $10,467 (reported on 1.0% of returns)
11368:
$10,467
New York:
$19,609
(% of AGI for various income ranges: 7.3% for AGIs below $25k, 9.0% for AGIs $25k-50k, 28.0% for AGIs $50k-75k, 54.3% for AGIs $75k-100k, 151.0% for AGIs $100k-200k)
Total itemized deductions: $23,290 (reported on 2.2% of returns)
Here:
$23,290
State:
$39,326
(% of AGI for various income ranges: 18.1% for AGIs below $25k, 44.3% for AGIs $25k-50k, 153.6% for AGIs $50k-75k, 344.8% for AGIs $75k-100k, 654.7% for AGIs $100k-200k, 2536.7% for AGIs over 200k)
Charity contributions: $5,935 (reported on 1.3% of returns)
Here:
$5,935
State:
$15,420
(% of AGI for various income ranges: 0.6% for AGIs below $25k, 4.6% for AGIs $25k-50k, 23.7% for AGIs $50k-75k, 54.9% for AGIs $75k-100k, 141.1% for AGIs $100k-200k, 673.3% for AGIs over 200k)
Taxes paid: $7,935 (reported on 2.2% of returns)
11368:
$7,935
State:
$9,183
(% of AGI for various income ranges: 5.2% for AGIs below $25k, 12.7% for AGIs $25k-50k, 50.9% for AGIs $50k-75k, 129.1% for AGIs $75k-100k, 255.3% for AGIs $100k-200k, 733.3% for AGIs over 200k)
Earned income credit: $2,245 (reported on 22.8% of returns)
Here:
$2,245
State:
$2,138
(% of AGI for various income ranges: 116.1% for AGIs below $25k, 86.3% for AGIs $25k-50k, 1.3% for AGIs $50k-75k)
Percentage of individuals using paid preparers for their 2020 taxes: 87.5%
Here:
87%
State:
95%
(% for various income ranges: 82.1% for AGIs below $25k, 93.5% for AGIs $25k-50k, 93.4% for AGIs $50k-75k, 94.6% for AGIs $75k-100k, 93.2% for AGIs $100k-200k, 94.1% for AGIs over 200k)
Averages for the 2012 tax year for zip code 11368, filed in 2013:
Average Adjusted Gross Income (AGI) in 2012: $25,808 (Individual Income Tax Returns)
Here:
$25,808
State:
$77,088
Salary/wage: $29,305 (reported on 73.3% of returns)
Here:
$29,305
State:
$60,593
(% of AGI for various income ranges: 66.8% for AGIs below $25k, 92.0% for AGIs $25k-50k, 91.8% for AGIs $50k-75k, 90.3% for AGIs $75k-100k, 85.8% for AGIs $100k-200k, 43.0% for AGIs over 200k)
Taxable interest for individuals: $385 (reported on 12.7% of returns)
This zip code:
$385
New York:
$3,125
(% of AGI for various income ranges: 0.2% for AGIs below $25k, 0.1% for AGIs $25k-50k, 0.2% for AGIs $50k-75k, 0.2% for AGIs $75k-100k, 0.2% for AGIs $100k-200k, 0.6% for AGIs over 200k)
Ordinary dividends: $1,907 (reported on 3.1% of returns)
Here:
$1,907
State:
$10,299
(% of AGI for various income ranges: 0.1% for AGIs below $25k, 0.1% for AGIs $25k-50k, 0.3% for AGIs $50k-75k, 0.3% for AGIs $75k-100k, 0.4% for AGIs $100k-200k, 2.1% for AGIs over 200k)
Net capital gain/loss in AGI: +$297 (reported on 2.5% of returns)
Here:
+$297
State:
+$42,474
(% of AGI for various income ranges: 0.6% for AGIs $100k-200k, 1.2% for AGIs over 200k)
Profit/loss from business: +$8,672 (reported on 29.8% of returns)
Here:
+$8,672
State:
+$16,168
(% of AGI for various income ranges: 29.0% for AGIs below $25k, 3.8% for AGIs $25k-50k, 1.1% for AGIs $50k-75k, 0.7% for AGIs $75k-100k, 1.7% for AGIs $100k-200k)
Taxable individual retirement arrangement distribution: $8,427 (reported on 1.3% of returns)
11368:
$8,427
New York:
$17,621
(% of AGI for various income ranges: 0.3% for AGIs below $25k, 0.3% for AGIs $25k-50k, 0.5% for AGIs $50k-75k, 0.5% for AGIs $75k-100k, 1.2% for AGIs $100k-200k)
Self-employment retirement plans: $7,400 (reported on 0.0% of returns)
11368:
$7,400
New York:
$27,330
Total itemized deductions: $16,708 (30% of AGI, reported on 16.3% of returns)
Here:
$16,708
State:
$34,985
Here:
29.7% of AGI
State:
21.3% of AGI
(% of AGI for various income ranges: 3.8% for AGIs below $25k, 11.1% for AGIs $25k-50k, 14.2% for AGIs $50k-75k, 15.5% for AGIs $75k-100k, 16.7% for AGIs $100k-200k, 14.3% for AGIs over 200k)
Charity contributions: $2,318 (reported on 12.0% of returns)
Here:
$2,318
State:
$5,572
(% of AGI for various income ranges: 0.3% for AGIs below $25k, 1.0% for AGIs $25k-50k, 1.7% for AGIs $50k-75k, 1.7% for AGIs $75k-100k, 1.9% for AGIs $100k-200k, 1.7% for AGIs over 200k)
Taxes paid: $5,492 (reported on 16.2% of returns)
11368:
$5,492
State:
$18,656
(% of AGI for various income ranges: 0.7% for AGIs below $25k, 2.6% for AGIs $25k-50k, 4.8% for AGIs $50k-75k, 6.8% for AGIs $75k-100k, 8.2% for AGIs $100k-200k, 10.1% for AGIs over 200k)
Earned income credit: $2,446 (reported on 31.6% of returns)
Here:
$2,446
State:
$2,230
(% of AGI for various income ranges: 9.0% for AGIs below $25k, 1.2% for AGIs $25k-50k)
Percentage of individuals using paid preparers for their 2012 taxes: 76.4%
Here:
76%
State:
66%
(% for various income ranges: 75.9% for AGIs below $25k, 78.3% for AGIs $25k-50k, 74.9% for AGIs $50k-75k, 75.2% for AGIs $75k-100k, 76.2% for AGIs $100k-200k, 80.0% for AGIs over 200k)
Averages for the 2004 tax year for zip code 11368, filed in 2005:
Average Adjusted Gross Income (AGI) in 2004: $23,326 (Individual Income Tax Returns)
Here:
$23,326
State:
$59,519
Salary/wage: $25,908 (reported on 78.8% of returns)
Here:
$25,908
State:
$50,673
(% of AGI for various income ranges: 63.8% for AGIs below $10k, 82.0% for AGIs $10k-25k, 94.9% for AGIs $25k-50k, 92.8% for AGIs $50k-75k, 89.4% for AGIs $75k-100k, 70.1% for AGIs over 100k)
Taxable interest for individuals: $566 (reported on 25.3% of returns)
This zip code:
$566
New York:
$2,377
(% of AGI for various income ranges: 1.2% for AGIs below $10k, 0.5% for AGIs $10k-25k, 0.5% for AGIs $25k-50k, 0.5% for AGIs $50k-75k, 0.7% for AGIs $75k-100k, 1.3% for AGIs over 100k)
Taxable dividends: $1,468 (reported on 5.0% of returns)
Here:
$1,468
State:
$5,394
(% of AGI for various income ranges: 0.4% for AGIs below $10k, 0.2% for AGIs $10k-25k, 0.1% for AGIs $25k-50k, 0.3% for AGIs $50k-75k, 0.6% for AGIs $75k-100k, 1.7% for AGIs over 100k)
Net capital gain/loss: +$4,451 (reported on 3.7% of returns)
Here:
+$4,451
State:
+$23,581
(% of AGI for various income ranges: -0.4% for AGIs below $10k, -0.0% for AGIs $10k-25k, 0.1% for AGIs $25k-50k, 0.5% for AGIs $50k-75k, 0.5% for AGIs $75k-100k, 9.8% for AGIs over 100k)
Profit/loss from business: +$7,122 (reported on 24.7% of returns)
Here:
+$7,122
State:
+$13,809
(% of AGI for various income ranges: 45.7% for AGIs below $10k, 14.4% for AGIs $10k-25k, 1.9% for AGIs $25k-50k, 0.8% for AGIs $50k-75k, 1.4% for AGIs $75k-100k, 3.8% for AGIs over 100k)
IRA payment deduction: $2,825 (reported on 1.4% of returns)
11368:
$2,825
New York:
$3,115
(% of AGI for various income ranges: 0.1% for AGIs below $10k, 0.1% for AGIs $10k-25k, 0.2% for AGIs $25k-50k, 0.1% for AGIs $50k-75k, 0.2% for AGIs $75k-100k, 0.2% for AGIs over 100k)
Self-employed pension: $12,182 (reported on 0.1% of returns)
Here:
$12,182
New York:
$19,016
Total itemized deductions: $15,338 (35% of AGI, reported on 24.2% of returns)
Here:
$15,338
State:
$25,864
Here:
34.9% of AGI
State:
21.9% of AGI
(% of AGI for various income ranges: 4.4% for AGIs below $10k, 10.6% for AGIs $10k-25k, 18.8% for AGIs $25k-50k, 20.0% for AGIs $50k-75k, 19.2% for AGIs $75k-100k, 15.7% for AGIs over 100k)
Charity contributions deductions: $2,427 (5% of AGI, reported on 20.8% of returns)
Here:
$2,427
State:
$4,439
Here:
5.3% of AGI
State:
3.6% of AGI
(% of AGI for various income ranges: 0.2% for AGIs below $10k, 1.0% for AGIs $10k-25k, 2.5% for AGIs $25k-50k, 3.2% for AGIs $50k-75k, 3.2% for AGIs $75k-100k, 2.4% for AGIs over 100k)
Total tax: $2,352 (reported on 65.3% of returns)
11368:
$2,352
State:
$11,730
(% of AGI for various income ranges: 7.0% for AGIs below $10k, 3.9% for AGIs $10k-25k, 5.0% for AGIs $25k-50k, 8.6% for AGIs $50k-75k, 11.0% for AGIs $75k-100k, 15.7% for AGIs over 100k)
Earned income credit: $1,925 (reported on 34.8% of returns)
Here:
$1,925
State:
$1,757
Percentage of individuals using paid preparers for their 2004 taxes: 71.3%
Here:
71%
State:
67%
(% for various income ranges: 67.6% for AGIs below $10k, 74.9% for AGIs $10k-25k, 71.2% for AGIs $25k-50k, 70.6% for AGIs $50k-75k, 69.9% for AGIs $75k-100k, 75.1% for AGIs over 100k)
Likely homosexual households (counted as self-reported same-sex unmarried-partner households)
Lesbian couples: 0.0% of all households
Gay men: 0.0% of all households
Household received Food Stamps/SNAP in the past 12 months: 9,211 Household did not receive Food Stamps/SNAP in the past 12 months: 22,076
Women who had a birth in the past 12 months: 1,131 (660 now married, 477 unmarried) Women who did not have a birth in the past 12 months: 24,580 (9,523 now married, 15,028 unmarried)
Housing units in zip code 11368 with a mortgage: 3,559 (249 second mortgage, 7 home equity loan, 214 both second mortgage and home equity loan) Houses without a mortgage: 51
Median monthly owner costs for units with a mortgage: $2,984 Median monthly owner costs for units without a mortgage: $821
Residents with income below the poverty level in 2022:
This zip code:
17.7%
Whole state:
14.3%
Residents with income below 50% of the poverty level in 2022:
This zip code:
11.2%
Whole state:
6.8%
Median number of rooms in houses and condos:
Here:
4.9
State:
6.3
Median number of rooms in apartments:
Here:
3.9
State:
3.8
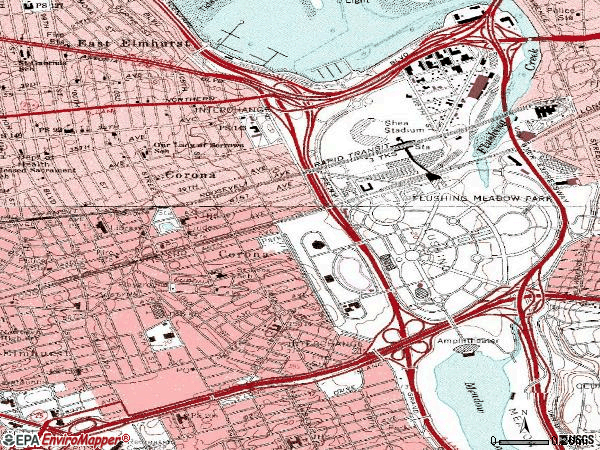
Notable locations in this zip code not listed on our city pages
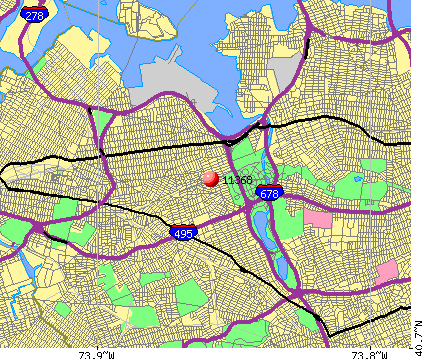
Notable locations in zip code 11368: Louis Armstrong Stadium (A), Arthur Ashe Stadium (B), Shea Stadium Station (C), Citi Field (D), Iron Triangle (E), Florence E Smith Community Center (F), Louis Armstrong House Museum (G), New York Hall of Science (H), Queens Museum of Art (I), Fire Department New York Engine 289 Ladder 138 (J), Fire Department New York Engine 324 Satellite 4 Division 14 (K), New York Ladder Company 138 (L), New York Satellite Company 4 (M), Terrace On the Park (N). Display/hide their locations on the map
Churches in zip code 11368 include: Day Star Church of Christ (A), Corona Congregation of Jehovah's Witnesses (B), Corona Christian Church (C), Church of Pentecost Queens (D), Church of God (E), Christian Universal Baptist Church (F), John 3:16 Christian Church (G), Centro Biblico (H), Antioch Baptist Church (I). Display/hide their locations on the map
Parks in zip code 11368 include: Unisphere (1), Corona Mac Park (2), Lewis Simeone Park (3), Josephine Caminiti Playground (4), William F Moore Park (5), Corona Golf Playground (6), Veteran's Square (7), National Plaza (8), U S Tennis Association Billie Jean King National Tennis Center (9). Display/hide their locations on the map
13,167 married couples with children.
7,933 single-parent households (3,073 men, 4,860 women).
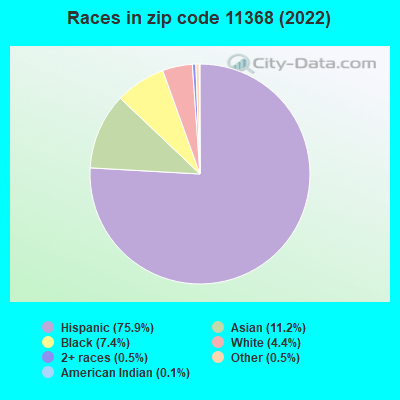
14.6% of residents of 11368 zip code speak English at home.
70.8% of residents speak Spanish at home (36% very well, 20% well, 30% not well, 13% not at all).
4.4% of residents speak other Indo-European language at home (46% very well, 27% well, 19% not well, 8% not at all).
8.1% of residents speak Asian or Pacific Island language at home (31% very well, 22% well, 30% not well, 17% not at all).
2.2% of residents speak other language at home (86% very well, 9% well, 6% not well).
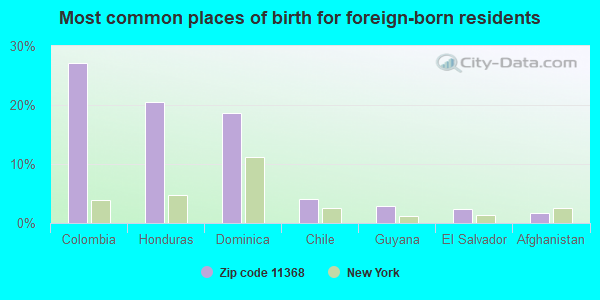
Foreign born population: 66,464 (59.9%) (36.9% of them are naturalized citizens)
This zip code:
59.9%
Whole state:
22.7%
27%Colombia
21%Honduras
19%Dominica
4%Chile
3%Guyana
2%El Salvador
2%Afghanistan
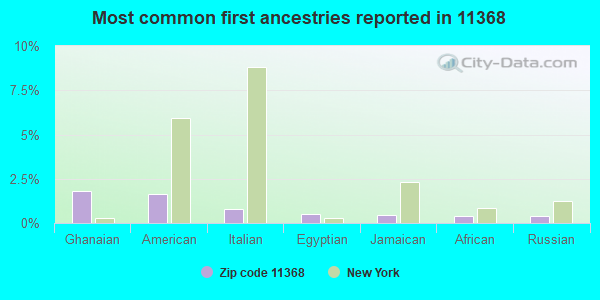
2%Ghanaian
2%American
1%Italian
0%Egyptian
0%Jamaican
0%African
0%Russian
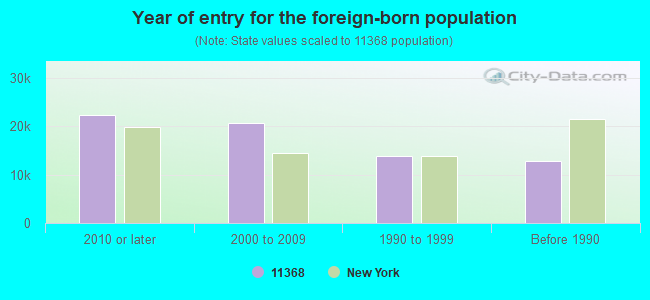
Year of entry for the foreign-born population
22,2962010 or later
20,6432000 to 2009
13,8341990 to 1999
12,833Before 1990
Major facilities with environmental interests located in this zip code:
ACETO CHEMICAL COMPANY INCORPORATED (126-02 NORTHERN BLVD in FLUSHING, NY)
(Integrated Compliance Information System) - ICIS-02-1989-0388, FORMAL ENFORCEMENT ACTION, ICIS-02-1988-0171, COMPLIANCE ACTIVITY (Tracking inspections of insecticide, fungicide, and rodenticide, and toxic substances) (Resource Conservation and Recovery Act (tracking hazardous waste)) Business SIC classification: CHEMICALS AND CHEMICAL PREPARATIONS; CHEMICALS AND ALLIED PRODUCTS Business NAICS classification: ALL OTHER MISCELLANEOUS CHEMICAL PRODUCT AND PREPARATION MANUFACTURING. Alternative names: ACETO AGRICULTURAL CHEMICAL CORP, ACETO AGRICULTURAL CHENICAL CORP
GRACE ASPHALT INC (30-01 HARPER STREET in CORONA, NY)
AIR SYNTHETIC MINOR (AIRS/AFS) STATE MASTER (New York facility tracking) - AIR PROGRAM, AIR MAJOR, SECTION 404 PERMITTING, 401 CERTIFICATION, CRITERIA AND HAZARDOUS AIR POLLUTANT INVENTORY (Inventory of air pollution sources) (Resource Conservation and Recovery Act (tracking hazardous waste)) Business SIC classification: ASPHALT PAVING MIXTURES AND BLOCKS; NONCLASSIFIABLE ESTABLISHMENTS Business NAICS classification: ASPHALT PAVING MIXTURE AND BLOCK MANUFACTURING. Organizations: NON REGULATED (CONTACT/OWNER)
, GRACE INDUSTRIES INC (LEGALLY RESPONSIBLE PARTY)
Alternative names: GRACE ASPHALT DIV OF GRACE INDUSTRIES
CORONA HEIGHTS CLEANERS (51-09 108TH ST in CORONA, NY)
AIR MINOR (AIRS/AFS) STATE MASTER (New York facility tracking) - AIR PROGRAM Small Quantity Generators, between 100 kg and 1000 kg of hazardous waste/month (Resource Conservation and Recovery Act (tracking hazardous waste)) - notification Business SIC classification: DRYCLEANING PLANTS, EXCEPT RUG CLEANING Business NAICS classification: DRYCLEANING AND LAUNDRY SERVICES (EXCEPT COIN-OPERATED). Organizations: FRANK CUTRONE (CONTACT/OWNER)
CORONA DRY CLEANERS (108-73 ROOSEVELT AVE in CORONA, NY)
AIR MINOR (AIRS/AFS) STATE MASTER (New York facility tracking) - AIR PROGRAM Conditionally Exempt Small Quantity Generators, less than 100 kg/month of hazardous waste (Resource Conservation and Recovery Act (tracking hazardous waste)) Business SIC classification: DRYCLEANING PLANTS, EXCEPT RUG CLEANING Organizations: KEUN HO SONG (CONTACT/OPERATOR)
AMIGO CLEANERS (99-04 37TH AVENUE in CORONA, NY)
AIR MINOR (AIRS/AFS) STATE MASTER (New York facility tracking) - AIR PROGRAM Conditionally Exempt Small Quantity Generators, less than 100 kg/month of hazardous waste (Resource Conservation and Recovery Act (tracking hazardous waste)) - notification Business SIC classification: DRYCLEANING PLANTS, EXCEPT RUG CLEANING Business NAICS classification: DRYCLEANING AND LAUNDRY SERVICES (EXCEPT COIN-OPERATED). Organizations: SIN IN KUN (CONTACT/OWNER)
ALAM AUTO BODY INC (127-42 NORTHERN BLVD in FLUSHING, NY)
AIR MINOR (AIRS/AFS) STATE MASTER (New York facility tracking) - AIR PROGRAM Business SIC classification: TOP, BODY, AND UPHOLSTERY REPAIR SHOPS AND PAINT SHOPS Business NAICS classification: AUTOMOTIVE BODY, PAINT, AND INTERIOR REPAIR AND MAINTENANCE.
INTERNATIONAL AUTOBODY (126-04 37TH AVE in QUEENS, NY)
AIR MINOR (AIRS/AFS) STATE MASTER (New York facility tracking) - AIR PROGRAM Business SIC classification: TOP, BODY, AND UPHOLSTERY REPAIR SHOPS AND PAINT SHOPS Business NAICS classification: AUTOMOTIVE BODY, PAINT, AND INTERIOR REPAIR AND MAINTENANCE. Organizations: LAKY S AUTO BODY & MECHANIC INC (LEGALLY RESPONSIBLE PARTY)
Alternative names: CHERE AUTO REPAIR
CRYSTAL CHEMICAL CORP (101-02 37TH AVE in CORONA, NY)
(Integrated Compliance Information System) - ICIS-02-1989-0278, FORMAL ENFORCEMENT ACTION, ICIS-02-1988-0448, COMPLIANCE ACTIVITY (Tracking inspections of insecticide, fungicide, and rodenticide, and toxic substances) Business SIC classification: SOAP AND OTHER DETERGENTS, EXCEPT SPECIALTY CLEANERS; SPECIALTY CLEANING, POLISHING, AND SANITATION PREPARATIONS
COLUMBIA LEASING - 97-15 BUILDING (97-15 HORACE HARDING EXPRESSWAY in QUEENS, NY)
AIR SYNTHETIC MINOR (AIRS/AFS) STATE MASTER (New York facility tracking) - AIR PROGRAM Business SIC classification: OPERATORS OF APARTMENT BUILDINGS Business NAICS classification: LESSORS OF RESIDENTIAL BUILDINGS AND DWELLINGS. Organizations: COLUMBIA LEASING CORP (LEGALLY RESPONSIBLE PARTY)
IS 61 LEONARDO DA VINCI IS ( in CORONA, NY)
(National Center for Education Statistics) - STATE ID-342400010061 Organizations: NEW YORK CITY PUBLIC SCHOOLS (SCHOOL DISTRICT)
ARTS & BUSINESS HS ( in CORONA, NY)
(National Center for Education Statistics) - STATE ID-347800010550 Organizations: NEW YORK CITY PUBLIC SCHOOLS (SCHOOL DISTRICT)
ASTRO AUTO BODY REPAIR SHOP (126-75 38TH AVE in FLUSHING, NY)
AIR SYNTHETIC MINOR (AIRS/AFS) STATE MASTER (New York facility tracking) - AIR PROGRAM Business SIC classification: TOP, BODY, AND UPHOLSTERY REPAIR SHOPS AND PAINT SHOPS
HELEN DRY CLEANER (108-81 ROOSEVELT AVE in CORONA, NY)
AIR MINOR (AIRS/AFS) Conditionally Exempt Small Quantity Generators, less than 100 kg/month of hazardous waste (Resource Conservation and Recovery Act (tracking hazardous waste)) - notification Business SIC classification: DRYCLEANING PLANTS, EXCEPT RUG CLEANING Organizations: LEE YONG BOM (CONTACT/OWNER)
Alternative names: HELEN FRENCH CLEANERS
Housing units lacking complete plumbing facilities: 0.5% Housing units lacking complete kitchen facilities: 2.1%
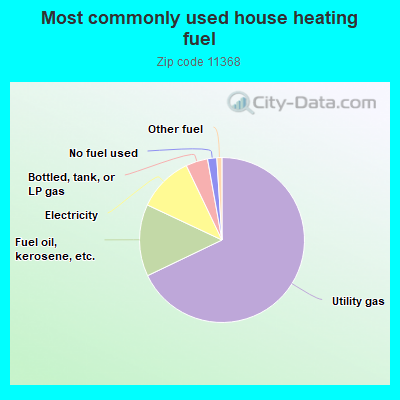
67.9%Utility gas
14.1%Fuel oil, kerosene, etc.
10.9%Electricity
4.3%Bottled, tank, or LP gas
1.8%No fuel used
1.0%Other fuel
Population in 1990: 75,746. Population change in the 1990s: +23,095 (+30.5%).
Place of birth for U.S.-born residents:
This state: 39,164
Northeast: 855
Midwest: 217
South: 1,272
West: 622
62% of the 11368 zip code residents lived in the same house 5 years ago. Out of people who lived in different houses, 81% lived in this county. Out of people who lived in different counties, 50% lived in New York.
93% of the 11368 zip code residents lived in the same house 1 year ago. Out of people who lived in different houses, 63% moved from this county. Out of people who lived in different houses, 13% moved from different county within same state. Out of people who lived in different houses, 6% moved from different state. Out of people who lived in different houses, 17% moved from abroad.
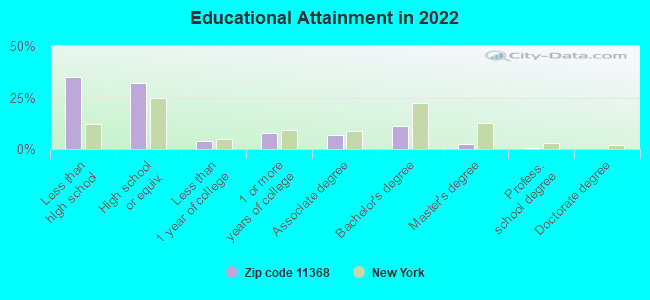
Private vs. public school enrollment:
Students in private schools in grades 1 to 8 (elementary and middle school): 282
Here:
2.4%
New York:
15.6%
Students in private schools in grades 9 to 12 (high school): 137
Here:
2.2%
New York:
15.0%
Students in private undergraduate colleges: 802
Here:
14.5%
New York:
39.2%
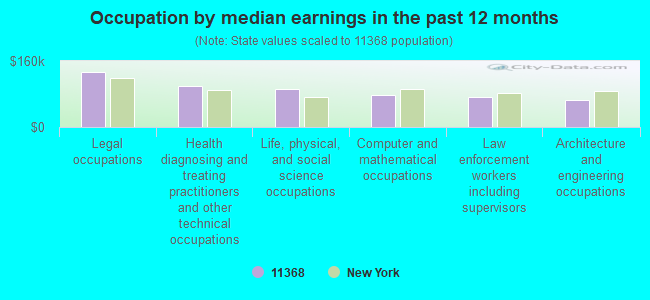
Occupation by median earnings in the past 12 months ($)
133,169Legal occupations
99,801Health diagnosing and treating practitioners and other technical occupations
92,220Life, physical, and social science occupations
77,665Computer and mathematical occupations
73,708Law enforcement workers including supervisors
65,215Architecture and engineering occupations
Companies with federal contracts located in this zip code:
ELLANEF MANUFACTURING CORPORAT (97 11 50TH AVE in CORONA, NY) : $14,238,877 in 37 contractsfrom 1999 to 2006
Contracts for Aircraft Landing Gear Components, Gears, Pulleys, Sprockets, and Transmission Chain, Miscellaneous Power Transmission Equipment, Hardware, Commercial, and moreby Navy, Air Force, Defense Logistics Agency Signed by year:2000: $0; 2001: $2,666,611; 2002: $1,486,048; 2003: $6,152,143; 2004: $2,646,240; 2005: $1,141,831; 2006: $190,187.
Biggest contracts:
$3,766,728 with Navy for Aircraft Landing Gear Components. Signed on 2003-08-12. Completion date: 2006-09-24.
$2,326,956, same as above.Signed on 2001-05-23. Completion date: 2002-10-31.
$1,625,808, same as above.Signed on 2003-02-10. Completion date: 2004-07-06.
$1,592,500, same as above.Signed on 2004-03-23. Completion date: 2006-07-02.
DEP NYC WATERBOARD (5917 JUNCTION BLVD in CORONA, NY) : $210,000 in 4 contractsfrom 2001 to 2004
$60,000 with SOCIAL SECURITY ADMINISTRATION for Water Services. Signed on 2003-10-01. Completion date: 2004-09-30.
$60,000, same as above.Signed on 2001-10-15. Completion date: 2002-09-15.
$60,000, same as above.Signed on 2002-09-15. Completion date: 2003-09-15.
$30,000, same as above.Signed on 2004-04-06. Completion date: 2004-09-30.
JENRY GLOBAL LLC (48-20 111 STREET in CORONA, NY; small business) : $169,637 in 4 contractsfrom 2001 to 2003
$73,721 with Army for Services -- Operational Systems Development (R&D). Signed on 2002-09-23. Completion date: 2003-09-23.
$39,988, same as above.Signed on 2001-10-23. Completion date: 2002-06-28.
$29,930, same as above.Signed on 2001-12-21. Completion date: 2002-08-30.
$25,998, same as above.Signed on 2003-07-07. Completion date: 2003-09-23.
S S PRECISION GEAR & INSTRUME (45-12-104TH STREET in FLUSHING, NY; small business)
$5,000 with Navy for Gears, Pulleys, Sprockets, and Transmission Chain. Taking place in IL. Signed on 2005-09-16. Completion date: 2005-12-15.
Top industries in this zip code by the number of employees in 2005:
2007 - 2018 National Fire Incident Reporting System (NFIRS) incidents
According to the data from the years 2007 - 2018 the average number of fire incidents per year is 229. The highest number of reported fires - 292 took place in 2010, and the least - 150 in 2007. The data has an increasing trend.
When looking into fire subcategories, the most reports belonged to: Structure Fires (58.3%), and Outside Fires (23.3%).
Fire incident types reported to NFIRS in Zip Code 11368


 Nearest zip codes: 11369, 11374, 11373, 11375, 11372, 11354.
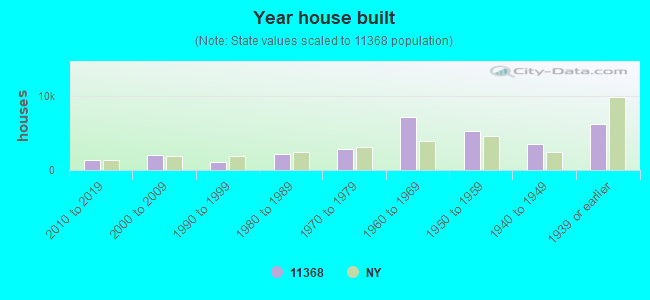


 According to the data from the years 2007 - 2018 the average number of fire incidents per year is 229. The highest number of reported fires - 292 took place in 2010, and the least - 150 in 2007. The data has an increasing trend.
 When looking into fire subcategories, the most reports belonged to: Structure Fires (58.3%), and Outside Fires (23.3%).