Estimated zip code population in 2022: 52,524 Zip code population in 2010: 54,878 Zip code population in 2000: 54,329
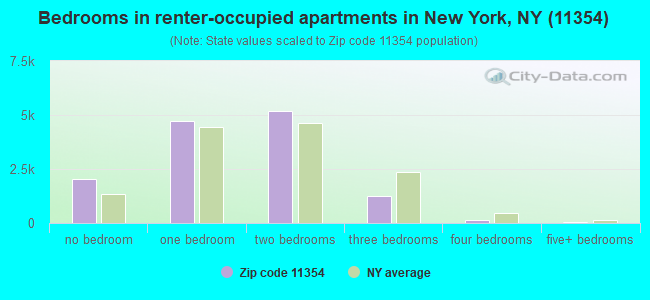
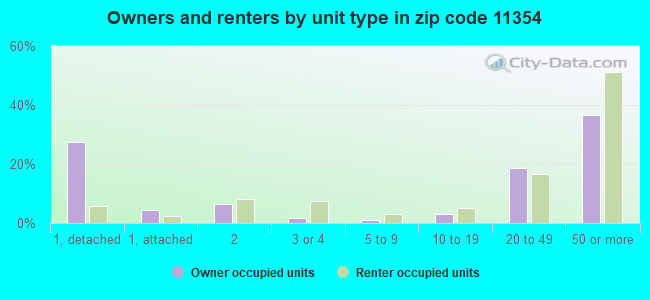
Houses and condos: 23,269 Renter-occupied apartments: 13,313
% of renters here:
62%
State:
46%
March 2022 cost of living index in zip code 11354: 151.7 (very high, U.S. average is 100)
Land area: 2.2 sq. mi. Water area: 0.0 sq. mi.
Population density: 24,237 people per square mile
(very high).
OSM Map
General Map
Google Map
MSN Map
OSM Map
General Map
Google Map
MSN Map
OSM Map
General Map
Google Map
MSN Map
OSM Map
General Map
Google Map
MSN Map
Please wait while loading the map...
Real estate property taxes paid for housing units in 2022:
This zip code:
1.0% ($5,243)
New York:
1.5% ($6,180)
Median real estate property taxes paid for housing units with mortgages in 2022: $6,430 (0.9%) Median real estate property taxes paid for housing units with no mortgage in 2022: $4,769 (1.0%)
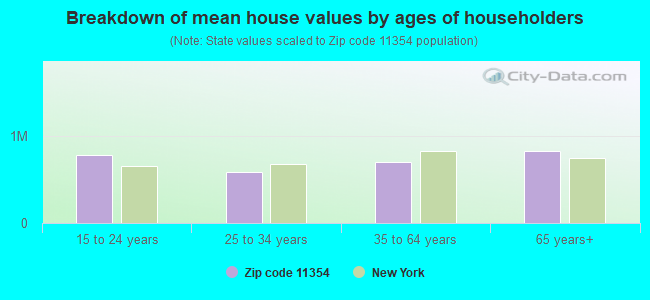
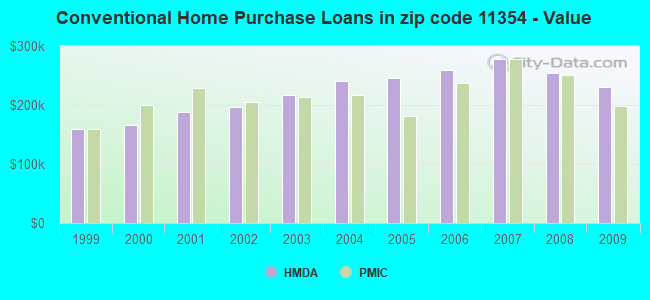
Estimated median house/condo value in 2022: $535,083
11354:
$535,083
New York:
$400,400
According to our research of New York and other state lists, there were 16 registered sex offenders living in 11354 zip code as of April 27, 2024. The ratio of all residents to sex offenders in zip code 11354 is 3,712 to 1. The ratio of registered sex offenders to all residents in this zip code is much lower than the state average.
Median resident age:
This zip code:
48.5 years
New York median age:
40.0 years
Average household size:
This zip code:
2.4 people
New York:
2.5 people
Averages for the 2020 tax year for zip code 11354, filed in 2021:
Average Adjusted Gross Income (AGI) in 2020: $41,770 (Individual Income Tax Returns)
Here:
$41,770
State:
$90,930
Salary/wage: $39,721 (reported on 68.8% of returns)
Here:
$39,721
State:
$72,104
(% of AGI for various income ranges: 911.5% for AGIs below $25k, 3238.4% for AGIs $25k-50k, 7207.4% for AGIs $50k-75k, 10613.5% for AGIs $75k-100k, 19715.0% for AGIs $100k-200k, 78541.2% for AGIs over 200k)
Taxable interest for individuals: $1,656 (reported on 24.5% of returns)
This zip code:
$1,656
New York:
$3,075
(% of AGI for various income ranges: 20.1% for AGIs below $25k, 36.7% for AGIs $25k-50k, 84.8% for AGIs $50k-75k, 144.5% for AGIs $75k-100k, 294.4% for AGIs $100k-200k, 1477.6% for AGIs over 200k)
Ordinary dividends: $3,823 (reported on 14.6% of returns)
Here:
$3,823
State:
$11,095
(% of AGI for various income ranges: 14.4% for AGIs below $25k, 29.9% for AGIs $25k-50k, 97.7% for AGIs $50k-75k, 181.5% for AGIs $75k-100k, 398.2% for AGIs $100k-200k, 3926.5% for AGIs over 200k)
Net capital gain/loss in AGI: +$11,736 (reported on 15.6% of returns)
Here:
+$11,736
State:
+$44,925
(% of AGI for various income ranges: 5.7% for AGIs below $25k, 46.1% for AGIs $25k-50k, 153.3% for AGIs $50k-75k, 344.1% for AGIs $75k-100k, 1039.0% for AGIs $100k-200k, 22698.8% for AGIs over 200k)
Profit/loss from business: +$7,239 (reported on 26.2% of returns)
Here:
+$7,239
State:
+$14,940
(% of AGI for various income ranges: 311.5% for AGIs below $25k, 236.5% for AGIs $25k-50k, 204.2% for AGIs $50k-75k, 200.3% for AGIs $75k-100k, 451.7% for AGIs $100k-200k, 3851.8% for AGIs over 200k)
Taxable individual retirement arrangement distribution: $14,875 (reported on 4.0% of returns)
11354:
$14,875
New York:
$19,609
(% of AGI for various income ranges: 23.5% for AGIs below $25k, 41.3% for AGIs $25k-50k, 127.0% for AGIs $50k-75k, 238.0% for AGIs $75k-100k, 502.1% for AGIs $100k-200k, 2239.4% for AGIs over 200k)
Self-employed (Keogh) retirement plans: $29,880 (reported on 0.1% of returns)
11354:
$29,880
New York:
$32,497
(% of AGI for various income ranges: 23.0% for AGIs $50k-75k, 580.0% for AGIs over 200k)
Total itemized deductions: $29,072 (reported on 4.3% of returns)
Here:
$29,072
State:
$39,326
(% of AGI for various income ranges: 27.5% for AGIs below $25k, 98.4% for AGIs $25k-50k, 239.9% for AGIs $50k-75k, 478.0% for AGIs $75k-100k, 1121.1% for AGIs $100k-200k, 5680.6% for AGIs over 200k)
Charity contributions: $6,455 (reported on 2.9% of returns)
Here:
$6,455
State:
$15,420
(% of AGI for various income ranges: 1.2% for AGIs below $25k, 7.6% for AGIs $25k-50k, 28.9% for AGIs $50k-75k, 70.0% for AGIs $75k-100k, 164.4% for AGIs $100k-200k, 1409.4% for AGIs over 200k)
Taxes paid: $8,527 (reported on 4.3% of returns)
11354:
$8,527
State:
$9,183
(% of AGI for various income ranges: 6.4% for AGIs below $25k, 23.7% for AGIs $25k-50k, 83.1% for AGIs $50k-75k, 169.0% for AGIs $75k-100k, 385.6% for AGIs $100k-200k, 1124.7% for AGIs over 200k)
Earned income credit: $1,399 (reported on 27.1% of returns)
Here:
$1,399
State:
$2,138
(% of AGI for various income ranges: 78.3% for AGIs below $25k, 85.5% for AGIs $25k-50k, 1.1% for AGIs $50k-75k)
Percentage of individuals using paid preparers for their 2020 taxes: 93.4%
Here:
93%
State:
95%
(% for various income ranges: 91.4% for AGIs below $25k, 95.7% for AGIs $25k-50k, 96.2% for AGIs $50k-75k, 96.0% for AGIs $75k-100k, 94.5% for AGIs $100k-200k, 95.3% for AGIs over 200k)
Averages for the 2012 tax year for zip code 11354, filed in 2013:
Average Adjusted Gross Income (AGI) in 2012: $35,618 (Individual Income Tax Returns)
Here:
$35,618
State:
$77,088
Salary/wage: $38,322 (reported on 70.0% of returns)
Here:
$38,322
State:
$60,593
(% of AGI for various income ranges: 61.1% for AGIs below $25k, 82.2% for AGIs $25k-50k, 83.3% for AGIs $50k-75k, 82.2% for AGIs $75k-100k, 78.5% for AGIs $100k-200k, 60.9% for AGIs over 200k)
Taxable interest for individuals: $1,190 (reported on 30.0% of returns)
This zip code:
$1,190
New York:
$3,125
(% of AGI for various income ranges: 1.1% for AGIs below $25k, 0.9% for AGIs $25k-50k, 0.9% for AGIs $50k-75k, 1.0% for AGIs $75k-100k, 1.0% for AGIs $100k-200k, 1.1% for AGIs over 200k)
Ordinary dividends: $3,196 (reported on 14.1% of returns)
Here:
$3,196
State:
$10,299
(% of AGI for various income ranges: 0.9% for AGIs below $25k, 0.9% for AGIs $25k-50k, 1.2% for AGIs $50k-75k, 1.3% for AGIs $75k-100k, 1.5% for AGIs $100k-200k, 1.9% for AGIs over 200k)
Net capital gain/loss in AGI: +$5,352 (reported on 12.0% of returns)
Here:
+$5,352
State:
+$42,474
(% of AGI for various income ranges: 1.1% for AGIs $100k-200k, 13.8% for AGIs over 200k)
Profit/loss from business: +$9,048 (reported on 30.1% of returns)
Here:
+$9,048
State:
+$16,168
(% of AGI for various income ranges: 29.4% for AGIs below $25k, 5.7% for AGIs $25k-50k, 1.8% for AGIs $50k-75k, 1.6% for AGIs $75k-100k, 2.4% for AGIs $100k-200k, 3.1% for AGIs over 200k)
Taxable individual retirement arrangement distribution: $11,091 (reported on 5.6% of returns)
11354:
$11,091
New York:
$17,621
(% of AGI for various income ranges: 1.7% for AGIs below $25k, 1.5% for AGIs $25k-50k, 1.5% for AGIs $50k-75k, 2.2% for AGIs $75k-100k, 2.0% for AGIs $100k-200k, 1.4% for AGIs over 200k)
Self-employment retirement plans: $14,614 (reported on 0.3% of returns)
11354:
$14,614
New York:
$27,330
Total itemized deductions: $21,107 (24% of AGI, reported on 21.1% of returns)
Here:
$21,107
State:
$34,985
Here:
23.7% of AGI
State:
21.3% of AGI
(% of AGI for various income ranges: 4.5% for AGIs below $25k, 9.6% for AGIs $25k-50k, 13.2% for AGIs $50k-75k, 15.9% for AGIs $75k-100k, 17.1% for AGIs $100k-200k, 16.2% for AGIs over 200k)
Charity contributions: $2,628 (reported on 16.5% of returns)
Here:
$2,628
State:
$5,572
(% of AGI for various income ranges: 0.3% for AGIs below $25k, 0.9% for AGIs $25k-50k, 1.4% for AGIs $50k-75k, 1.6% for AGIs $75k-100k, 1.6% for AGIs $100k-200k, 1.6% for AGIs over 200k)
Taxes paid: $10,071 (reported on 21.0% of returns)
11354:
$10,071
State:
$18,656
(% of AGI for various income ranges: 1.2% for AGIs below $25k, 2.8% for AGIs $25k-50k, 5.5% for AGIs $50k-75k, 7.9% for AGIs $75k-100k, 9.5% for AGIs $100k-200k, 10.0% for AGIs over 200k)
Earned income credit: $1,532 (reported on 34.9% of returns)
Here:
$1,532
State:
$2,230
(% of AGI for various income ranges: 7.3% for AGIs below $25k, 1.1% for AGIs $25k-50k)
Percentage of individuals using paid preparers for their 2012 taxes: 76.3%
Here:
76%
State:
66%
(% for various income ranges: 77.7% for AGIs below $25k, 75.2% for AGIs $25k-50k, 73.1% for AGIs $50k-75k, 73.2% for AGIs $75k-100k, 73.6% for AGIs $100k-200k, 72.7% for AGIs over 200k)
Averages for the 2004 tax year for zip code 11354, filed in 2005:
Average Adjusted Gross Income (AGI) in 2004: $33,472 (Individual Income Tax Returns)
Here:
$33,472
State:
$59,519
Salary/wage: $35,389 (reported on 71.7% of returns)
Here:
$35,389
State:
$50,673
(% of AGI for various income ranges: 89.9% for AGIs below $10k, 64.6% for AGIs $10k-25k, 83.9% for AGIs $25k-50k, 83.5% for AGIs $50k-75k, 80.6% for AGIs $75k-100k, 64.5% for AGIs over 100k)
Taxable interest for individuals: $1,532 (reported on 49.6% of returns)
This zip code:
$1,532
New York:
$2,377
(% of AGI for various income ranges: 9.9% for AGIs below $10k, 2.9% for AGIs $10k-25k, 1.8% for AGIs $25k-50k, 1.8% for AGIs $50k-75k, 1.7% for AGIs $75k-100k, 2.2% for AGIs over 100k)
Taxable dividends: $2,686 (reported on 19.7% of returns)
Here:
$2,686
State:
$5,394
(% of AGI for various income ranges: 5.2% for AGIs below $10k, 1.5% for AGIs $10k-25k, 1.1% for AGIs $25k-50k, 1.3% for AGIs $50k-75k, 1.4% for AGIs $75k-100k, 2.0% for AGIs over 100k)
Net capital gain/loss: +$6,434 (reported on 16.8% of returns)
Here:
+$6,434
State:
+$23,581
(% of AGI for various income ranges: -0.4% for AGIs below $10k, -0.2% for AGIs $10k-25k, 0.1% for AGIs $25k-50k, 0.6% for AGIs $50k-75k, 1.1% for AGIs $75k-100k, 11.3% for AGIs over 100k)
Profit/loss from business: +$8,473 (reported on 26.5% of returns)
Here:
+$8,473
State:
+$13,809
(% of AGI for various income ranges: 58.3% for AGIs below $10k, 20.1% for AGIs $10k-25k, 4.6% for AGIs $25k-50k, 1.9% for AGIs $50k-75k, 1.7% for AGIs $75k-100k, 2.7% for AGIs over 100k)
IRA payment deduction: $3,541 (reported on 4.4% of returns)
11354:
$3,541
New York:
$3,115
(% of AGI for various income ranges: 0.2% for AGIs below $10k, 0.5% for AGIs $10k-25k, 0.7% for AGIs $25k-50k, 0.5% for AGIs $50k-75k, 0.4% for AGIs $75k-100k, 0.2% for AGIs over 100k)
Self-employed pension: $12,850 (reported on 0.4% of returns)
Here:
$12,850
New York:
$19,016
Total itemized deductions: $17,887 (25% of AGI, reported on 28.0% of returns)
Here:
$17,887
State:
$25,864
Here:
25.0% of AGI
State:
21.9% of AGI
(% of AGI for various income ranges: 8.6% for AGIs below $10k, 8.1% for AGIs $10k-25k, 13.9% for AGIs $25k-50k, 17.2% for AGIs $50k-75k, 17.8% for AGIs $75k-100k, 17.0% for AGIs over 100k)
Charity contributions deductions: $2,684 (4% of AGI, reported on 24.6% of returns)
Here:
$2,684
State:
$4,439
Here:
3.7% of AGI
State:
3.6% of AGI
(% of AGI for various income ranges: 0.5% for AGIs below $10k, 0.9% for AGIs $10k-25k, 1.8% for AGIs $25k-50k, 2.3% for AGIs $50k-75k, 2.5% for AGIs $75k-100k, 2.4% for AGIs over 100k)
Total tax: $4,804 (reported on 74.3% of returns)
11354:
$4,804
State:
$11,730
(% of AGI for various income ranges: 9.9% for AGIs below $10k, 5.3% for AGIs $10k-25k, 6.9% for AGIs $25k-50k, 9.9% for AGIs $50k-75k, 11.4% for AGIs $75k-100k, 17.3% for AGIs over 100k)
Earned income credit: $1,443 (reported on 24.6% of returns)
Here:
$1,443
State:
$1,757
Percentage of individuals using paid preparers for their 2004 taxes: 72.9%
Here:
73%
State:
67%
(% for various income ranges: 71.7% for AGIs below $10k, 76.0% for AGIs $10k-25k, 71.8% for AGIs $25k-50k, 70.2% for AGIs $50k-75k, 70.6% for AGIs $75k-100k, 75.7% for AGIs over 100k)
Likely homosexual households (counted as self-reported same-sex unmarried-partner households)
Lesbian couples: 0.1% of all households
Gay men: 0.0% of all households
Household received Food Stamps/SNAP in the past 12 months: 3,342 Household did not receive Food Stamps/SNAP in the past 12 months: 18,089
Women who had a birth in the past 12 months: 248 (225 now married, 21 unmarried) Women who did not have a birth in the past 12 months: 11,691 (4,746 now married, 6,921 unmarried)
Housing units in zip code 11354 with a mortgage: 2,397 (186 second mortgage, 109 both second mortgage and home equity loan) Houses without a mortgage: 51
Median monthly owner costs for units with a mortgage: $2,732 Median monthly owner costs for units without a mortgage: $957
Residents with income below the poverty level in 2022:
This zip code:
19.4%
Whole state:
14.3%
Residents with income below 50% of the poverty level in 2022:
This zip code:
10.6%
Whole state:
6.8%
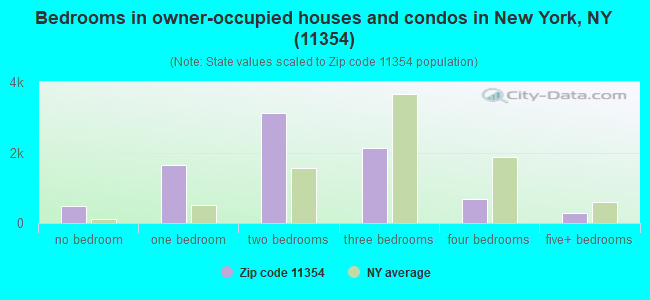
Median number of rooms in houses and condos:
Here:
4.1
State:
6.3
Median number of rooms in apartments:
Here:
3.5
State:
3.8
Notable locations in this zip code not listed on our city pages
Notable locations in zip code 11354: Flushing Station (A), Murray Hill Station (B), College Point Industrial Park (C), Mitchell - Linden Branch Queens Borough Public Library (D), Fire Department New York Engine 273 Ladder 129 (E), New York Ladder Company 129 (F), Bland Community Center (G), Latimar Gardens Community Center (H), Bowne House (I). Display/hide their locations on the map
Churches in zip code 11354 include: Ebenezer Baptist Church (A), Disciples Church of New York (B), Crystal Evangelical Church (C), Calvary Church of New York (D), Bethel Evangelical Church (E), Bethany Christian Church (F), Abundant Presbyterian Church (G), Temple Gates of Prayer (H), Saint George's Episcopal Church (I). Display/hide their locations on the map
Parks in zip code 11354 include: Memorial Field of Flushing (1), Leavitts Park (2), Leonard Square (3), Travis Triangle (4), Daniel Carter Beard Mall (5), Flushing Greens (6), Bland Playground (7), Margaret I Carman Green (8), Hart Playground (9). Display/hide their locations on the map
Tourist attraction (not listed on the city page) : Kingsland House (Historical Places & Services; 14335 37th Avenue).
4,712 married couples with children.
1,604 single-parent households (233 men, 1,371 women).
21.0% of residents of 11354 zip code speak English at home.
12.2% of residents speak Spanish at home (46% very well, 28% well, 23% not well, 4% not at all).
8.6% of residents speak other Indo-European language at home (47% very well, 36% well, 15% not well, 2% not at all).
59.5% of residents speak Asian or Pacific Island language at home (22% very well, 28% well, 36% not well, 14% not at all).
0.5% of residents speak other language at home (100% very well).
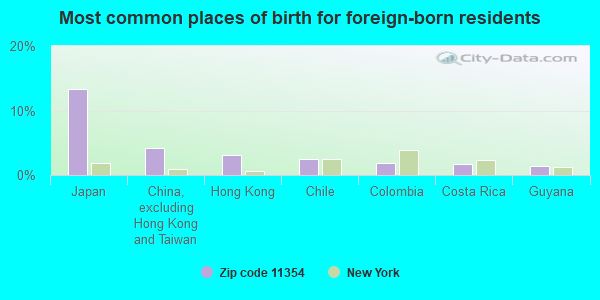
Foreign born population: 35,166 (67.0%) (52.1% of them are naturalized citizens)
This zip code:
67.0%
Whole state:
22.7%
13%Japan
4%China, excluding Hong Kong and Taiwan
3%Hong Kong
2%Chile
2%Colombia
2%Costa Rica
1%Guyana
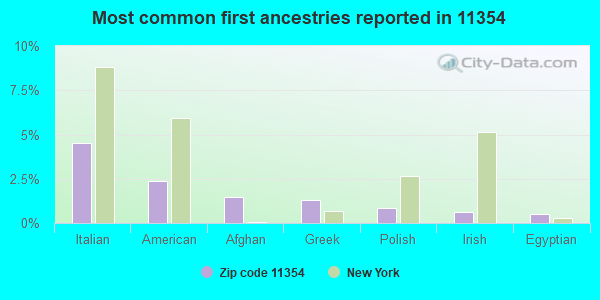
5%Italian
2%American
1%Afghan
1%Greek
1%Polish
1%Irish
0%Egyptian
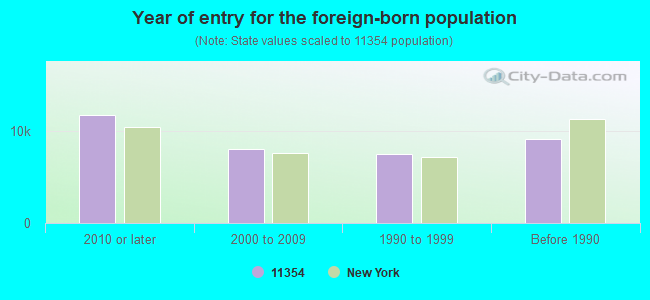
Year of entry for the foreign-born population
11,6822010 or later
8,0512000 to 2009
7,5051990 to 1999
9,132Before 1990
Public high schools in in zip code 11354 not listed on the city page:
Major facilities with environmental interests located in this zip code:
COLLEGE POINT ASPHALT (120-01 31ST AVENUE in FLUSHING, NY)
AIR SYNTHETIC MINOR (AIRS/AFS) STATE MASTER (New York facility tracking) - SECTION 404 PERMITTING, AIR PROGRAM, (Resource Conservation and Recovery Act (tracking hazardous waste)) Business SIC classification: CONCRETE WORK Organizations: NON REGULATED (CONTACT/OWNER)
, COLLEGE POINT ASPHALT LLC (LEGALLY RESPONSIBLE PARTY)
, MOUNT HOPE ROCK PRODUCTS INC (LEGALLY RESPONSIBLE PARTY)
, MT HOPE ASPHALT CORP (LEGALLY RESPONSIBLE PARTY)
Alternative names: MounT HOPE ROCK PRODUCTS, QUEEN COUNTY ASPHALT
HOSPITAL MEDICAL CENTER QUEENS FAMILY HEALTH (35-11 FARRINGTON STREET in FLUSHING, NY)
(Integrated Compliance Information System) - ICIS-02-2005-0807, ENFORCEMENT/COMPLIANCE ACTIVITY FORMAL ENFORCEMENT ACTION (Integrated Compliance Information System) - ICIS-02-2005-0807, ENFORCEMENT/COMPLIANCE ACTIVITY
ARRO CLEANERS (147-18 NORTHERN BOULEVARD in FLUSHING, NY)
AIR MINOR (AIRS/AFS) STATE MASTER (New York facility tracking) - AIR PROGRAM, HAZARDOUS WASTE PROGRAM (Resource Conservation and Recovery Act (tracking hazardous waste)) Business SIC classification: DRYCLEANING PLANTS, EXCEPT RUG CLEANING Business NAICS classification: DRYCLEANING AND LAUNDRY SERVICES (EXCEPT COIN-OPERATED).
GREAT SCOTT CLEANERS (156-50 NORTHERN BOULEVARD in FLUSHING, NY)
AIR MINOR (AIRS/AFS) (Integrated Compliance Information System) - ICIS-02-1999-1012, FORMAL ENFORCEMENT ACTION Small Quantity Generators, between 100 kg and 1000 kg of hazardous waste/month (Resource Conservation and Recovery Act (tracking hazardous waste)) - notification Business SIC classification: DRYCLEANING PLANTS, EXCEPT RUG CLEANING Organizations: JEMAX CLEANERS INC (CONTACT/OWNER)
HUTTER AUTO BODY-133-53 37 AVE (133-53 37TH AVE in FLUSHING, NY)
STATE MASTER (New York facility tracking) - AIR PROGRAM, (Resource Conservation and Recovery Act (tracking hazardous waste)) Organizations: OWNERNAME (CONTACT/OWNER)
, HUTTER AUTO BODY INC (LEGALLY RESPONSIBLE PARTY)
Alternative names: HUTTER AUTO BODY INC
BEST CONCRETE MIX CORPORATION (35-10 COLLEGE POINT BOULEVARD in FLUSHING, NY)
National Pollutant Discharge Elimination System NON-MAJOR (Tracking pollutant discharge elimination systems) - permit National Pollutant Discharge Elimination System NON-MAJOR (Tracking pollutant discharge elimination systems) - permit - ICIS-, ENFORCEMENT/COMPLIANCE ACTIVITY,
GOLDEN OLDIES (132-30 33RD AVE in FLUSHING, NY)
AIR SYNTHETIC MINOR (AIRS/AFS) STATE MASTER (New York facility tracking) - AIR PROGRAM, Business SIC classification: HOUSEFURNISHINGS, EXCEPT CURTAINS AND DRAPERIES; WOOD PRODUCTS; HOUSEHOLD FURNITURE Organizations: GOLDEN OLDIES LTD (LEGALLY RESPONSIBLE PARTY)
5 STARS PRINTING CO (133-30 32ND AVENUE in FLUSHING, NY)
AIR SYNTHETIC MINOR (AIRS/AFS) STATE MASTER (New York facility tracking) - AIR PROGRAM Business SIC classification: COMMERCIAL PRINTING; PRINTING TRADES MACHINERY AND EQUIPMENT Organizations: 5 STARS PRINTING CORP (LEGALLY RESPONSIBLE PARTY)
COFIRE PAVING CORPORATION (120-30 28TH AVENUE in FLUSHING, NY)
AIR MINOR (AIRS/AFS) (Resource Conservation and Recovery Act (tracking hazardous waste)) Business SIC classification: HIGHWAY AND STREET CONSTRUCTION, EXCEPT ELEVATED HIGHWAYS Organizations: NON REGULATED (CONTACT/OWNER)
CON EDISON NEW YORK (124-15 31ST STREET in FLUSHING, NY)
HAZARDOUS WASTE BIENNIAL REPORTER (Resource Conservation and Recovery Act (tracking hazardous waste)) Large Quantity Generators, more that 1000 kg of hazardous waste/month (Resource Conservation and Recovery Act (tracking hazardous waste)) - notification Business NAICS classification: ELECTRIC POWER DISTRIBUTION. Organizations: CONSOLIDATED EDISON COMPANY OF NY, INC. (CONTACT/OPERATOR)
Alternative names: CONSOLIDATED EDISON QUEENS CENTRAL SERVICE CENTER
CONTINENTAL FRENCH CLEANERS (144-75 NORTHERN BOULEVARD in FLUSHING, NY)
AIR MINOR (AIRS/AFS) (Resource Conservation and Recovery Act (tracking hazardous waste)) Business SIC classification: DRYCLEANING PLANTS, EXCEPT RUG CLEANING Alternative names: ANCA CLEANERS INC
CON EDISON - GM 11354 (33RD AVE AND 149TH PL. in FLUSHING, NY)
Large Quantity Generators, more that 1000 kg of hazardous waste/month (Resource Conservation and Recovery Act (tracking hazardous waste)) Organizations: CONSOLIDATED EDISON COMPANY OF NY, INC. (CONTACT/OPERATOR)
COMMODITIES ASSISTANE CORP (40TH RD in FLUSHING, NY)
Large Quantity Generators, more that 1000 kg of hazardous waste/month (Resource Conservation and Recovery Act (tracking hazardous waste)) Organizations: JULIUS GROSSFELD (CONTACT/OPERATOR)
, COMMODITIES ASSISTANCE CORP (CONTACT/OWNER)
Alternative names: COMMODITIES ASSISTANCE CORP
Housing units lacking complete plumbing facilities: 0.2% Housing units lacking complete kitchen facilities: 0.8%
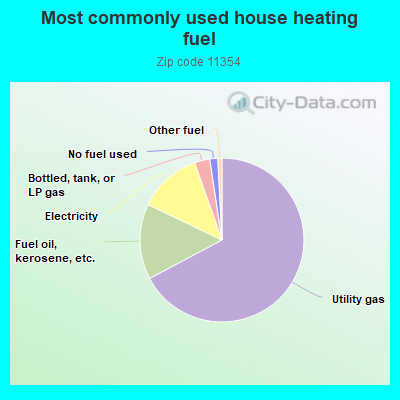
67.3%Utility gas
14.9%Fuel oil, kerosene, etc.
12.5%Electricity
3.0%Bottled, tank, or LP gas
1.6%No fuel used
0.8%Other fuel
Population in 1990: 51,947. Population change in the 1990s: +2,382 (+4.6%).
Place of birth for U.S.-born residents:
This state: 15,472
Northeast: 328
Midwest: 282
South: 360
West: 112
67% of the 11354 zip code residents lived in the same house 5 years ago. Out of people who lived in different houses, 76% lived in this county. Out of people who lived in different counties, 50% lived in New York.
92% of the 11354 zip code residents lived in the same house 1 year ago. Out of people who lived in different houses, 68% moved from this county. Out of people who lived in different houses, 16% moved from different county within same state. Out of people who lived in different houses, 4% moved from different state. Out of people who lived in different houses, 10% moved from abroad.
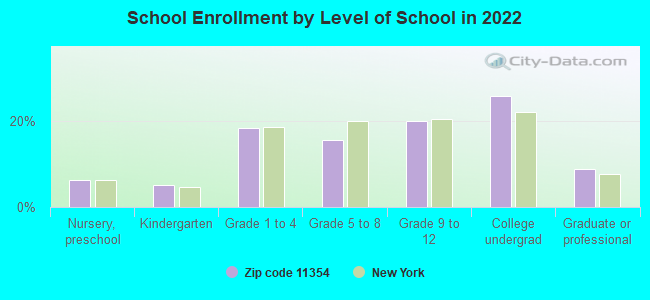
Private vs. public school enrollment:
Students in private schools in grades 1 to 8 (elementary and middle school): 185
Here:
6.5%
New York:
15.6%
Students in private schools in grades 9 to 12 (high school): 84
Here:
5.0%
New York:
15.0%
Students in private undergraduate colleges: 551
Here:
25.5%
New York:
39.2%
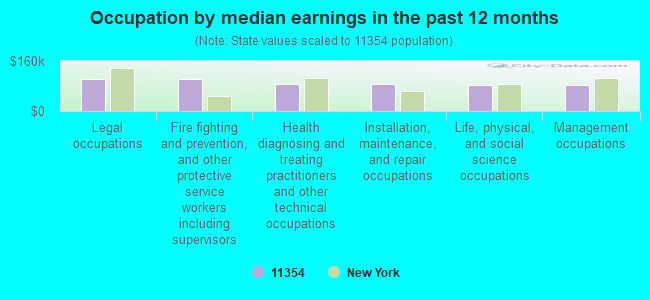
Occupation by median earnings in the past 12 months ($)
103,881Legal occupations
103,093Fire fighting and prevention, and other protective service workers including supervisors
87,377Health diagnosing and treating practitioners and other technical occupations
85,105Installation, maintenance, and repair occupations
83,015Life, physical, and social science occupations
82,766Management occupations
Companies with federal contracts located in this zip code:
SALLY ANN MAKSIMOWICZ (33 21 150 ST in FLUSHING, NY; small business) : $183,568 in 11 contractsfrom 2000 to 2005
Contracts for Personal Services Contracts, Other Administrative Support Services, Chaplain Services by Army Signed by year:2000: $42,662; 2001: $25,061; 2002: $4,000; 2003: $56,600; 2004: $33,800; 2005: $21,445; 2006: $0.
Biggest contracts:
$42,662 with Army for Personal Services Contracts. Signed on 2000-10-31. Completion date: 2002-09-30.
$33,800 with Army for Other Administrative Support Services. Signed on 2004-11-09. Completion date: 2003-09-30.
$32,500, same as above.Signed on 2003-12-04. Completion date: 2003-09-30.
$24,060 with Army for Personal Services Contracts. Signed on 2001-11-13. Completion date: 2002-09-30.
CAMPBELL ENGINEERING SUPPORT S (31-40 COLLEGE POINT BLVD in FLUSHING, NY; small business) : $4,120 in 4 contractsin 2003
$3,625 with U.S. Army Corps of Engineers - civil program financing only for Inspection Services (including commercial testing and lab services, except medical/dental) -- Construction and Building Materials. Signed on 2003-04-14. Completion date: 2003-04-22.
$2,470 with U.S. Army Corps of Engineers - civil program financing only for Inspection Services (including commercial testing and lab services, except medical/dental) -- Construction and Building Materials. Taking place in PA. Signed on 2003-08-26. Completion date: 2003-08-14.
-$950 with U.S. Army Corps of Engineers - civil program financing only for Inspection Services (including commercial testing and lab services, except medical/dental) -- Construction and Building Materials. Signed on 2003-05-22. Completion date: 2003-04-22.
-$1,025 with U.S. Army Corps of Engineers - civil program financing only for Inspection Services (including commercial testing and lab services, except medical/dental) -- Construction and Building Materials. Taking place in PA. Signed on 2003-09-17. Completion date: 2003-08-14.
TRAVERS TOOL CO , INC (128-15 26TH AVE in FLUSHING, NY; small business) : $2,986 in 2 contractsfrom 2004 to 2006
$2,910 with Air Force for Combination and Miscellaneous Instruments. Signed on 2006-06-08. Completion date: 2006-06-16.
$76 with Navy for Hand Tools, Nonedged, Nonpowered. Signed on 2004-07-16. Completion date: 2004-07-30.
Top industries in this zip code by the number of employees in 2005:
Health Care and Social Assistance: Nursing Care Facilities (250-499 employees: 4 establishments, 100-249 employees: 4 establishments, 1-4 employees: 1 establishment)
2007 - 2018 National Fire Incident Reporting System (NFIRS) incidents
According to the data from the years 2007 - 2018 the average number of fires per year is 209. The highest number of reported fires - 262 took place in 2008, and the least - 150 in 2007. The data has an increasing trend.
When looking into fire subcategories, the most reports belonged to: Structure Fires (58.7%), and Outside Fires (31.4%).
Fire incident types reported to NFIRS in Zip Code 11354


 Nearest zip codes: 11351, 11355, 11356, 11357, 11368, 11358.


 (Students: 2,758, Location: 35-01 UNION ST, Grades: 9-12)

 According to the data from the years 2007 - 2018 the average number of fires per year is 209. The highest number of reported fires - 262 took place in 2008, and the least - 150 in 2007. The data has an increasing trend.
 When looking into fire subcategories, the most reports belonged to: Structure Fires (58.7%), and Outside Fires (31.4%).