Estimated zip code population in 2022: 78,233 Zip code population in 2010: 85,871 Zip code population in 2000: 83,281
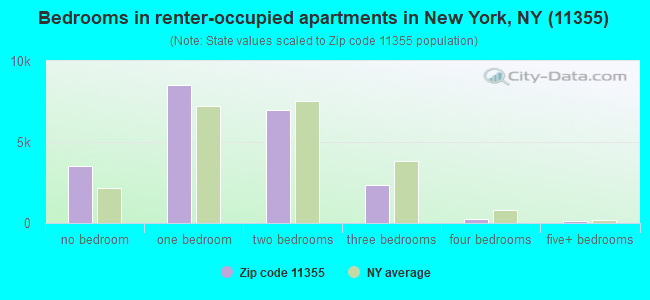
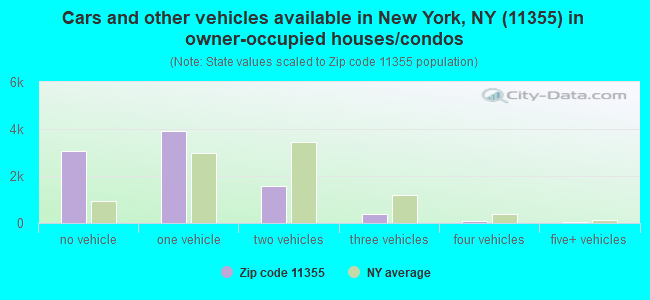
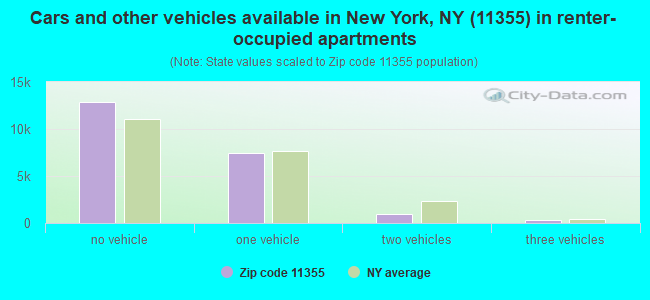
Houses and condos: 31,741 Renter-occupied apartments: 21,584
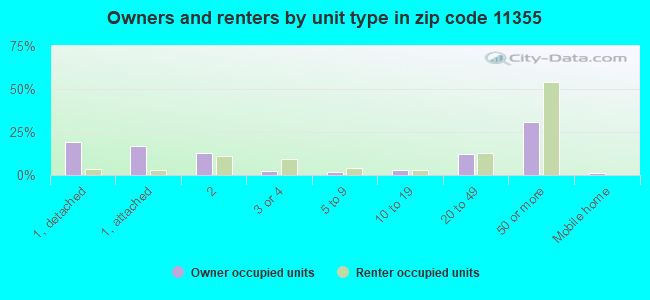
% of renters here:
71%
State:
46%
March 2022 cost of living index in zip code 11355: 158.9 (very high, U.S. average is 100)
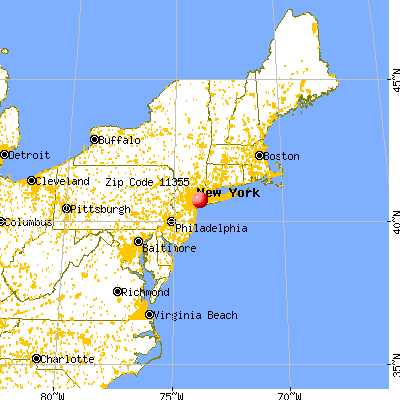
Land area: 1.7 sq. mi. Water area: 0.0 sq. mi.
Population density: 44,991 people per square mile
(very high).
OSM Map
General Map
Google Map
MSN Map
OSM Map
General Map
Google Map
MSN Map
OSM Map
General Map
Google Map
MSN Map
OSM Map
General Map
Google Map
MSN Map
Please wait while loading the map...
Real estate property taxes paid for housing units in 2022:
This zip code:
0.8% ($5,715)
New York:
1.5% ($6,180)
Median real estate property taxes paid for housing units with mortgages in 2022: $6,025 (0.7%) Median real estate property taxes paid for housing units with no mortgage in 2022: $5,563 (0.9%)
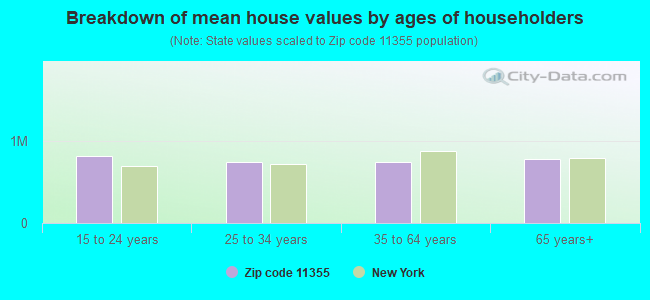
Estimated median house/condo value in 2022: $749,095
11355:
$749,095
New York:
$400,400
According to our research of New York and other state lists, there were 12 registered sex offenders living in 11355 zip code as of April 27, 2024. The ratio of all residents to sex offenders in zip code 11355 is 6,934 to 1. The ratio of registered sex offenders to all residents in this zip code is much lower than the state average.
Median resident age:
This zip code:
47.0 years
New York median age:
40.0 years
Average household size:
This zip code:
2.6 people
New York:
2.5 people
Averages for the 2020 tax year for zip code 11355, filed in 2021:
Average Adjusted Gross Income (AGI) in 2020: $30,662 (Individual Income Tax Returns)
Here:
$30,662
State:
$90,930
Salary/wage: $29,482 (reported on 67.1% of returns)
Here:
$29,482
State:
$72,104
(% of AGI for various income ranges: 931.7% for AGIs below $25k, 3111.1% for AGIs $25k-50k, 7120.0% for AGIs $50k-75k, 11178.9% for AGIs $75k-100k, 19337.6% for AGIs $100k-200k, 65396.4% for AGIs over 200k)
Taxable interest for individuals: $1,351 (reported on 17.8% of returns)
This zip code:
$1,351
New York:
$3,075
(% of AGI for various income ranges: 13.5% for AGIs below $25k, 23.0% for AGIs $25k-50k, 70.0% for AGIs $50k-75k, 136.9% for AGIs $75k-100k, 275.1% for AGIs $100k-200k, 1402.1% for AGIs over 200k)
Ordinary dividends: $3,232 (reported on 10.0% of returns)
Here:
$3,232
State:
$11,095
(% of AGI for various income ranges: 8.6% for AGIs below $25k, 25.2% for AGIs $25k-50k, 86.6% for AGIs $50k-75k, 192.2% for AGIs $75k-100k, 470.7% for AGIs $100k-200k, 2938.6% for AGIs over 200k)
Net capital gain/loss in AGI: +$9,385 (reported on 11.4% of returns)
Here:
+$9,385
State:
+$44,925
(% of AGI for various income ranges: 5.7% for AGIs below $25k, 47.3% for AGIs $25k-50k, 174.3% for AGIs $50k-75k, 379.7% for AGIs $75k-100k, 1248.8% for AGIs $100k-200k, 22254.3% for AGIs over 200k)
Profit/loss from business: +$5,986 (reported on 30.8% of returns)
Here:
+$5,986
State:
+$14,940
(% of AGI for various income ranges: 325.9% for AGIs below $25k, 263.8% for AGIs $25k-50k, 204.2% for AGIs $50k-75k, 191.4% for AGIs $75k-100k, 338.3% for AGIs $100k-200k, 1539.3% for AGIs over 200k)
Taxable individual retirement arrangement distribution: $13,985 (reported on 2.6% of returns)
11355:
$13,985
New York:
$19,609
(% of AGI for various income ranges: 14.8% for AGIs below $25k, 32.1% for AGIs $25k-50k, 92.9% for AGIs $50k-75k, 174.2% for AGIs $75k-100k, 585.6% for AGIs $100k-200k, 2109.3% for AGIs over 200k)
Self-employed (Keogh) retirement plans: $10,867 (reported on 0.1% of returns)
11355:
$10,867
New York:
$32,497
(% of AGI for various income ranges: 3.8% for AGIs $25k-50k)
Total itemized deductions: $27,110 (reported on 2.2% of returns)
Here:
$27,110
State:
$39,326
(% of AGI for various income ranges: 19.8% for AGIs below $25k, 60.3% for AGIs $25k-50k, 160.9% for AGIs $50k-75k, 363.1% for AGIs $75k-100k, 805.4% for AGIs $100k-200k, 4147.1% for AGIs over 200k)
Charity contributions: $7,764 (reported on 1.3% of returns)
Here:
$7,764
State:
$15,420
(% of AGI for various income ranges: 0.7% for AGIs below $25k, 4.3% for AGIs $25k-50k, 22.2% for AGIs $50k-75k, 72.3% for AGIs $75k-100k, 176.9% for AGIs $100k-200k, 1267.9% for AGIs over 200k)
Taxes paid: $8,152 (reported on 2.2% of returns)
11355:
$8,152
State:
$9,183
(% of AGI for various income ranges: 4.9% for AGIs below $25k, 16.4% for AGIs $25k-50k, 53.4% for AGIs $50k-75k, 133.8% for AGIs $75k-100k, 268.4% for AGIs $100k-200k, 932.1% for AGIs over 200k)
Earned income credit: $1,471 (reported on 35.3% of returns)
Here:
$1,471
State:
$2,138
(% of AGI for various income ranges: 92.5% for AGIs below $25k, 117.2% for AGIs $25k-50k, 1.6% for AGIs $50k-75k)
Percentage of individuals using paid preparers for their 2020 taxes: 92.2%
Here:
92%
State:
95%
(% for various income ranges: 90.6% for AGIs below $25k, 95.3% for AGIs $25k-50k, 95.7% for AGIs $50k-75k, 93.7% for AGIs $75k-100k, 93.9% for AGIs $100k-200k, 94.0% for AGIs over 200k)
Averages for the 2012 tax year for zip code 11355, filed in 2013:
Average Adjusted Gross Income (AGI) in 2012: $27,342 (Individual Income Tax Returns)
Here:
$27,342
State:
$77,088
Salary/wage: $29,963 (reported on 69.9% of returns)
Here:
$29,963
State:
$60,593
(% of AGI for various income ranges: 64.4% for AGIs below $25k, 85.1% for AGIs $25k-50k, 85.1% for AGIs $50k-75k, 84.2% for AGIs $75k-100k, 79.5% for AGIs $100k-200k, 55.7% for AGIs over 200k)
Taxable interest for individuals: $970 (reported on 22.6% of returns)
This zip code:
$970
New York:
$3,125
(% of AGI for various income ranges: 0.6% for AGIs below $25k, 0.6% for AGIs $25k-50k, 0.7% for AGIs $50k-75k, 0.9% for AGIs $75k-100k, 1.0% for AGIs $100k-200k, 1.7% for AGIs over 200k)
Ordinary dividends: $2,872 (reported on 9.6% of returns)
Here:
$2,872
State:
$10,299
(% of AGI for various income ranges: 0.6% for AGIs below $25k, 0.7% for AGIs $25k-50k, 0.9% for AGIs $50k-75k, 1.3% for AGIs $75k-100k, 1.7% for AGIs $100k-200k, 2.0% for AGIs over 200k)
Net capital gain/loss in AGI: +$4,056 (reported on 8.6% of returns)
Here:
+$4,056
State:
+$42,474
(% of AGI for various income ranges: 0.3% for AGIs $50k-75k, 0.4% for AGIs $75k-100k, 1.3% for AGIs $100k-200k, 16.2% for AGIs over 200k)
Profit/loss from business: +$8,368 (reported on 33.2% of returns)
Here:
+$8,368
State:
+$16,168
(% of AGI for various income ranges: 29.7% for AGIs below $25k, 5.9% for AGIs $25k-50k, 2.2% for AGIs $50k-75k, 1.4% for AGIs $75k-100k, 2.0% for AGIs $100k-200k, 3.1% for AGIs over 200k)
Taxable individual retirement arrangement distribution: $11,225 (reported on 3.4% of returns)
11355:
$11,225
New York:
$17,621
(% of AGI for various income ranges: 1.0% for AGIs below $25k, 1.0% for AGIs $25k-50k, 1.6% for AGIs $50k-75k, 1.5% for AGIs $75k-100k, 1.9% for AGIs $100k-200k, 2.1% for AGIs over 200k)
Self-employment retirement plans: $15,240 (reported on 0.1% of returns)
11355:
$15,240
New York:
$27,330
Total itemized deductions: $19,324 (24% of AGI, reported on 14.0% of returns)
Here:
$19,324
State:
$34,985
Here:
24.2% of AGI
State:
21.3% of AGI
(% of AGI for various income ranges: 3.0% for AGIs below $25k, 8.2% for AGIs $25k-50k, 11.6% for AGIs $50k-75k, 14.0% for AGIs $75k-100k, 16.1% for AGIs $100k-200k, 14.7% for AGIs over 200k)
Charity contributions: $2,714 (reported on 10.3% of returns)
Here:
$2,714
State:
$5,572
(% of AGI for various income ranges: 0.2% for AGIs below $25k, 0.8% for AGIs $25k-50k, 1.3% for AGIs $50k-75k, 1.5% for AGIs $75k-100k, 1.9% for AGIs $100k-200k, 1.5% for AGIs over 200k)
Taxes paid: $8,905 (reported on 13.9% of returns)
11355:
$8,905
State:
$18,656
(% of AGI for various income ranges: 0.8% for AGIs below $25k, 2.6% for AGIs $25k-50k, 4.7% for AGIs $50k-75k, 7.0% for AGIs $75k-100k, 9.0% for AGIs $100k-200k, 9.4% for AGIs over 200k)
Earned income credit: $1,693 (reported on 44.6% of returns)
Here:
$1,693
State:
$2,230
(% of AGI for various income ranges: 9.1% for AGIs below $25k, 1.6% for AGIs $25k-50k)
Percentage of individuals using paid preparers for their 2012 taxes: 75.9%
Here:
76%
State:
66%
(% for various income ranges: 77.1% for AGIs below $25k, 76.5% for AGIs $25k-50k, 71.0% for AGIs $50k-75k, 69.9% for AGIs $75k-100k, 67.9% for AGIs $100k-200k, 72.0% for AGIs over 200k)
Averages for the 2004 tax year for zip code 11355, filed in 2005:
Average Adjusted Gross Income (AGI) in 2004: $28,408 (Individual Income Tax Returns)
Here:
$28,408
State:
$59,519
Salary/wage: $31,335 (reported on 72.5% of returns)
Here:
$31,335
State:
$50,673
(% of AGI for various income ranges: 62.6% for AGIs below $10k, 70.3% for AGIs $10k-25k, 89.1% for AGIs $25k-50k, 88.3% for AGIs $50k-75k, 85.9% for AGIs $75k-100k, 67.9% for AGIs over 100k)
Taxable interest for individuals: $986 (reported on 45.3% of returns)
This zip code:
$986
New York:
$2,377
(% of AGI for various income ranges: 3.5% for AGIs below $10k, 2.0% for AGIs $10k-25k, 1.2% for AGIs $25k-50k, 1.3% for AGIs $50k-75k, 1.4% for AGIs $75k-100k, 1.6% for AGIs over 100k)
Taxable dividends: $1,982 (reported on 15.2% of returns)
Here:
$1,982
State:
$5,394
(% of AGI for various income ranges: 1.4% for AGIs below $10k, 0.9% for AGIs $10k-25k, 0.7% for AGIs $25k-50k, 0.9% for AGIs $50k-75k, 1.1% for AGIs $75k-100k, 1.7% for AGIs over 100k)
Net capital gain/loss: +$3,592 (reported on 13.1% of returns)
Here:
+$3,592
State:
+$23,581
(% of AGI for various income ranges: -1.2% for AGIs below $10k, -0.3% for AGIs $10k-25k, -0.1% for AGIs $25k-50k, 0.2% for AGIs $50k-75k, 0.8% for AGIs $75k-100k, 8.3% for AGIs over 100k)
Profit/loss from business: +$7,401 (reported on 29.7% of returns)
Here:
+$7,401
State:
+$13,809
(% of AGI for various income ranges: 42.8% for AGIs below $10k, 20.1% for AGIs $10k-25k, 3.9% for AGIs $25k-50k, 1.6% for AGIs $50k-75k, 1.4% for AGIs $75k-100k, 3.7% for AGIs over 100k)
IRA payment deduction: $3,648 (reported on 3.8% of returns)
11355:
$3,648
New York:
$3,115
(% of AGI for various income ranges: 0.3% for AGIs below $10k, 0.5% for AGIs $10k-25k, 0.8% for AGIs $25k-50k, 0.5% for AGIs $50k-75k, 0.4% for AGIs $75k-100k, 0.2% for AGIs over 100k)
Self-employed pension: $14,693 (reported on 0.2% of returns)
Here:
$14,693
New York:
$19,016
(% of AGI for various income ranges: 0.0% for AGIs $25k-50k, 0.1% for AGIs $50k-75k, 0.1% for AGIs $75k-100k, 0.4% for AGIs over 100k)
Total itemized deductions: $16,834 (26% of AGI, reported on 22.1% of returns)
Here:
$16,834
State:
$25,864
Here:
25.9% of AGI
State:
21.9% of AGI
(% of AGI for various income ranges: 3.3% for AGIs below $10k, 7.1% for AGIs $10k-25k, 12.6% for AGIs $25k-50k, 15.3% for AGIs $50k-75k, 16.8% for AGIs $75k-100k, 16.7% for AGIs over 100k)
Charity contributions deductions: $2,646 (4% of AGI, reported on 19.3% of returns)
Here:
$2,646
State:
$4,439
Here:
3.9% of AGI
State:
3.6% of AGI
(% of AGI for various income ranges: 0.2% for AGIs below $10k, 0.7% for AGIs $10k-25k, 1.8% for AGIs $25k-50k, 2.2% for AGIs $50k-75k, 2.4% for AGIs $75k-100k, 2.3% for AGIs over 100k)
Total tax: $3,816 (reported on 72.0% of returns)
11355:
$3,816
State:
$11,730
(% of AGI for various income ranges: 7.4% for AGIs below $10k, 5.1% for AGIs $10k-25k, 6.5% for AGIs $25k-50k, 9.7% for AGIs $50k-75k, 11.3% for AGIs $75k-100k, 17.3% for AGIs over 100k)
Earned income credit: $1,522 (reported on 31.4% of returns)
Here:
$1,522
State:
$1,757
Percentage of individuals using paid preparers for their 2004 taxes: 71.0%
Here:
71%
State:
67%
(% for various income ranges: 70.8% for AGIs below $10k, 74.5% for AGIs $10k-25k, 69.1% for AGIs $25k-50k, 66.4% for AGIs $50k-75k, 69.2% for AGIs $75k-100k, 69.5% for AGIs over 100k)
Likely homosexual households (counted as self-reported same-sex unmarried-partner households)
Lesbian couples: 0.0% of all households
Gay men: 0.0% of all households
Household received Food Stamps/SNAP in the past 12 months: 5,469 Household did not receive Food Stamps/SNAP in the past 12 months: 24,945
Women who had a birth in the past 12 months: 732 (587 now married, 140 unmarried) Women who did not have a birth in the past 12 months: 15,761 (7,739 now married, 7,924 unmarried)
Housing units in zip code 11355 with a mortgage: 3,077 (183 second mortgage, 109 both second mortgage and home equity loan) Houses without a mortgage: 153
Median monthly owner costs for units with a mortgage: $2,551 Median monthly owner costs for units without a mortgage: $959
Residents with income below the poverty level in 2022:
This zip code:
21.3%
Whole state:
14.3%
Residents with income below 50% of the poverty level in 2022:
This zip code:
11.5%
Whole state:
6.8%
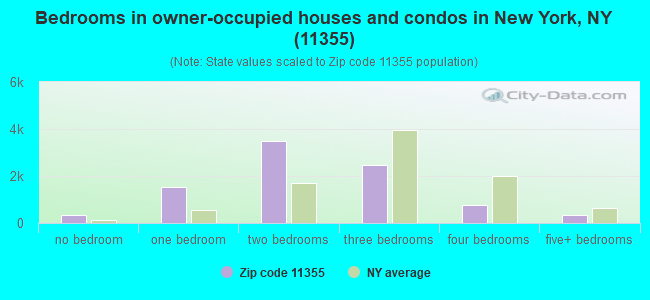
Median number of rooms in houses and condos:
Here:
4.5
State:
6.3
Median number of rooms in apartments:
Here:
3.3
State:
3.8
Notable locations in this zip code not listed on our city pages
Notable locations in zip code 11355: Flushing Branch Queens Borough Public Library (A), Queensboro Hill Branch Queens Borough Public Library (B), Fire Department New York Engine 274 Battalion 52 (C). Display/hide their locations on the map
Churches in zip code 11355 include: Church of the Nazarene (A), Church of Jesus Christ of Latter Day Saints (B), Church of Christ (C), Christian Believers Meeting (D), Choongsyn Korean Church (E), Chinese For Christ New York Church (F), Boon Church of Oversea Chinese (G), Amitabha Buddhist Society (H), Saint Ann's Church (I). Display/hide their locations on the map
Parks in zip code 11355 include: Queens Botanical Gardens (1), Murray Hill Playground (2), Maple Playground (3), Bowne Playground (4), Lawrence Triangle (5), Kissena Corridor (6). Display/hide their locations on the map
8,621 married couples with children.
1,637 single-parent households (570 men, 1,067 women).
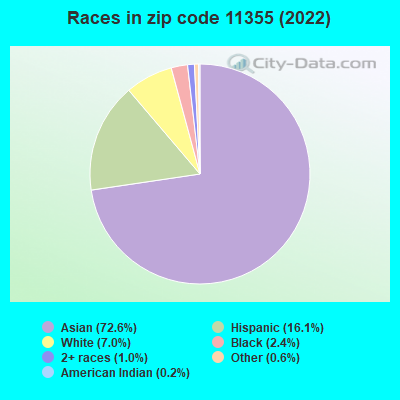
15.1% of residents of 11355 zip code speak English at home.
14.1% of residents speak Spanish at home (29% very well, 42% well, 23% not well, 5% not at all).
7.9% of residents speak other Indo-European language at home (37% very well, 39% well, 20% not well, 3% not at all).
64.7% of residents speak Asian or Pacific Island language at home (17% very well, 26% well, 38% not well, 18% not at all).
0.5% of residents speak other language at home (65% very well, 8% well, 27% not well).
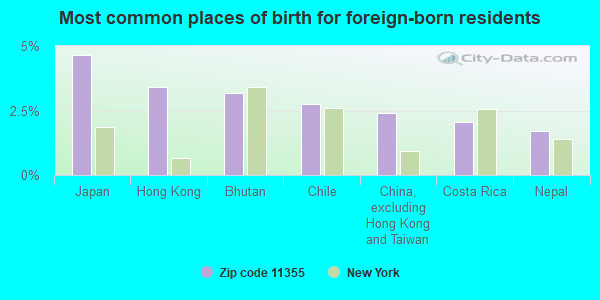
Foreign born population: 55,332 (70.7%) (46.9% of them are naturalized citizens)
This zip code:
70.7%
Whole state:
22.7%
4%Japan
4%Bhutan
4%Hong Kong
2%Colombia
2%Chile
2%China, excluding Hong Kong and Taiwan
2%Costa Rica
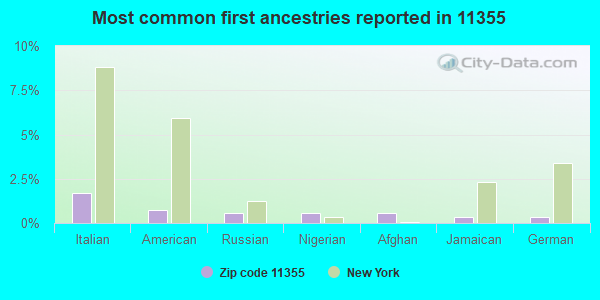
2%Italian
1%American
1%Russian
1%Nigerian
1%Afghan
0%Jamaican
0%German
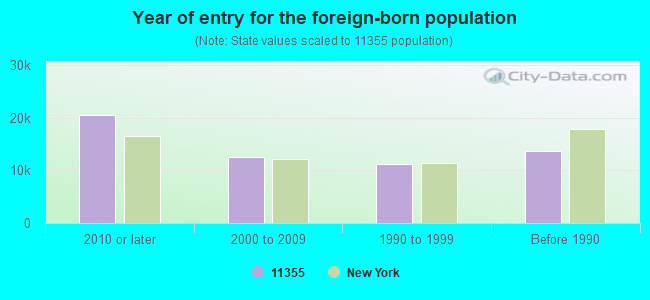
Year of entry for the foreign-born population
20,4792010 or later
12,4252000 to 2009
11,1791990 to 1999
13,622Before 1990
Public high schools in in zip code 11355 not listed on the city page:
Major facilities with environmental interests located in this zip code:
144-80 BARCLAY AVENUE SCHOOL - P-189 (144-80 BARCLAY AVENUE in FLUSHING, NY)
STATE MASTER (New York facility tracking) - AIR PROGRAM (Integrated Compliance Information System) - ICIS-02-1994-0052, FORMAL ENFORCEMENT ACTION Business SIC classification: WRECKING AND DEMOLITION WORK; ELEMENTARY AND SECONDARY SCHOOLS Business NAICS classification: ELEMENTARY AND SECONDARY SCHOOLS. Organizations: NYC DEPT OF EDUCATION (LEGALLY RESPONSIBLE PARTY)
Alternative names: NYC BD OF ED - JUNIOR HIGH SCHOOL 189
HOSPITAL MEDICAL CENTER QUEENS EMPLOYEE HEALTH (139-09 58 AVENUE in FLUSHING, NY)
(Integrated Compliance Information System) - ICIS-02-2005-0807, ENFORCEMENT/COMPLIANCE ACTIVITY FORMAL ENFORCEMENT ACTION (Integrated Compliance Information System) - ICIS-02-2005-0807, ENFORCEMENT/COMPLIANCE ACTIVITY
144-45 41ST AVE BUILDING (144-45 41ST AVE in FLUSHING, NY)
AIR MINOR (AIRS/AFS) STATE MASTER (New York facility tracking) - AIR PROGRAM Business SIC classification: OPERATORS OF APARTMENT BUILDINGS Organizations: UNION ST 43 LLC (AIR PERMIT CONTACT)
, 144-45 41ST AVE OWNERS CORP (LEGALLY RESPONSIBLE PARTY)
42-52 UNION ST BUILDING (42-52 UNION STREET in FLUSHING, NY)
AIR MINOR (AIRS/AFS) STATE MASTER (New York facility tracking) - AIR PROGRAM Business SIC classification: OPERATORS OF APARTMENT BUILDINGS; OPERATORS OF DWELLINGS OTHER THAN APARTMENT BUILDINGS Organizations: HEWLETT ASSOCIATES LP (LEGALLY RESPONSIBLE PARTY)
, KALED MANAGEMENT CORP (LEGALLY RESPONSIBLE PARTY)
Alternative names: KALED MANAGMENT CORPORATION
BEST CLEANERS (149-16 41ST AVENUE in FLUSHING, NY)
AIR MINOR (AIRS/AFS) STATE MASTER (New York facility tracking) - AIR PROGRAM Conditionally Exempt Small Quantity Generators, less than 100 kg/month of hazardous waste (Resource Conservation and Recovery Act (tracking hazardous waste)) - notification Business SIC classification: DRYCLEANING PLANTS, EXCEPT RUG CLEANING Business NAICS classification: DRYCLEANING AND LAUNDRY SERVICES (EXCEPT COIN-OPERATED). Organizations: MRS CHONG OK CHUNG (CONTACT/OWNER)
Alternative names: CHUNG CLEANERS, CHUNGS DRY CLEANERS
CHERIE CLEANERS (43-65 KISSENA BLVD in FLUSHING, NY)
AIR MINOR (AIRS/AFS) STATE MASTER (New York facility tracking) - AIR PROGRAM, HAZARDOUS WASTE PROGRAM Conditionally Exempt Small Quantity Generators, less than 100 kg/month of hazardous waste (Resource Conservation and Recovery Act (tracking hazardous waste)) - notification Business SIC classification: DRYCLEANING PLANTS, EXCEPT RUG CLEANING Business NAICS classification: DRYCLEANING AND LAUNDRY SERVICES (EXCEPT COIN-OPERATED). Organizations: LANDLORD (CONTACT/OWNER)
AMERICAN BAKERIES COMPANY (131-33 AVERY AVENUE in FLUSHING, NY)
(Integrated Compliance Information System) - ICIS-02-1992-0259, FORMAL ENFORCEMENT ACTION, ICIS-02-1992-0260, CRITERIA AND HAZARDOUS AIR POLLUTANT INVENTORY (Inventory of air pollution sources) (Resource Conservation and Recovery Act (tracking hazardous waste)) Business SIC classification: GROCERIES AND RELATED PRODUCTS Alternative names: TASTEE BAKING COMPANY
138-15 FRANKLIN AVE BUILDING (138-15 FRANKLIN AVENUE in FLUSHING, NY)
AIR SYNTHETIC MINOR (AIRS/AFS) STATE MASTER (New York facility tracking) - AIR PROGRAM Business SIC classification: OPERATORS OF APARTMENT BUILDINGS Business NAICS classification: LESSORS OF RESIDENTIAL BUILDINGS AND DWELLINGS. Organizations: 138-15 FRANKLIN AVENUE APARTMENT CORP (LEGALLY RESPONSIBLE PARTY)
42-10 COLDEN STREET BUILDING (42-10 COLDEN STREET in FLUSHING, NY)
AIR SYNTHETIC MINOR (AIRS/AFS) STATE MASTER (New York facility tracking) - AIR PROGRAM Business SIC classification: OPERATORS OF APARTMENT BUILDINGS Business NAICS classification: LESSORS OF RESIDENTIAL BUILDINGS AND DWELLINGS. Organizations: KIBEL COMPANIES LLC (LEGALLY RESPONSIBLE PARTY)
IS 237 RACHEL CARSON SCHOOL ( in FLUSHING, NY)
(National Center for Education Statistics) - STATE ID-342500010237 Organizations: NEW YORK CITY PUBLIC SCHOOLS (SCHOOL DISTRICT)
CON ED-M/H 12329 (W/S KISSENA BLVD in FLUSHING, NY)
HAZARDOUS WASTE BIENNIAL REPORTER (Resource Conservation and Recovery Act (tracking hazardous waste)) (Resource Conservation and Recovery Act (tracking hazardous waste)) Alternative names: CON ED - MH 12329
CON EDISON - FARRINGTON ST FLUSH FACILI (31-06 FARRINGTON STREET in FLUSHING, NY)
HAZARDOUS WASTE BIENNIAL REPORTER (Resource Conservation and Recovery Act (tracking hazardous waste)) Large Quantity Generators, more that 1000 kg of hazardous waste/month (Resource Conservation and Recovery Act (tracking hazardous waste)) - notification Business NAICS classification: ELECTRIC POWER DISTRIBUTION. Organizations: CONSOLIDATED EDISON COMPANY OF NY, INC. (CONTACT/OPERATOR)
Alternative names: CON ED FARRINGTON REGULATING STATION, CON EDISON - REGULATING STATION
ARIMA PERFORMANCE SYSTEMS INC (42-31 COLDEN ST in FLUSHING, NY)
Large Quantity Generators, more that 1000 kg of hazardous waste/month (Resource Conservation and Recovery Act (tracking hazardous waste)) - notification
Housing units lacking complete plumbing facilities: 0.4% Housing units lacking complete kitchen facilities: 1.2%
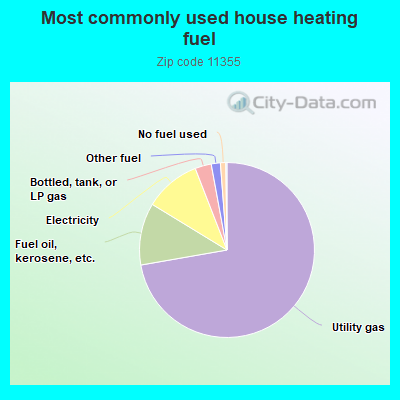
72.4%Utility gas
11.5%Fuel oil, kerosene, etc.
10.4%Electricity
3.0%Bottled, tank, or LP gas
1.7%Other fuel
1.0%No fuel used
Population in 1990: 69,164. Population change in the 1990s: +14,117 (+20.4%).
Place of birth for U.S.-born residents:
This state: 20,534
Northeast: 354
Midwest: 173
South: 338
West: 154
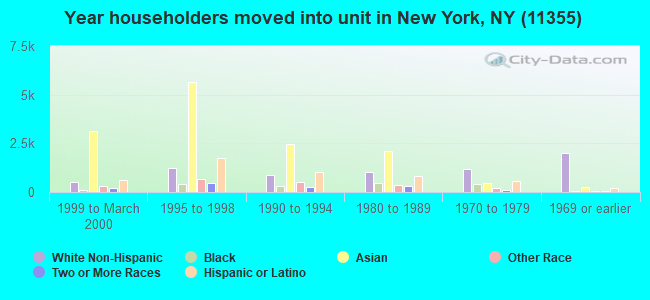
65% of the 11355 zip code residents lived in the same house 5 years ago. Out of people who lived in different houses, 76% lived in this county. Out of people who lived in different counties, 50% lived in New York.
94% of the 11355 zip code residents lived in the same house 1 year ago. Out of people who lived in different houses, 53% moved from this county. Out of people who lived in different houses, 13% moved from different county within same state. Out of people who lived in different houses, 4% moved from different state. Out of people who lived in different houses, 31% moved from abroad.
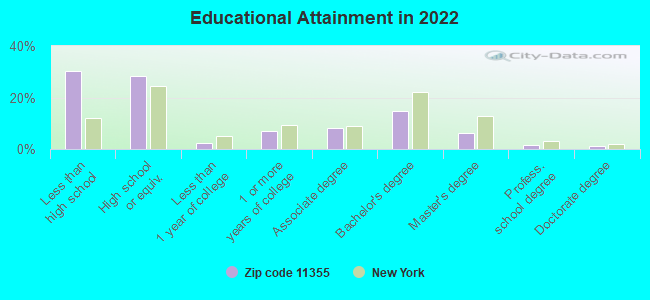
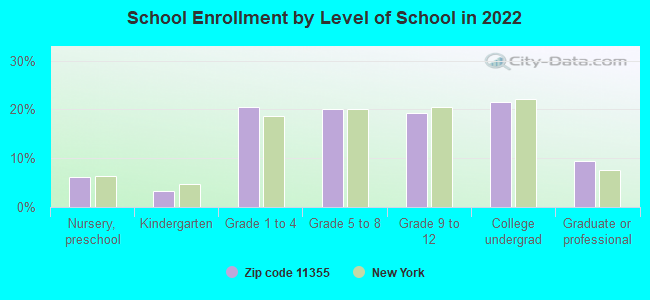
Private vs. public school enrollment:
Students in private schools in grades 1 to 8 (elementary and middle school): 333
Here:
6.1%
New York:
15.6%
Students in private schools in grades 9 to 12 (high school): 113
Here:
4.4%
New York:
15.0%
Students in private undergraduate colleges: 563
Here:
19.5%
New York:
39.2%
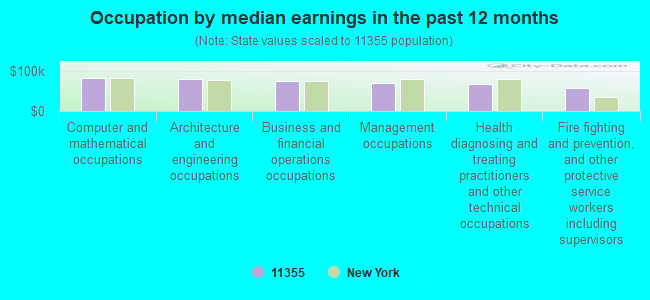
Occupation by median earnings in the past 12 months ($)
81,695Computer and mathematical occupations
78,522Architecture and engineering occupations
72,999Business and financial operations occupations
68,739Management occupations
67,263Health diagnosing and treating practitioners and other technical occupations
55,937Fire fighting and prevention, and other protective service workers including supervisors
Companies with federal contracts located in this zip code:
KEPCO INC (13138 SANFORD AVE in FLUSHING, NY; small business) : $925,023 in 54 contractsfrom 2000 to 2006
Contracts for Converters, Electrical, Nonrotating, Combination and Miscellaneous Instruments, ADP Input/Output and Storage Devices, ADP Support Equipment, and moreby Air Force, Navy, Army, National Oceanic and Atmospheric Administration/Under Secretary for Oceans and Atmosphere, and others Signed by year:2000: $425,985; 2001: $45,000; 2002: $163,636; 2003: $28,129; 2004: $65,346; 2005: $171,070; 2006: $25,857.
Biggest contracts:
$154,678 with Air Force for Converters, Electrical, Nonrotating. Signed on 2000-03-01. Completion date: 2000-06-30.
$121,982, same as above.Signed on 2000-01-14. Completion date: 2000-03-30.
$87,758, same as above.Signed on 2000-02-16. Completion date: 2000-05-31.
$61,567, same as above.Signed on 2000-03-15. Completion date: 2000-12-29.
MONDIAL AUTOMOTIVE INC (41-18 COLLEGE POINT BLVD in FLUSHING, NY; small business)
$22,737 with Army for Miscellaneous Engine Accessories, Nonaircraft. Signed on 2005-08-16. Completion date: 2005-09-09.
Top industries in this zip code by the number of employees in 2005:
Health Care and Social Assistance: General Medical and Surgical Hospitals (over 1000 employees: 2 establishments)
Health Care and Social Assistance: Offices of Physicians (except Mental Health Specialists) (50-99: 1, 20-49: 5, 10-19: 16, 5-9: 37, 1-4: 129)
2007 - 2018 National Fire Incident Reporting System (NFIRS) incidents
According to the data from the years 2007 - 2018 the average number of fire incidents per year is 179. The highest number of reported fires - 211 took place in 2013, and the least - 115 in 2007. The data has an increasing trend.
When looking into fire subcategories, the most reports belonged to: Structure Fires (67.9%), and Outside Fires (24.3%).
Fire incident types reported to NFIRS in Zip Code 11355


 Nearest zip codes: 11354, 11367, 11358, 11365, 11351, 11368.


 (Students: 547, Location: 46-21 COLDEN ST, Grades: 6-12)
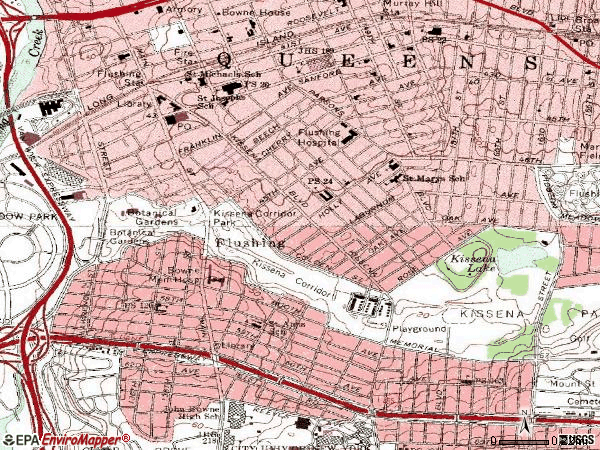
 According to the data from the years 2007 - 2018 the average number of fire incidents per year is 179. The highest number of reported fires - 211 took place in 2013, and the least - 115 in 2007. The data has an increasing trend.
 When looking into fire subcategories, the most reports belonged to: Structure Fires (67.9%), and Outside Fires (24.3%).