Estimated zip code population in 2022: 37,049 Zip code population in 2010: 37,546 Zip code population in 2000: 38,647
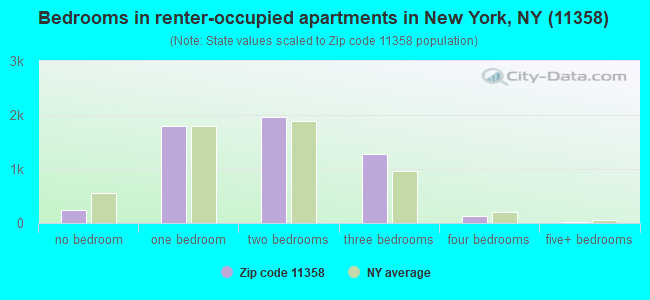
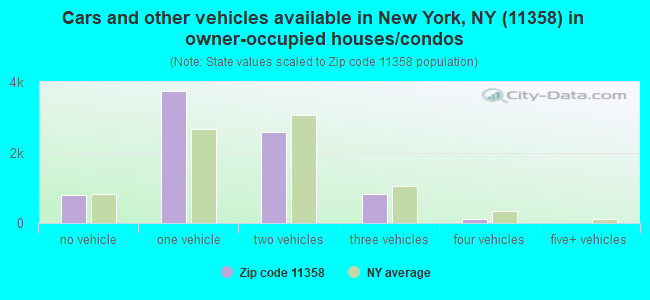
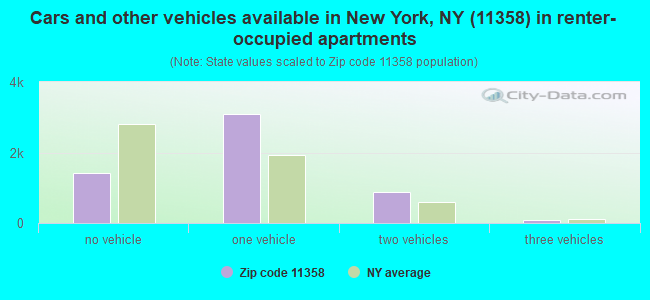
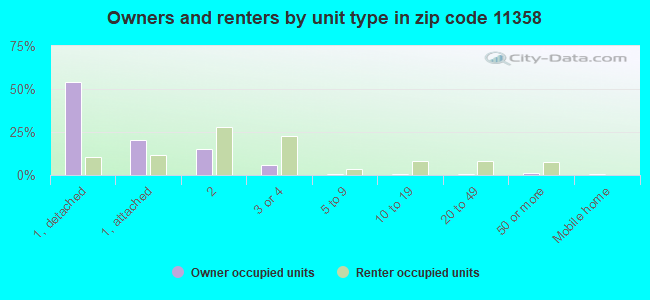
Houses and condos: 13,968 Renter-occupied apartments: 5,468
% of renters here:
41%
State:
46%
March 2022 cost of living index in zip code 11358: 156.0 (very high, U.S. average is 100)
Land area: 1.9 sq. mi. Water area: 0.0 sq. mi.
Population density: 19,005 people per square mile
(very high).
OSM Map
General Map
Google Map
MSN Map
OSM Map
General Map
Google Map
MSN Map
OSM Map
General Map
Google Map
MSN Map
OSM Map
General Map
Google Map
MSN Map
Please wait while loading the map...
Real estate property taxes paid for housing units in 2022:
This zip code:
0.8% ($8,189)
New York:
1.5% ($6,180)
Median real estate property taxes paid for housing units with mortgages in 2022: $8,049 (0.8%) Median real estate property taxes paid for housing units with no mortgage in 2022: $8,307 (0.9%)
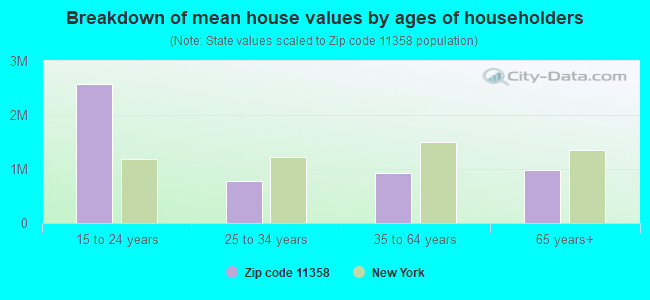
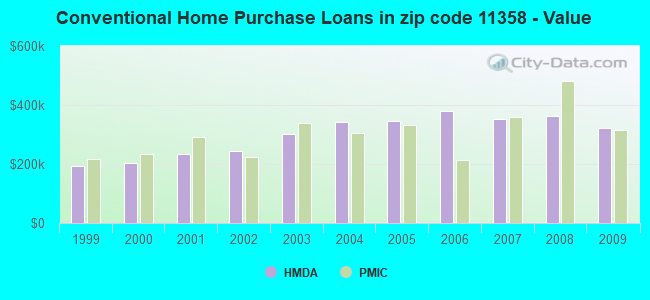
Estimated median house/condo value in 2022: $978,014
11358:
$978,014
New York:
$400,400
According to our research of New York and other state lists, there were 7 registered sex offenders living in 11358 zip code as of April 27, 2024. The ratio of all residents to sex offenders in zip code 11358 is 5,428 to 1. The ratio of registered sex offenders to all residents in this zip code is much lower than the state average.
Median resident age:
This zip code:
44.5 years
New York median age:
40.0 years
Average household size:
This zip code:
2.7 people
New York:
2.5 people
Averages for the 2020 tax year for zip code 11358, filed in 2021:
Average Adjusted Gross Income (AGI) in 2020: $58,097 (Individual Income Tax Returns)
Here:
$58,097
State:
$90,930
Salary/wage: $53,436 (reported on 75.1% of returns)
Here:
$53,436
State:
$72,104
(% of AGI for various income ranges: 1019.7% for AGIs below $25k, 3260.4% for AGIs $25k-50k, 6842.7% for AGIs $50k-75k, 10308.2% for AGIs $75k-100k, 19097.9% for AGIs $100k-200k, 81940.4% for AGIs over 200k)
Taxable interest for individuals: $1,644 (reported on 33.2% of returns)
This zip code:
$1,644
New York:
$3,075
(% of AGI for various income ranges: 25.5% for AGIs below $25k, 33.0% for AGIs $25k-50k, 76.0% for AGIs $50k-75k, 153.9% for AGIs $75k-100k, 251.9% for AGIs $100k-200k, 1145.4% for AGIs over 200k)
Ordinary dividends: $4,614 (reported on 21.8% of returns)
Here:
$4,614
State:
$11,095
(% of AGI for various income ranges: 22.7% for AGIs below $25k, 44.2% for AGIs $25k-50k, 102.5% for AGIs $50k-75k, 193.3% for AGIs $75k-100k, 498.5% for AGIs $100k-200k, 3325.8% for AGIs over 200k)
Net capital gain/loss in AGI: +$12,460 (reported on 21.6% of returns)
Here:
+$12,460
State:
+$44,925
(% of AGI for various income ranges: 15.1% for AGIs below $25k, 45.7% for AGIs $25k-50k, 128.6% for AGIs $50k-75k, 260.5% for AGIs $75k-100k, 757.0% for AGIs $100k-200k, 16200.8% for AGIs over 200k)
Profit/loss from business: +$8,897 (reported on 21.0% of returns)
Here:
+$8,897
State:
+$14,940
(% of AGI for various income ranges: 264.0% for AGIs below $25k, 218.5% for AGIs $25k-50k, 225.7% for AGIs $50k-75k, 224.4% for AGIs $75k-100k, 450.7% for AGIs $100k-200k, 2449.6% for AGIs over 200k)
Taxable individual retirement arrangement distribution: $17,125 (reported on 6.0% of returns)
11358:
$17,125
New York:
$19,609
(% of AGI for various income ranges: 31.8% for AGIs below $25k, 62.7% for AGIs $25k-50k, 108.7% for AGIs $50k-75k, 265.2% for AGIs $75k-100k, 581.5% for AGIs $100k-200k, 2173.3% for AGIs over 200k)
Self-employed (Keogh) retirement plans: $26,250 (reported on 0.4% of returns)
11358:
$26,250
New York:
$32,497
(% of AGI for various income ranges: 5.0% for AGIs $25k-50k, 38.5% for AGIs $100k-200k, 586.7% for AGIs over 200k)
Total itemized deductions: $28,770 (reported on 9.0% of returns)
Here:
$28,770
State:
$39,326
(% of AGI for various income ranges: 74.9% for AGIs below $25k, 179.8% for AGIs $25k-50k, 345.6% for AGIs $50k-75k, 628.3% for AGIs $75k-100k, 1369.8% for AGIs $100k-200k, 5641.7% for AGIs over 200k)
Charity contributions: $5,146 (reported on 6.8% of returns)
Here:
$5,146
State:
$15,420
(% of AGI for various income ranges: 2.6% for AGIs below $25k, 10.6% for AGIs $25k-50k, 35.3% for AGIs $50k-75k, 86.5% for AGIs $75k-100k, 203.2% for AGIs $100k-200k, 1074.2% for AGIs over 200k)
Taxes paid: $9,225 (reported on 9.0% of returns)
11358:
$9,225
State:
$9,183
(% of AGI for various income ranges: 21.1% for AGIs below $25k, 51.2% for AGIs $25k-50k, 116.1% for AGIs $50k-75k, 236.1% for AGIs $75k-100k, 452.2% for AGIs $100k-200k, 1670.0% for AGIs over 200k)
Earned income credit: $1,753 (reported on 19.5% of returns)
Here:
$1,753
State:
$2,138
(% of AGI for various income ranges: 84.4% for AGIs below $25k, 82.1% for AGIs $25k-50k, 1.1% for AGIs $50k-75k)
Percentage of individuals using paid preparers for their 2020 taxes: 94.0%
Here:
94%
State:
95%
(% for various income ranges: 92.3% for AGIs below $25k, 95.8% for AGIs $25k-50k, 96.1% for AGIs $50k-75k, 93.7% for AGIs $75k-100k, 95.0% for AGIs $100k-200k, 93.3% for AGIs over 200k)
Averages for the 2012 tax year for zip code 11358, filed in 2013:
Average Adjusted Gross Income (AGI) in 2012: $54,130 (Individual Income Tax Returns)
Here:
$54,130
State:
$77,088
Salary/wage: $52,468 (reported on 77.1% of returns)
Here:
$52,468
State:
$60,593
(% of AGI for various income ranges: 62.0% for AGIs below $25k, 80.3% for AGIs $25k-50k, 79.7% for AGIs $50k-75k, 78.4% for AGIs $75k-100k, 78.0% for AGIs $100k-200k, 64.0% for AGIs over 200k)
Taxable interest for individuals: $1,208 (reported on 41.7% of returns)
This zip code:
$1,208
New York:
$3,125
(% of AGI for various income ranges: 1.6% for AGIs below $25k, 0.9% for AGIs $25k-50k, 0.9% for AGIs $50k-75k, 0.9% for AGIs $75k-100k, 0.9% for AGIs $100k-200k, 0.8% for AGIs over 200k)
Ordinary dividends: $3,421 (reported on 22.1% of returns)
Here:
$3,421
State:
$10,299
(% of AGI for various income ranges: 1.5% for AGIs below $25k, 1.2% for AGIs $25k-50k, 1.3% for AGIs $50k-75k, 1.4% for AGIs $75k-100k, 1.3% for AGIs $100k-200k, 1.8% for AGIs over 200k)
Net capital gain/loss in AGI: +$4,664 (reported on 17.9% of returns)
Here:
+$4,664
State:
+$42,474
(% of AGI for various income ranges: 0.1% for AGIs $50k-75k, 0.5% for AGIs $75k-100k, 0.9% for AGIs $100k-200k, 7.2% for AGIs over 200k)
Profit/loss from business: +$13,189 (reported on 21.5% of returns)
Here:
+$13,189
State:
+$16,168
(% of AGI for various income ranges: 23.0% for AGIs below $25k, 6.5% for AGIs $25k-50k, 2.6% for AGIs $50k-75k, 2.2% for AGIs $75k-100k, 2.1% for AGIs $100k-200k, 5.5% for AGIs over 200k)
Taxable individual retirement arrangement distribution: $13,275 (reported on 8.4% of returns)
11358:
$13,275
New York:
$17,621
(% of AGI for various income ranges: 2.6% for AGIs below $25k, 1.7% for AGIs $25k-50k, 1.9% for AGIs $50k-75k, 2.2% for AGIs $75k-100k, 2.1% for AGIs $100k-200k, 2.2% for AGIs over 200k)
Self-employment retirement plans: $22,527 (reported on 0.6% of returns)
11358:
$22,527
New York:
$27,330
(% of AGI for various income ranges: 0.2% for AGIs $25k-50k, 0.2% for AGIs $100k-200k, 1.0% for AGIs over 200k)
Total itemized deductions: $24,755 (24% of AGI, reported on 36.4% of returns)
Here:
$24,755
State:
$34,985
Here:
23.9% of AGI
State:
21.3% of AGI
(% of AGI for various income ranges: 9.2% for AGIs below $25k, 12.2% for AGIs $25k-50k, 15.7% for AGIs $50k-75k, 19.1% for AGIs $75k-100k, 19.7% for AGIs $100k-200k, 17.0% for AGIs over 200k)
Charity contributions: $2,687 (reported on 30.4% of returns)
Here:
$2,687
State:
$5,572
(% of AGI for various income ranges: 0.5% for AGIs below $25k, 1.1% for AGIs $25k-50k, 1.7% for AGIs $50k-75k, 1.8% for AGIs $75k-100k, 1.8% for AGIs $100k-200k, 1.4% for AGIs over 200k)
Taxes paid: $12,240 (reported on 36.3% of returns)
11358:
$12,240
State:
$18,656
(% of AGI for various income ranges: 2.6% for AGIs below $25k, 4.0% for AGIs $25k-50k, 6.4% for AGIs $50k-75k, 8.9% for AGIs $75k-100k, 10.5% for AGIs $100k-200k, 11.3% for AGIs over 200k)
Earned income credit: $1,893 (reported on 20.6% of returns)
Here:
$1,893
State:
$2,230
(% of AGI for various income ranges: 6.4% for AGIs below $25k, 1.1% for AGIs $25k-50k)
Percentage of individuals using paid preparers for their 2012 taxes: 75.0%
Here:
75%
State:
66%
(% for various income ranges: 75.4% for AGIs below $25k, 75.0% for AGIs $25k-50k, 72.5% for AGIs $50k-75k, 75.8% for AGIs $75k-100k, 75.9% for AGIs $100k-200k, 74.5% for AGIs over 200k)
Averages for the 2004 tax year for zip code 11358, filed in 2005:
Average Adjusted Gross Income (AGI) in 2004: $48,054 (Individual Income Tax Returns)
Here:
$48,054
State:
$59,519
Salary/wage: $47,149 (reported on 77.3% of returns)
Here:
$47,149
State:
$50,673
(% of AGI for various income ranges: 93.0% for AGIs below $10k, 62.6% for AGIs $10k-25k, 81.4% for AGIs $25k-50k, 81.5% for AGIs $50k-75k, 80.7% for AGIs $75k-100k, 70.8% for AGIs over 100k)
Taxable interest for individuals: $1,530 (reported on 59.6% of returns)
This zip code:
$1,530
New York:
$2,377
(% of AGI for various income ranges: 8.4% for AGIs below $10k, 3.5% for AGIs $10k-25k, 2.0% for AGIs $25k-50k, 1.9% for AGIs $50k-75k, 1.6% for AGIs $75k-100k, 1.4% for AGIs over 100k)
Taxable dividends: $2,600 (reported on 29.4% of returns)
Here:
$2,600
State:
$5,394
(% of AGI for various income ranges: 5.9% for AGIs below $10k, 1.7% for AGIs $10k-25k, 1.1% for AGIs $25k-50k, 1.5% for AGIs $50k-75k, 1.1% for AGIs $75k-100k, 1.9% for AGIs over 100k)
Net capital gain/loss: +$6,335 (reported on 24.1% of returns)
Here:
+$6,335
State:
+$23,581
(% of AGI for various income ranges: -4.3% for AGIs below $10k, -0.5% for AGIs $10k-25k, -0.4% for AGIs $25k-50k, 0.2% for AGIs $50k-75k, 0.9% for AGIs $75k-100k, 8.0% for AGIs over 100k)
Profit/loss from business: +$12,229 (reported on 20.4% of returns)
Here:
+$12,229
State:
+$13,809
(% of AGI for various income ranges: 36.6% for AGIs below $10k, 18.1% for AGIs $10k-25k, 5.3% for AGIs $25k-50k, 3.0% for AGIs $50k-75k, 2.8% for AGIs $75k-100k, 3.4% for AGIs over 100k)
IRA payment deduction: $3,551 (reported on 5.2% of returns)
11358:
$3,551
New York:
$3,115
(% of AGI for various income ranges: 0.6% for AGIs below $10k, 0.5% for AGIs $10k-25k, 0.7% for AGIs $25k-50k, 0.4% for AGIs $50k-75k, 0.4% for AGIs $75k-100k, 0.2% for AGIs over 100k)
Self-employed pension: $15,754 (reported on 0.8% of returns)
Here:
$15,754
New York:
$19,016
(% of AGI for various income ranges: 0.1% for AGIs $25k-50k, 0.1% for AGIs $50k-75k, 0.2% for AGIs $75k-100k, 0.5% for AGIs over 100k)
Total itemized deductions: $20,507 (25% of AGI, reported on 42.0% of returns)
Here:
$20,507
State:
$25,864
Here:
24.8% of AGI
State:
21.9% of AGI
(% of AGI for various income ranges: 14.4% for AGIs below $10k, 12.9% for AGIs $10k-25k, 15.9% for AGIs $25k-50k, 19.6% for AGIs $50k-75k, 20.4% for AGIs $75k-100k, 18.2% for AGIs over 100k)
Charity contributions deductions: $2,738 (3% of AGI, reported on 38.2% of returns)
Here:
$2,738
State:
$4,439
Here:
3.2% of AGI
State:
3.6% of AGI
(% of AGI for various income ranges: 0.9% for AGIs below $10k, 1.2% for AGIs $10k-25k, 1.9% for AGIs $25k-50k, 2.5% for AGIs $50k-75k, 2.7% for AGIs $75k-100k, 2.2% for AGIs over 100k)
Total tax: $7,217 (reported on 79.1% of returns)
11358:
$7,217
State:
$11,730
(% of AGI for various income ranges: 7.5% for AGIs below $10k, 5.4% for AGIs $10k-25k, 7.4% for AGIs $25k-50k, 9.9% for AGIs $50k-75k, 10.9% for AGIs $75k-100k, 16.6% for AGIs over 100k)
Earned income credit: $1,480 (reported on 14.7% of returns)
Here:
$1,480
State:
$1,757
Percentage of individuals using paid preparers for their 2004 taxes: 72.8%
Here:
73%
State:
67%
(% for various income ranges: 69.9% for AGIs below $10k, 74.6% for AGIs $10k-25k, 72.1% for AGIs $25k-50k, 73.1% for AGIs $50k-75k, 74.0% for AGIs $75k-100k, 74.2% for AGIs over 100k)
Likely homosexual households (counted as self-reported same-sex unmarried-partner households)
Lesbian couples: 0.0% of all households
Gay men: 0.0% of all households
Household received Food Stamps/SNAP in the past 12 months: 1,170 Household did not receive Food Stamps/SNAP in the past 12 months: 12,183
Women who had a birth in the past 12 months: 269 (188 now married, 80 unmarried) Women who did not have a birth in the past 12 months: 7,633 (3,711 now married, 3,877 unmarried)
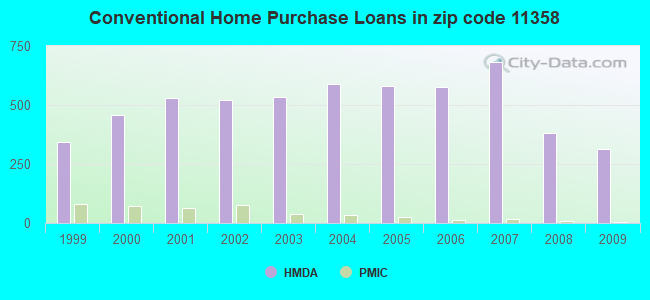
Housing units in zip code 11358 with a mortgage: 4,065 (476 second mortgage, 38 home equity loan, 385 both second mortgage and home equity loan) Houses without a mortgage: 118
Median monthly owner costs for units with a mortgage: $3,315 Median monthly owner costs for units without a mortgage: $1,250
Residents with income below the poverty level in 2022:
This zip code:
9.6%
Whole state:
14.3%
Residents with income below 50% of the poverty level in 2022:
This zip code:
4.2%
Whole state:
6.8%
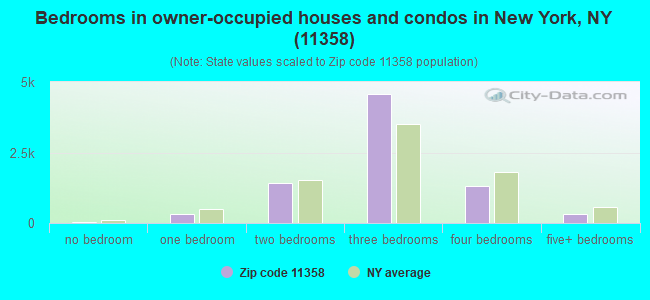
Median number of rooms in houses and condos:
Here:
6.0
State:
6.3
Median number of rooms in apartments:
Here:
3.9
State:
3.8
Notable locations in this zip code not listed on our city pages
Notable locations in zip code 11358: Auburndale Station (A), Broadway Station (B), Auburndale Branch Queens Borough Public Library (C), Fire Department New York Engine 320 Ladder 167 (D), New York Ladder Company 167 (E). Display/hide their locations on the map
Churches in zip code 11358 include: Temple Beth Sholom (A), Saint Kevins Church (B), Queens Herald Church (C), Lutheran Church of the Resurrection (D), Lutheran Church of the Messiah (E), Emmaus Mission Church of New York (F), Church On the Hill (G), New Hope Church of New York (H), Korean Love Mission Center (I). Display/hide their locations on the map
Parks in zip code 11358 include: Martin Field (1), Studley Triangle (2), Plaut Triangle (3), Auburndale Playground (4). Display/hide their locations on the map
5,023 married couples with children.
1,024 single-parent households (242 men, 782 women).
32.8% of residents of 11358 zip code speak English at home.
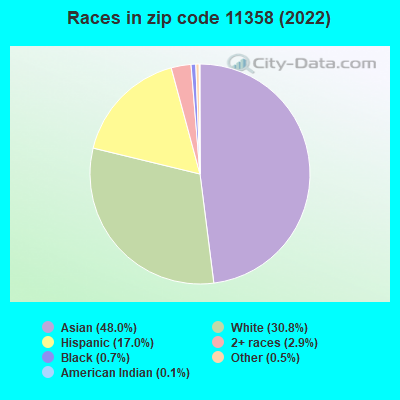
14.2% of residents speak Spanish at home (55% very well, 27% well, 13% not well, 6% not at all).
12.5% of residents speak other Indo-European language at home (61% very well, 31% well, 7% not well, 1% not at all).
40.6% of residents speak Asian or Pacific Island language at home (30% very well, 29% well, 29% not well, 12% not at all).
0.6% of residents speak other language at home (86% very well, 2% well, 13% not well).
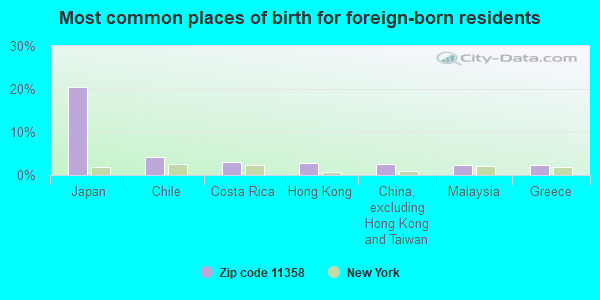
Foreign born population: 18,734 (50.6%) (58.8% of them are naturalized citizens)
This zip code:
50.6%
Whole state:
22.7%
21%Japan
4%Chile
3%Costa Rica
3%Hong Kong
2%China, excluding Hong Kong and Taiwan
2%Malaysia
2%Greece
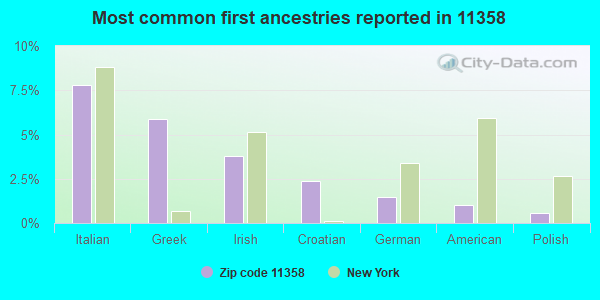
8%Italian
6%Greek
4%Irish
2%Croatian
1%German
1%American
1%Polish
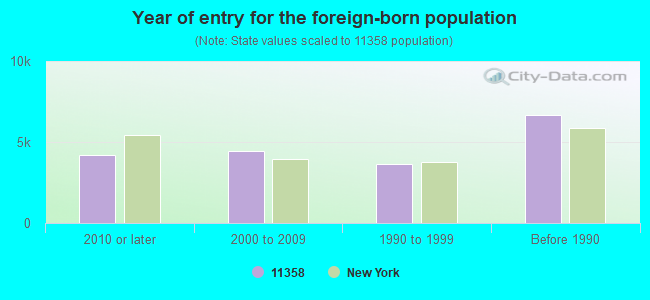
Year of entry for the foreign-born population
4,2182010 or later
4,4402000 to 2009
3,6651990 to 1999
6,686Before 1990
Public high school in in zip code 11358 not listed on the city page:
ST KEVIN SCHOOL(Students: 202, Location: 4550 195TH ST, Grades: PK-8)
Major facilities with environmental interests located in this zip code:
J & L CLEANERS (172-18 46TH AVE in FLUSHING, NY)
AIR MINOR (AIRS/AFS) STATE MASTER (New York facility tracking) - AIR PROGRAM Conditionally Exempt Small Quantity Generators, less than 100 kg/month of hazardous waste (Resource Conservation and Recovery Act (tracking hazardous waste)) - notification Business SIC classification: DRYCLEANING PLANTS, EXCEPT RUG CLEANING Business NAICS classification: DRYCLEANING AND LAUNDRY SERVICES (EXCEPT COIN-OPERATED). Organizations: J & J FRENCH CLEANERS (CONTACT/OWNER)
Alternative names: J & J FRENCH CLEANERS
IS 25 ADRIEN BLOCK SCHOOL ( in FLUSHING, NY)
(National Center for Education Statistics) - STATE ID-342500010025 Organizations: NEW YORK CITY PUBLIC SCHOOLS (SCHOOL DISTRICT)
H & L CLEANERS (42-13 MAIN STREET in FLUSHING, NY)
AIR MINOR (AIRS/AFS) (Resource Conservation and Recovery Act (tracking hazardous waste)) Business SIC classification: DRYCLEANING PLANTS, EXCEPT RUG CLEANING Alternative names: D D CLEANERS, H L CLEANERS
CLEANING CONCEPT 88 (36-22 FRANCIS LEWIS BLVD in FLUSHING, NY)
AIR MINOR (AIRS/AFS) Conditionally Exempt Small Quantity Generators, less than 100 kg/month of hazardous waste (Resource Conservation and Recovery Act (tracking hazardous waste)) - notification Business SIC classification: DRYCLEANING PLANTS, EXCEPT RUG CLEANING Organizations: CLEANING CONCEPT 88 CORP (CONTACT/OWNER)
Alternative names: PARAGON CLEANERS, PARAGON DISCOUNT CLEANERS
43-11 REALTY LLC (43-11 159TH ST in FLUSHING, NY)
Large Quantity Generators, more that 1000 kg of hazardous waste/month (Resource Conservation and Recovery Act (tracking hazardous waste)) - notification
ANTHONY AND SONS SERVICE STATION (39-01 UTOPIA PARKWAY in FLUSHING, NY)
ENFORCEMENT/COMPLIANCE ACTIVITY (Integrated Compliance Information System) (Resource Conservation and Recovery Act (tracking hazardous waste)) Alternative names: EXXON CO USA
CON ED - MH 13763 (WILLETS PT BLVD 127 ST in FLUSHING, NY)
HAZARDOUS WASTE BIENNIAL REPORTER (Resource Conservation and Recovery Act (tracking hazardous waste)) (Resource Conservation and Recovery Act (tracking hazardous waste))
CON ED - MH 5323 (FRESH MEADOWS LN--GLADWIN AVE in QUEENS, NY)
HAZARDOUS WASTE BIENNIAL REPORTER (Resource Conservation and Recovery Act (tracking hazardous waste)) (Resource Conservation and Recovery Act (tracking hazardous waste))
CON ED-M/H 11379 (NEC 155 ST 33 AVE in FLUSHING, NY)
HAZARDOUS WASTE BIENNIAL REPORTER (Resource Conservation and Recovery Act (tracking hazardous waste)) (Resource Conservation and Recovery Act (tracking hazardous waste))
CON ED-MH 12073 (S/S BAYSIDE AVE in FLUSHING, NY)
HAZARDOUS WASTE BIENNIAL REPORTER (Resource Conservation and Recovery Act (tracking hazardous waste)) (Resource Conservation and Recovery Act (tracking hazardous waste))
CON ED-MH 16612 (W/S 99 ST 50' S/O ALSTYNE AVE in QUEENS, NY)
HAZARDOUS WASTE BIENNIAL REPORTER (Resource Conservation and Recovery Act (tracking hazardous waste)) (Resource Conservation and Recovery Act (tracking hazardous waste))
CON ED-TM 5746 (W/S JORDAN ST 24' N/O 35TH AVE in QUEENS, NY)
HAZARDOUS WASTE BIENNIAL REPORTER (Resource Conservation and Recovery Act (tracking hazardous waste)) (Resource Conservation and Recovery Act (tracking hazardous waste))
36-14 165TH ST BUILDING (36-14 165TH ST in QUEENS, NY)
AIR MINOR (AIRS/AFS) Business SIC classification: OPERATORS OF DWELLINGS OTHER THAN APARTMENT BUILDINGS
Housing units lacking complete plumbing facilities: 0.3% Housing units lacking complete kitchen facilities: 0.9%
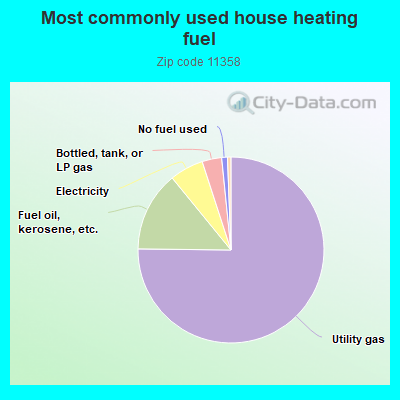
75.2%Utility gas
13.9%Fuel oil, kerosene, etc.
5.9%Electricity
3.4%Bottled, tank, or LP gas
1.0%No fuel used
0.6%Other fuel
Population in 1990: 34,045. Population change in the 1990s: +4,602 (+13.5%).
Place of birth for U.S.-born residents:
This state: 17,037
Northeast: 442
Midwest: 67
South: 243
West: 67
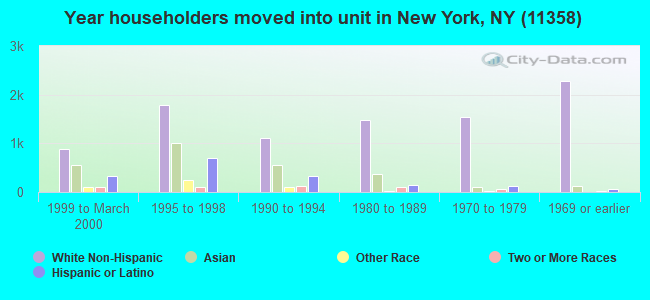
68% of the 11358 zip code residents lived in the same house 5 years ago. Out of people who lived in different houses, 76% lived in this county. Out of people who lived in different counties, 50% lived in New York.
94% of the 11358 zip code residents lived in the same house 1 year ago. Out of people who lived in different houses, 68% moved from this county. Out of people who lived in different houses, 12% moved from different county within same state. Out of people who lived in different houses, 12% moved from different state. Out of people who lived in different houses, 6% moved from abroad.
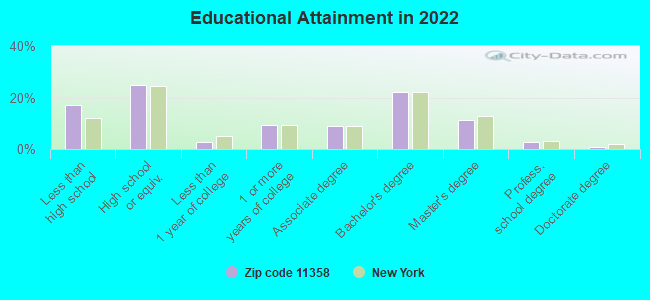
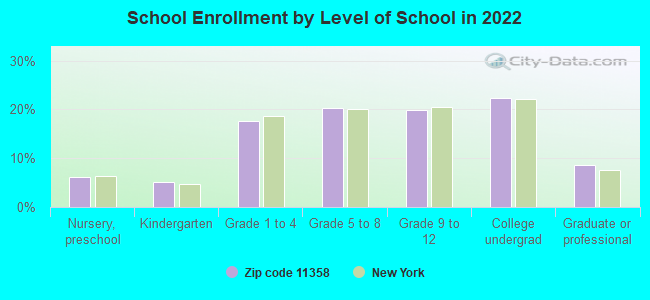
Private vs. public school enrollment:
Students in private schools in grades 1 to 8 (elementary and middle school): 310
Here:
10.9%
New York:
15.6%
Students in private schools in grades 9 to 12 (high school): 294
Here:
19.6%
New York:
15.0%
Students in private undergraduate colleges: 465
Here:
27.9%
New York:
39.2%
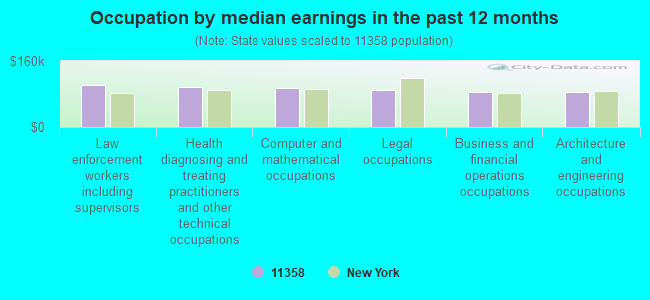
Occupation by median earnings in the past 12 months ($)
100,916Law enforcement workers including supervisors
97,186Health diagnosing and treating practitioners and other technical occupations
94,144Computer and mathematical occupations
89,753Legal occupations
85,703Business and financial operations occupations
84,207Architecture and engineering occupations
Companies with federal contracts located in this zip code:
MALIK AND ASSOCIATES PC (15814 NTHRN BLVD FL 2 in FLUSHING, NY; small business) 8 employees, $50000 revenue. 8A Firm, Small Disadvantaged Business, Woman Owned Business: $1,064,500 in 9 contractsfrom 2003 to 2006
Contracts for Other Professional Services by HOUSING AND URBAN DEVELOPMENT, Department of Signed by year:2000: $0; 2001: $0; 2002: $0; 2003: $260,000; 2004: $260,000; 2005: $272,250; 2006: $272,250.
Biggest contracts:
$272,250 with HOUSING AND URBAN DEVELOPMENT, Department of for Other Professional Services. Signed on 2006-07-26. Effective on 2006-09-01. Completion date: 2007-08-31.
$272,250, same as above.Signed on 2005-08-22. Effective on 2005-09-01. Completion date: 2006-08-31.
$260,000, same as above.Signed on 2004-07-21. Effective on 2004-09-01. Completion date: 2005-08-31.
$260,000, same as above.Signed on 2003-06-15. Completion date: 2004-08-15.
M & R OFFICIATING INC (46-07 195 STREET in FLUSHING, NY; small business) : $51,612 in 17 contractsfrom 2001 to 2006
Contracts for Other Professional Services, Other Education and Training Services, Recreational Services by Army Signed by year:2000: $0; 2001: -$14,054; 2002: $14,250; 2003: $37,268; 2004: $20,108; 2005: -$5,940; 2006: -$20.
Biggest contracts:
$16,122 with Army for Other Professional Services. Signed on 2003-01-27. Completion date: 2003-08-31.
$14,960 with Army for Other Education and Training Services. Signed on 2004-11-19. Completion date: 2005-08-30.
$12,896, same as above.Signed on 2003-12-10. Completion date: 2004-08-30.
$11,928 with Army for Other Professional Services. Signed on 2002-02-07. Completion date: 2002-08-31.
THE RENTAL COMPANY OF NY, INC (189 03 NORTHERN BLVD in FLUSHING, NY; small business) : $16,975 in 2 contractsin 2002
$16,625 with Army for Motor Passenger Services. Signed on 2002-02-11. Completion date: 2002-04-17.
$350, same as above.Signed on 2002-06-25. Completion date: 2002-04-17.
Top industries in this zip code by the number of employees in 2005:
Other Services (except Public Administration): Religious Organizations (50-99 employees: 1 establishment, 20-49 employees: 1 establishment, 10-19 employees: 4 establishments, 5-9 employees: 4 establishments, 1-4 employees: 14 establishments)
2007 - 2018 National Fire Incident Reporting System (NFIRS) incidents
According to the data from the years 2007 - 2018 the average number of fires per year is 98. The highest number of reported fires - 118 took place in 2008, and the least - 64 in 2007. The data has an increasing trend.
When looking into fire subcategories, the most reports belonged to: Structure Fires (72.5%), and Outside Fires (19.9%).
Fire incident types reported to NFIRS in Zip Code 11358

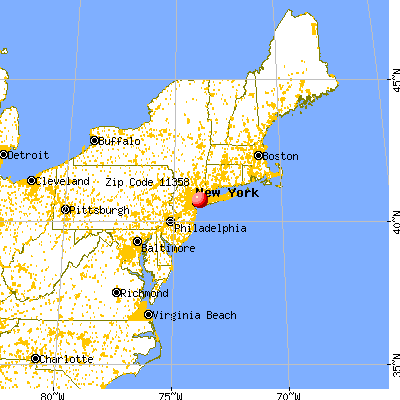


 Nearest zip codes: 11365, 11361, 11360, 11355, 11357, 11354.
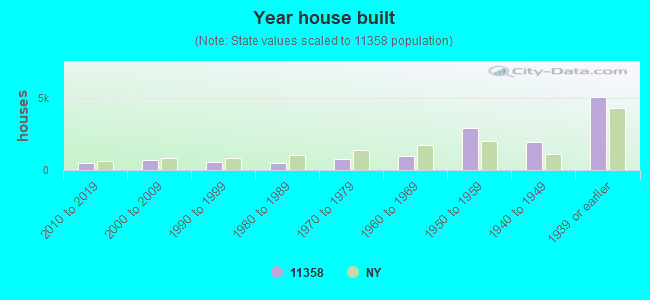


 (Students: 561, Location: 34-65 192ND ST, Grades: 6-12)
 According to the data from the years 2007 - 2018 the average number of fires per year is 98. The highest number of reported fires - 118 took place in 2008, and the least - 64 in 2007. The data has an increasing trend.
 When looking into fire subcategories, the most reports belonged to: Structure Fires (72.5%), and Outside Fires (19.9%).