Estimated zip code population in 2022: 19,406 Zip code population in 2010: 18,884 Zip code population in 2000: 19,350
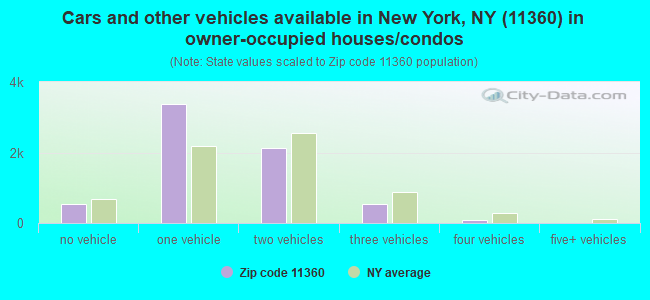
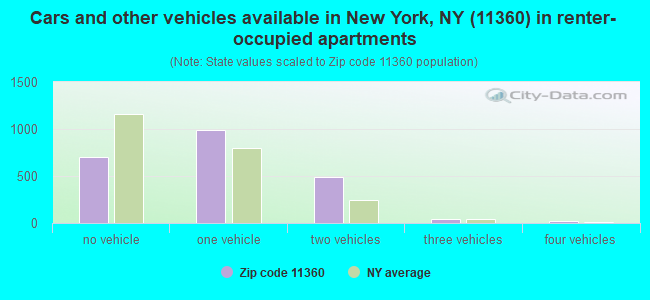
Houses and condos: 9,815 Renter-occupied apartments: 2,256
% of renters here:
25%
State:
46%
March 2022 cost of living index in zip code 11360: 149.6 (very high, U.S. average is 100)
Land area: 1.4 sq. mi. Water area: 0.0 sq. mi.
Population density: 13,505 people per square mile
(very high).
OSM Map
General Map
Google Map
MSN Map
OSM Map
General Map
Google Map
MSN Map
OSM Map
General Map
Google Map
MSN Map
OSM Map
General Map
Google Map
MSN Map
Please wait while loading the map...
Real estate property taxes paid for housing units in 2022:
This zip code:
0.9% ($6,706)
New York:
1.5% ($6,180)
Median real estate property taxes paid for housing units with mortgages in 2022: $6,649 (0.9%) Median real estate property taxes paid for housing units with no mortgage in 2022: $6,742 (1.0%)
Estimated median house/condo value in 2022: $708,336
11360:
$708,336
New York:
$400,400
According to our research of New York and other state lists, there were 2 registered sex offenders living in 11360 zip code as of April 26, 2024. The ratio of all residents to sex offenders in zip code 11360 is 9,793 to 1. The ratio of registered sex offenders to all residents in this zip code is much lower than the state average.
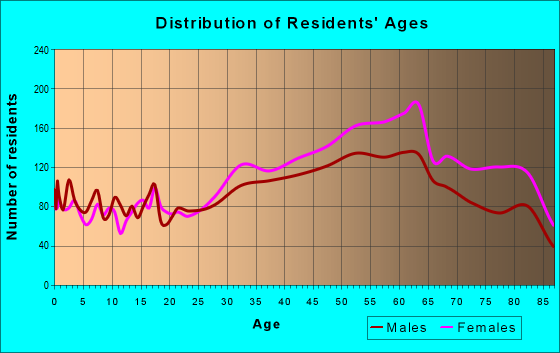
Median resident age:
This zip code:
52.8 years
New York median age:
40.0 years
Average household size:
This zip code:
2.2 people
New York:
2.5 people
Averages for the 2020 tax year for zip code 11360, filed in 2021:
Average Adjusted Gross Income (AGI) in 2020: $95,439 (Individual Income Tax Returns)
Here:
$95,439
State:
$90,930
Salary/wage: $81,711 (reported on 69.6% of returns)
Here:
$81,711
State:
$72,104
(% of AGI for various income ranges: 997.3% for AGIs below $25k, 3232.2% for AGIs $25k-50k, 6340.1% for AGIs $50k-75k, 9371.2% for AGIs $75k-100k, 17821.2% for AGIs $100k-200k, 76628.6% for AGIs over 200k)
Taxable interest for individuals: $2,950 (reported on 52.6% of returns)
This zip code:
$2,950
New York:
$3,075
(% of AGI for various income ranges: 93.2% for AGIs below $25k, 103.6% for AGIs $25k-50k, 172.8% for AGIs $50k-75k, 252.6% for AGIs $75k-100k, 362.2% for AGIs $100k-200k, 2232.5% for AGIs over 200k)
Ordinary dividends: $7,451 (reported on 38.9% of returns)
Here:
$7,451
State:
$11,095
(% of AGI for various income ranges: 121.2% for AGIs below $25k, 177.4% for AGIs $25k-50k, 298.7% for AGIs $50k-75k, 349.5% for AGIs $75k-100k, 678.6% for AGIs $100k-200k, 4828.6% for AGIs over 200k)
Net capital gain/loss in AGI: +$19,503 (reported on 37.0% of returns)
Here:
+$19,503
State:
+$44,925
(% of AGI for various income ranges: 23.7% for AGIs below $25k, 104.2% for AGIs $25k-50k, 207.6% for AGIs $50k-75k, 372.9% for AGIs $75k-100k, 1153.6% for AGIs $100k-200k, 19710.4% for AGIs over 200k)
Profit/loss from business: +$16,975 (reported on 15.7% of returns)
Here:
+$16,975
State:
+$14,940
(% of AGI for various income ranges: 199.0% for AGIs below $25k, 296.6% for AGIs $25k-50k, 305.7% for AGIs $50k-75k, 315.5% for AGIs $75k-100k, 551.6% for AGIs $100k-200k, 3713.6% for AGIs over 200k)
Taxable individual retirement arrangement distribution: $18,697 (reported on 14.4% of returns)
11360:
$18,697
New York:
$19,609
(% of AGI for various income ranges: 149.9% for AGIs below $25k, 250.6% for AGIs $25k-50k, 372.6% for AGIs $50k-75k, 476.0% for AGIs $75k-100k, 818.7% for AGIs $100k-200k, 2576.1% for AGIs over 200k)
Self-employed (Keogh) retirement plans: $20,900 (reported on 1.1% of returns)
11360:
$20,900
New York:
$32,497
(% of AGI for various income ranges: 61.0% for AGIs $50k-75k, 31.7% for AGIs $100k-200k, 503.2% for AGIs over 200k)
Total itemized deductions: $29,978 (reported on 20.0% of returns)
Here:
$29,978
State:
$39,326
(% of AGI for various income ranges: 243.5% for AGIs below $25k, 403.9% for AGIs $25k-50k, 670.2% for AGIs $50k-75k, 937.4% for AGIs $75k-100k, 1856.4% for AGIs $100k-200k, 7348.6% for AGIs over 200k)
Charity contributions: $6,643 (reported on 17.1% of returns)
Here:
$6,643
State:
$15,420
(% of AGI for various income ranges: 10.3% for AGIs below $25k, 27.9% for AGIs $25k-50k, 81.4% for AGIs $50k-75k, 127.4% for AGIs $75k-100k, 287.3% for AGIs $100k-200k, 2268.9% for AGIs over 200k)
Taxes paid: $8,869 (reported on 19.9% of returns)
11360:
$8,869
State:
$9,183
(% of AGI for various income ranges: 68.6% for AGIs below $25k, 117.3% for AGIs $25k-50k, 227.1% for AGIs $50k-75k, 343.2% for AGIs $75k-100k, 637.0% for AGIs $100k-200k, 1565.4% for AGIs over 200k)
Earned income credit: $1,640 (reported on 7.6% of returns)
Here:
$1,640
State:
$2,138
(% of AGI for various income ranges: 51.5% for AGIs below $25k, 53.6% for AGIs $25k-50k)
Percentage of individuals using paid preparers for their 2020 taxes: 95.2%
Here:
95%
State:
95%
(% for various income ranges: 94.4% for AGIs below $25k, 95.2% for AGIs $25k-50k, 95.8% for AGIs $50k-75k, 95.6% for AGIs $75k-100k, 94.8% for AGIs $100k-200k, 97.1% for AGIs over 200k)
Averages for the 2012 tax year for zip code 11360, filed in 2013:
Average Adjusted Gross Income (AGI) in 2012: $84,422 (Individual Income Tax Returns)
Here:
$84,422
State:
$77,088
Salary/wage: $73,366 (reported on 71.0% of returns)
Here:
$73,366
State:
$60,593
(% of AGI for various income ranges: 53.8% for AGIs below $25k, 62.8% for AGIs $25k-50k, 62.9% for AGIs $50k-75k, 62.3% for AGIs $75k-100k, 68.1% for AGIs $100k-200k, 55.2% for AGIs over 200k)
Taxable interest for individuals: $2,391 (reported on 62.0% of returns)
This zip code:
$2,391
New York:
$3,125
(% of AGI for various income ranges: 5.6% for AGIs below $25k, 2.4% for AGIs $25k-50k, 1.9% for AGIs $50k-75k, 1.7% for AGIs $75k-100k, 1.2% for AGIs $100k-200k, 1.6% for AGIs over 200k)
Ordinary dividends: $5,645 (reported on 40.2% of returns)
Here:
$5,645
State:
$10,299
(% of AGI for various income ranges: 6.2% for AGIs below $25k, 3.8% for AGIs $25k-50k, 3.1% for AGIs $50k-75k, 2.4% for AGIs $75k-100k, 2.2% for AGIs $100k-200k, 2.5% for AGIs over 200k)
Net capital gain/loss in AGI: +$11,319 (reported on 35.8% of returns)
Here:
+$11,319
State:
+$42,474
(% of AGI for various income ranges: 0.9% for AGIs $100k-200k, 14.4% for AGIs over 200k)
Profit/loss from business: +$19,294 (reported on 15.9% of returns)
Here:
+$19,294
State:
+$16,168
(% of AGI for various income ranges: 14.4% for AGIs below $25k, 6.7% for AGIs $25k-50k, 2.8% for AGIs $50k-75k, 3.0% for AGIs $75k-100k, 3.1% for AGIs $100k-200k, 2.7% for AGIs over 200k)
Taxable individual retirement arrangement distribution: $15,278 (reported on 19.7% of returns)
11360:
$15,278
New York:
$17,621
(% of AGI for various income ranges: 8.8% for AGIs below $25k, 4.8% for AGIs $25k-50k, 5.3% for AGIs $50k-75k, 4.0% for AGIs $75k-100k, 3.5% for AGIs $100k-200k, 2.0% for AGIs over 200k)
Self-employment retirement plans: $22,992 (reported on 1.2% of returns)
11360:
$22,992
New York:
$27,330
(% of AGI for various income ranges: 0.5% for AGIs below $25k, 0.3% for AGIs $50k-75k, 0.3% for AGIs $100k-200k, 0.6% for AGIs over 200k)
Total itemized deductions: $27,589 (22% of AGI, reported on 55.9% of returns)
Here:
$27,589
State:
$34,985
Here:
22.4% of AGI
State:
21.3% of AGI
(% of AGI for various income ranges: 24.2% for AGIs below $25k, 19.8% for AGIs $25k-50k, 18.4% for AGIs $50k-75k, 18.8% for AGIs $75k-100k, 18.9% for AGIs $100k-200k, 16.3% for AGIs over 200k)
Charity contributions: $2,951 (reported on 48.9% of returns)
Here:
$2,951
State:
$5,572
(% of AGI for various income ranges: 1.3% for AGIs below $25k, 1.7% for AGIs $25k-50k, 1.8% for AGIs $50k-75k, 1.7% for AGIs $75k-100k, 1.8% for AGIs $100k-200k, 1.6% for AGIs over 200k)
Taxes paid: $14,394 (reported on 55.6% of returns)
11360:
$14,394
State:
$18,656
(% of AGI for various income ranges: 7.7% for AGIs below $25k, 6.6% for AGIs $25k-50k, 7.9% for AGIs $50k-75k, 8.8% for AGIs $75k-100k, 9.9% for AGIs $100k-200k, 10.7% for AGIs over 200k)
Earned income credit: $1,887 (reported on 7.7% of returns)
Here:
$1,887
State:
$2,230
(% of AGI for various income ranges: 3.3% for AGIs below $25k, 0.6% for AGIs $25k-50k)
Percentage of individuals using paid preparers for their 2012 taxes: 77.6%
Here:
78%
State:
66%
(% for various income ranges: 74.4% for AGIs below $25k, 78.2% for AGIs $25k-50k, 78.0% for AGIs $50k-75k, 78.7% for AGIs $75k-100k, 78.8% for AGIs $100k-200k, 83.6% for AGIs over 200k)
Averages for the 2004 tax year for zip code 11360, filed in 2005:
Average Adjusted Gross Income (AGI) in 2004: $67,056 (Individual Income Tax Returns)
Here:
$67,056
State:
$59,519
Salary/wage: $61,270 (reported on 71.0% of returns)
Here:
$61,270
State:
$50,673
(% of AGI for various income ranges: 205.5% for AGIs below $10k, 49.6% for AGIs $10k-25k, 65.2% for AGIs $25k-50k, 69.3% for AGIs $50k-75k, 68.5% for AGIs $75k-100k, 62.8% for AGIs over 100k)
Taxable interest for individuals: $2,886 (reported on 75.1% of returns)
This zip code:
$2,886
New York:
$2,377
(% of AGI for various income ranges: 43.9% for AGIs below $10k, 9.0% for AGIs $10k-25k, 4.9% for AGIs $25k-50k, 3.1% for AGIs $50k-75k, 2.9% for AGIs $75k-100k, 2.3% for AGIs over 100k)
Taxable dividends: $4,622 (reported on 48.6% of returns)
Here:
$4,622
State:
$5,394
(% of AGI for various income ranges: 33.5% for AGIs below $10k, 5.8% for AGIs $10k-25k, 3.1% for AGIs $25k-50k, 2.6% for AGIs $50k-75k, 2.4% for AGIs $75k-100k, 3.5% for AGIs over 100k)
Net capital gain/loss: +$7,229 (reported on 43.3% of returns)
Here:
+$7,229
State:
+$23,581
(% of AGI for various income ranges: -12.3% for AGIs below $10k, -1.3% for AGIs $10k-25k, -0.1% for AGIs $25k-50k, 0.1% for AGIs $50k-75k, 1.8% for AGIs $75k-100k, 8.3% for AGIs over 100k)
Profit/loss from business: +$18,793 (reported on 16.1% of returns)
Here:
+$18,793
State:
+$13,809
(% of AGI for various income ranges: 37.2% for AGIs below $10k, 12.4% for AGIs $10k-25k, 6.5% for AGIs $25k-50k, 3.2% for AGIs $50k-75k, 2.6% for AGIs $75k-100k, 4.1% for AGIs over 100k)
IRA payment deduction: $3,629 (reported on 5.7% of returns)
11360:
$3,629
New York:
$3,115
(% of AGI for various income ranges: 1.5% for AGIs below $10k, 0.5% for AGIs $10k-25k, 0.7% for AGIs $25k-50k, 0.4% for AGIs $50k-75k, 0.3% for AGIs $75k-100k, 0.2% for AGIs over 100k)
Self-employed pension: $15,119 (reported on 2.0% of returns)
Here:
$15,119
New York:
$19,016
(% of AGI for various income ranges: 1.5% for AGIs below $10k, 0.3% for AGIs $25k-50k, 0.2% for AGIs $50k-75k, 0.2% for AGIs $75k-100k, 0.7% for AGIs over 100k)
Total itemized deductions: $22,421 (23% of AGI, reported on 57.2% of returns)
Here:
$22,421
State:
$25,864
Here:
23.2% of AGI
State:
21.9% of AGI
(% of AGI for various income ranges: 72.7% for AGIs below $10k, 23.3% for AGIs $10k-25k, 20.1% for AGIs $25k-50k, 20.6% for AGIs $50k-75k, 20.3% for AGIs $75k-100k, 17.5% for AGIs over 100k)
Charity contributions deductions: $2,954 (3% of AGI, reported on 53.3% of returns)
Here:
$2,954
State:
$4,439
Here:
3.0% of AGI
State:
3.6% of AGI
(% of AGI for various income ranges: 4.4% for AGIs below $10k, 2.2% for AGIs $10k-25k, 2.3% for AGIs $25k-50k, 2.5% for AGIs $50k-75k, 2.5% for AGIs $75k-100k, 2.3% for AGIs over 100k)
Total tax: $11,561 (reported on 82.7% of returns)
11360:
$11,561
State:
$11,730
(% of AGI for various income ranges: 10.8% for AGIs below $10k, 4.6% for AGIs $10k-25k, 7.8% for AGIs $25k-50k, 10.6% for AGIs $50k-75k, 11.9% for AGIs $75k-100k, 18.0% for AGIs over 100k)
Earned income credit: $1,397 (reported on 6.0% of returns)
Here:
$1,397
State:
$1,757
Percentage of individuals using paid preparers for their 2004 taxes: 76.8%
Here:
77%
State:
67%
(% for various income ranges: 72.4% for AGIs below $10k, 78.3% for AGIs $10k-25k, 76.6% for AGIs $25k-50k, 75.8% for AGIs $50k-75k, 77.8% for AGIs $75k-100k, 79.3% for AGIs over 100k)
Likely homosexual households (counted as self-reported same-sex unmarried-partner households)
Lesbian couples: 0.1% of all households
Gay men: 0.1% of all households
Household received Food Stamps/SNAP in the past 12 months: 567 Household did not receive Food Stamps/SNAP in the past 12 months: 8,215
Women who had a birth in the past 12 months: 88 (31 now married, 59 unmarried) Women who did not have a birth in the past 12 months: 3,672 (1,480 now married, 2,184 unmarried)
Housing units in zip code 11360 with a mortgage: 2,592 (252 second mortgage, 4 home equity loan, 245 both second mortgage and home equity loan) Houses without a mortgage: 87
Median monthly owner costs for units with a mortgage: $2,597 Median monthly owner costs for units without a mortgage: $1,310
Residents with income below the poverty level in 2022:
This zip code:
6.7%
Whole state:
14.3%
Residents with income below 50% of the poverty level in 2022:
This zip code:
3.6%
Whole state:
6.8%
Median number of rooms in houses and condos:
Here:
4.7
State:
6.3
Median number of rooms in apartments:
Here:
4.0
State:
3.8
Notable locations in this zip code not listed on our city pages
Notable locations in zip code 11360: Clearview Park Golf Course (A), Bayside Marina (B), Bay Terrace Branch Queens Borough Public Library (C). Display/hide their locations on the map
Churches in zip code 11360 include: Grace Presbyterian Church of New York (A), Grace Korean Presbyterian Church (B), Good Shepherd Lutheran Church (C). Display/hide their locations on the map
Parks in zip code 11360 include: Bayside Athletic Field (1), Clearview Park (2), John Golden Park (3), Bay Terrace Playground (4). Display/hide their locations on the map
Tourist attraction (not listed on the city page) : Michael Besserman Artist & Company (Art Museums; 14-22 Watersedge Drive).
In group quarters: 76 (-1 institutionalized population)
Size of family households: 2,515 2-persons, 1,026 3-persons, 841 4-persons, 458 5-persons, 46 6-persons, 135 7-or-more-persons
Size of nonfamily households: 3,438 1-person, 460 2-persons, 2 3-persons
2,120 married couples with children.
312 single-parent households (78 men, 234 women).
58.9% of residents of 11360 zip code speak English at home.
5.9% of residents speak Spanish at home (53% very well, 14% well, 20% not well, 13% not at all).
12.4% of residents speak other Indo-European language at home (71% very well, 21% well, 8% not well).
23.4% of residents speak Asian or Pacific Island language at home (36% very well, 31% well, 24% not well, 9% not at all).
1.0% of residents speak other language at home (77% very well, 23% well).
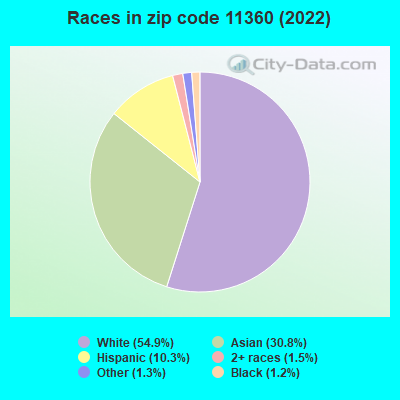
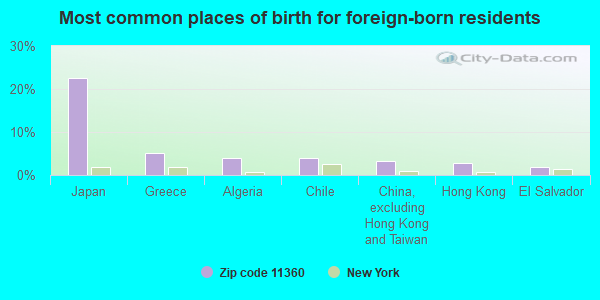
Foreign born population: 6,541 (33.7%) (86.1% of them are naturalized citizens)
This zip code:
33.7%
Whole state:
22.7%
22%Japan
5%Greece
4%Algeria
4%Chile
3%China, excluding Hong Kong and Taiwan
3%Hong Kong
2%El Salvador
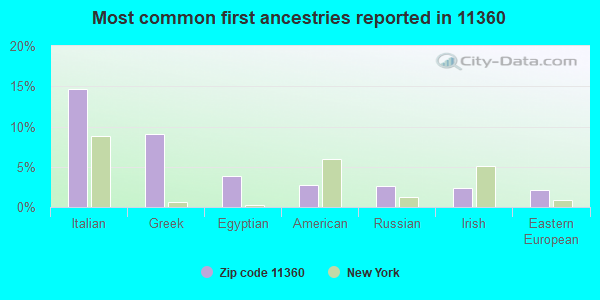
15%Italian
9%Greek
4%Egyptian
3%American
3%Russian
2%Irish
2%Eastern European
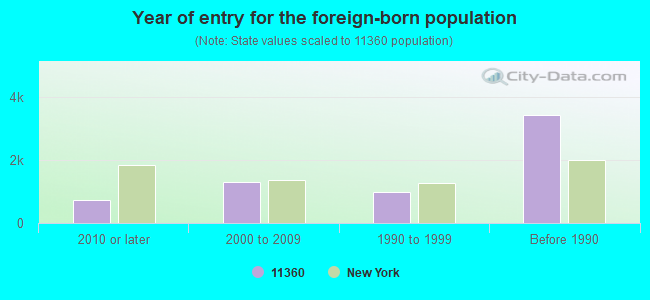
Year of entry for the foreign-born population
7382010 or later
1,3012000 to 2009
9881990 to 1999
3,418Before 1990
Facilities with environmental interests located in this zip code:
ANDREWS FRENCH CLEANERS (78-39 SPRINGFIELD BOULEVARD in BAYSIDE, NY)
AIR MINOR (AIRS/AFS) Conditionally Exempt Small Quantity Generators, less than 100 kg/month of hazardous waste (Resource Conservation and Recovery Act (tracking hazardous waste)) - notification Business SIC classification: DRYCLEANING PLANTS, EXCEPT RUG CLEANING Organizations: V H A CLEANERS CORP (CONTACT/OWNER)
GETTY PETROLEUM CORPORATION SERVICE STATION (204-12 NORTHERN BOULEVARD in BAYSIDE, NY)
AIR MINOR (AIRS/AFS) Conditionally Exempt Small Quantity Generators, less than 100 kg/month of hazardous waste (Resource Conservation and Recovery Act (tracking hazardous waste)) - notification Business SIC classification: GASOLINE SERVICE STATIONS Alternative names: POWER TEST-GETTY #58085
GULF-AUTO TECH S/C (79-01 SPRINGFIELD BOULEVARD in BAYSIDE, NY)
AIR MINOR (AIRS/AFS) Conditionally Exempt Small Quantity Generators, less than 100 kg/month of hazardous waste (Resource Conservation and Recovery Act (tracking hazardous waste)) - notification Business SIC classification: GASOLINE SERVICE STATIONS Organizations: CUMBERLAND FARMS INC (CONTACT/OWNER)
Alternative names: GULF SERVICE STATION 120954, GULF SERVICE STATION #120954
CON ED - V 3847 (158-11 JEWEL AVE in FLUSHING, NY)
HAZARDOUS WASTE BIENNIAL REPORTER (Resource Conservation and Recovery Act (tracking hazardous waste)) (Resource Conservation and Recovery Act (tracking hazardous waste))
23-25 BELL BLVD BUILDING (23-25 BELL BLVD in FLUSHING, NY)
AIR MINOR (AIRS/AFS) Business SIC classification: OPERATORS OF APARTMENT BUILDINGS
Housing units lacking complete plumbing facilities: 0.7% Housing units lacking complete kitchen facilities: 0.2%
74.3%Utility gas
11.6%Electricity
11.5%Fuel oil, kerosene, etc.
1.4%Bottled, tank, or LP gas
0.6%Other fuel
Population in 1990: 20,337.
Place of birth for U.S.-born residents:
This state: 11,818
Northeast: 532
Midwest: 101
South: 239
West: 52
68% of the 11360 zip code residents lived in the same house 5 years ago. Out of people who lived in different houses, 65% lived in this county. Out of people who lived in different counties, 50% lived in New York.
90% of the 11360 zip code residents lived in the same house 1 year ago. Out of people who lived in different houses, 69% moved from this county. Out of people who lived in different houses, 22% moved from different county within same state. Out of people who lived in different houses, 7% moved from different state. Out of people who lived in different houses, 2% moved from abroad.
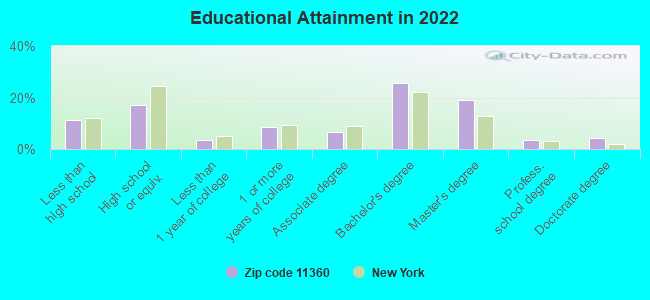
Private vs. public school enrollment:
Students in private schools in grades 1 to 8 (elementary and middle school): 143
Here:
13.9%
New York:
15.6%
Students in private schools in grades 9 to 12 (high school): 377
Here:
52.4%
New York:
15.0%
Students in private undergraduate colleges: 225
Here:
26.1%
New York:
39.2%
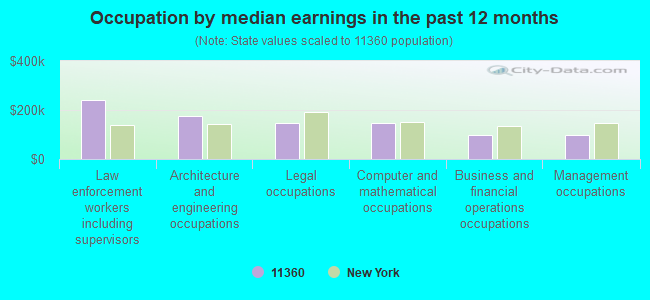
Occupation by median earnings in the past 12 months ($)
239,870Law enforcement workers including supervisors
174,200Architecture and engineering occupations
148,093Legal occupations
147,007Computer and mathematical occupations
99,507Business and financial operations occupations
96,214Management occupations
Companies with federal contracts located in this zip code:
NORTH SHORE INTERNATIONAL INC (213-33 40TH AVE 2ND FLOOR in BAYSIDE, NY; small business) : $18,170 in 5 contractsfrom 2004 to 2005
Contracts for Trucks and Truck Tractors, Wheeled by Army Signed by year:2000: $0; 2001: $0; 2002: $0; 2003: $0; 2004: $175,060; 2005: -$156,890; 2006: $0.
Biggest contracts:
$156,890 with Army for Trucks and Truck Tractors, Wheeled. Signed on 2004-09-22. Completion date: 2008-03-21.
$18,170, same as above.Signed on 2004-06-16. Completion date: 2006-08-01.
$0, same as above.Signed on 2004-06-16. Completion date: 2006-08-01.
$0, same as above.Signed on 2004-09-22. Completion date: 2008-03-21.
Top industries in this zip code by the number of employees in 2005:
Health Care and Social Assistance: Nursing Care Facilities (500-999 employees: 1 establishment)
Health Care and Social Assistance: Offices of Physicians (except Mental Health Specialists) (20-49: 2, 10-19: 5, 5-9: 6, 1-4: 17)
Health Care and Social Assistance: Services for the Elderly and Persons with Disabilities (100-249: 1, 1-4: 1)
Health Care and Social Assistance: Other Individual and Family Services (100-249: 1)
Health Care and Social Assistance: Offices of Dentists (20-49: 2, 10-19: 1, 5-9: 3, 1-4: 10)
Real Estate and Rental and Leasing: Lessors of Residential Buildings and Dwellings (10-19: 3, 5-9: 3, 1-4: 19)
Other Services (except Public Administration): Other Similar Organizations (except Business, Professional, Labor, and Political Organizations) (20-49: 1, 10-19: 1, 5-9: 6, 1-4: 6)
People in group quarters in 2010:
16 people in group homes intended for adults
People in group quarters in 2000:
82 people in wards in general hospitals for patients who have no usual home elsewhere
29 people in homes for the mentally retarded
13 people in hospitals/wards and hospices for chronically ill
13 people in other hospitals or wards for chronically ill
Home Mortgage Disclosure Act Aggregated Statistics For Year 2009 (Based on 6 full and 8 partial tracts)
A) FHA, FSA/RHS & VA Home Purchase Loans
B) Conventional Home Purchase Loans
C) Refinancings
D) Home Improvement Loans
E) Loans on Dwellings For 5+ Families
F) Non-occupant Loans on < 5 Family Dwellings (A B C & D)
Number
Average Value
Number
Average Value
Number
Average Value
Number
Average Value
Number
Average Value
Number
Average Value
LOANS ORIGINATED
1
$208,250
354
$267,686
357
$241,710
11
$230,778
2
$1,440,285
17
$298,745
APPLICATIONS APPROVED, NOT ACCEPTED
0
$0
33
$280,337
51
$332,127
4
$113,978
0
$0
0
$0
APPLICATIONS DENIED
2
$364,540
71
$284,097
177
$305,757
17
$122,714
0
$0
23
$280,073
APPLICATIONS WITHDRAWN
4
$280,618
37
$251,167
113
$273,702
6
$266,745
2
$392,000
14
$191,419
FILES CLOSED FOR INCOMPLETENESS
0
$0
10
$355,999
48
$322,498
0
$0
0
$0
2
$317,855
Aggregated Statistics For Year 2008 (Based on 6 full and 8 partial tracts)
A) FHA, FSA/RHS & VA Home Purchase Loans
B) Conventional Home Purchase Loans
C) Refinancings
D) Home Improvement Loans
E) Loans on Dwellings For 5+ Families
F) Non-occupant Loans on < 5 Family Dwellings (A B C & D)
G) Loans On Manufactured Home Dwelling (A B C & D)
Number
Average Value
Number
Average Value
Number
Average Value
Number
Average Value
Number
Average Value
Number
Average Value
Number
Average Value
LOANS ORIGINATED
4
$398,658
436
$291,841
201
$284,199
9
$101,820
5
$3,440,038
32
$307,411
0
$0
APPLICATIONS APPROVED, NOT ACCEPTED
0
$0
71
$303,365
40
$306,340
6
$109,970
0
$0
11
$257,065
2
$18,875
APPLICATIONS DENIED
6
$594,655
126
$303,735
129
$303,309
28
$138,872
0
$0
14
$270,204
0
$0
APPLICATIONS WITHDRAWN
2
$566,775
49
$366,613
72
$335,635
4
$404,770
2
$2,185,260
8
$439,082
0
$0
FILES CLOSED FOR INCOMPLETENESS
0
$0
19
$437,644
19
$260,723
2
$23,010
0
$0
1
$111,290
0
$0
Aggregated Statistics For Year 2007 (Based on 6 full and 8 partial tracts)
B) Conventional Home Purchase Loans
C) Refinancings
D) Home Improvement Loans
E) Loans on Dwellings For 5+ Families
F) Non-occupant Loans on < 5 Family Dwellings (A B C & D)
Number
Average Value
Number
Average Value
Number
Average Value
Number
Average Value
Number
Average Value
LOANS ORIGINATED
579
$331,077
254
$291,851
35
$104,057
8
$31,511,201
38
$373,307
APPLICATIONS APPROVED, NOT ACCEPTED
92
$336,413
57
$329,295
12
$58,573
2
$297,990
8
$355,141
APPLICATIONS DENIED
166
$371,051
127
$379,526
33
$110,803
0
$0
21
$421,619
APPLICATIONS WITHDRAWN
42
$329,497
54
$323,394
9
$316,396
2
$34,740,665
6
$313,695
FILES CLOSED FOR INCOMPLETENESS
10
$358,218
12
$413,885
4
$53,595
0
$0
4
$173,828
Aggregated Statistics For Year 2006 (Based on 6 full and 8 partial tracts)
B) Conventional Home Purchase Loans
C) Refinancings
D) Home Improvement Loans
E) Loans on Dwellings For 5+ Families
F) Non-occupant Loans on < 5 Family Dwellings (A B C & D)
Number
Average Value
Number
Average Value
Number
Average Value
Number
Average Value
Number
Average Value
LOANS ORIGINATED
481
$313,815
305
$305,267
40
$176,506
12
$1,641,925
62
$436,550
APPLICATIONS APPROVED, NOT ACCEPTED
55
$356,529
61
$364,685
10
$65,160
0
$0
6
$816,493
APPLICATIONS DENIED
121
$360,023
122
$341,827
29
$132,681
0
$0
24
$530,831
APPLICATIONS WITHDRAWN
70
$360,128
96
$321,987
7
$227,976
0
$0
8
$397,038
FILES CLOSED FOR INCOMPLETENESS
18
$305,679
28
$372,641
3
$178,373
0
$0
0
$0
Aggregated Statistics For Year 2005 (Based on 6 full and 8 partial tracts)
B) Conventional Home Purchase Loans
C) Refinancings
D) Home Improvement Loans
E) Loans on Dwellings For 5+ Families
F) Non-occupant Loans on < 5 Family Dwellings (A B C & D)
G) Loans On Manufactured Home Dwelling (A B C & D)
Number
Average Value
Number
Average Value
Number
Average Value
Number
Average Value
Number
Average Value
Number
Average Value
LOANS ORIGINATED
630
$310,128
397
$261,792
33
$109,829
0
$0
72
$307,306
1
$328,160
APPLICATIONS APPROVED, NOT ACCEPTED
85
$326,752
43
$274,439
13
$81,044
2
$200,645
5
$209,468
0
$0
APPLICATIONS DENIED
131
$357,340
116
$339,310
32
$103,814
0
$0
17
$325,261
2
$283,090
APPLICATIONS WITHDRAWN
78
$375,435
100
$299,568
6
$111,047
2
$99,330
17
$288,145
0
$0
FILES CLOSED FOR INCOMPLETENESS
22
$274,706
67
$331,112
1
$41,650
0
$0
2
$218,525
0
$0
Aggregated Statistics For Year 2004 (Based on 6 full and 8 partial tracts)
B) Conventional Home Purchase Loans
C) Refinancings
D) Home Improvement Loans
E) Loans on Dwellings For 5+ Families
F) Non-occupant Loans on < 5 Family Dwellings (A B C & D)
Number
Average Value
Number
Average Value
Number
Average Value
Number
Average Value
Number
Average Value
LOANS ORIGINATED
560
$288,361
432
$230,154
33
$148,357
5
$2,343,198
55
$321,752
APPLICATIONS APPROVED, NOT ACCEPTED
62
$334,730
101
$247,101
10
$106,510
0
$0
19
$330,180
APPLICATIONS DENIED
97
$306,030
160
$269,128
36
$139,250
0
$0
24
$342,358
APPLICATIONS WITHDRAWN
44
$237,927
85
$244,946
11
$168,645
2
$2,301,040
11
$301,479
FILES CLOSED FOR INCOMPLETENESS
21
$561,337
40
$337,813
8
$196,404
0
$0
3
$232,170
Aggregated Statistics For Year 2003 (Based on 6 full and 8 partial tracts)
A) FHA, FSA/RHS & VA Home Purchase Loans
B) Conventional Home Purchase Loans
C) Refinancings
D) Home Improvement Loans
F) Non-occupant Loans on < 5 Family Dwellings (A B C & D)
Number
Average Value
Number
Average Value
Number
Average Value
Number
Average Value
Number
Average Value
LOANS ORIGINATED
2
$141,050
590
$254,977
1,232
$186,258
12
$44,688
82
$226,754
APPLICATIONS APPROVED, NOT ACCEPTED
0
$0
60
$276,677
183
$207,193
18
$72,342
14
$264,731
APPLICATIONS DENIED
4
$250,808
77
$256,281
222
$236,128
29
$28,838
27
$273,319
APPLICATIONS WITHDRAWN
2
$346,660
59
$312,769
195
$230,038
9
$99,333
11
$271,073
FILES CLOSED FOR INCOMPLETENESS
0
$0
15
$292,633
43
$229,380
5
$115,584
9
$214,626
Aggregated Statistics For Year 2002 (Based on 6 full and 8 partial tracts)
A) FHA, FSA/RHS & VA Home Purchase Loans
B) Conventional Home Purchase Loans
C) Refinancings
D) Home Improvement Loans
E) Loans on Dwellings For 5+ Families
F) Non-occupant Loans on < 5 Family Dwellings (A B C & D)
Number
Average Value
Number
Average Value
Number
Average Value
Number
Average Value
Number
Average Value
Number
Average Value
LOANS ORIGINATED
1
$165,240
517
$220,253
671
$179,798
48
$99,782
5
$3,620,944
52
$204,891
APPLICATIONS APPROVED, NOT ACCEPTED
0
$0
61
$264,554
136
$190,114
9
$63,659
0
$0
22
$267,017
APPLICATIONS DENIED
0
$0
57
$268,534
179
$167,493
38
$82,123
0
$0
13
$239,445
APPLICATIONS WITHDRAWN
0
$0
47
$246,870
160
$195,149
3
$53,077
0
$0
15
$194,543
FILES CLOSED FOR INCOMPLETENESS
0
$0
8
$250,560
42
$210,086
0
$0
0
$0
3
$109,867
Aggregated Statistics For Year 2001 (Based on 6 full and 6 partial tracts)
A) FHA, FSA/RHS & VA Home Purchase Loans
B) Conventional Home Purchase Loans
C) Refinancings
D) Home Improvement Loans
E) Loans on Dwellings For 5+ Families
F) Non-occupant Loans on < 5 Family Dwellings (A B C & D)
Number
Average Value
Number
Average Value
Number
Average Value
Number
Average Value
Number
Average Value
Number
Average Value
LOANS ORIGINATED
0
$0
545
$191,246
416
$167,687
34
$71,815
1
$1,138,230
29
$187,175
APPLICATIONS APPROVED, NOT ACCEPTED
0
$0
51
$246,132
99
$168,107
12
$57,913
0
$0
13
$242,432
APPLICATIONS DENIED
2
$179,150
55
$196,677
157
$209,257
29
$82,619
0
$0
12
$239,882
APPLICATIONS WITHDRAWN
0
$0
36
$222,534
118
$176,209
10
$63,155
0
$0
3
$215,893
FILES CLOSED FOR INCOMPLETENESS
0
$0
16
$179,526
44
$145,932
5
$99,460
0
$0
2
$49,665
Aggregated Statistics For Year 2000 (Based on 6 full and 8 partial tracts)
A) FHA, FSA/RHS & VA Home Purchase Loans
B) Conventional Home Purchase Loans
C) Refinancings
D) Home Improvement Loans
E) Loans on Dwellings For 5+ Families
F) Non-occupant Loans on < 5 Family Dwellings (A B C & D)
Number
Average Value
Number
Average Value
Number
Average Value
Number
Average Value
Number
Average Value
Number
Average Value
LOANS ORIGINATED
2
$163,895
536
$170,918
145
$130,697
25
$61,830
2
$163,895
31
$153,860
APPLICATIONS APPROVED, NOT ACCEPTED
0
$0
64
$197,273
33
$115,185
18
$59,541
0
$0
10
$75,566
APPLICATIONS DENIED
0
$0
60
$179,642
81
$149,109
23
$46,883
0
$0
7
$145,654
APPLICATIONS WITHDRAWN
0
$0
25
$155,713
111
$117,779
4
$83,000
0
$0
8
$140,796
FILES CLOSED FOR INCOMPLETENESS
0
$0
6
$240,710
21
$158,101
6
$46,685
0
$0
2
$481,750
Aggregated Statistics For Year 1999 (Based on 2 full and 7 partial tracts)
A) FHA, FSA/RHS & VA Home Purchase Loans
B) Conventional Home Purchase Loans
C) Refinancings
D) Home Improvement Loans
F) Non-occupant Loans on < 5 Family Dwellings (A B C & D)
2007 - 2018 National Fire Incident Reporting System (NFIRS) incidents
According to the data from the years 2007 - 2018 the average number of fires per year is 51. The highest number of reported fires - 76 took place in 2017, and the least - 23 in 2007. The data has an increasing trend.
When looking into fire subcategories, the most reports belonged to: Structure Fires (65.2%), and Mobile Property/Vehicle Fires (15.6%).
Fire incident types reported to NFIRS in Zip Code 11360


 Nearest zip codes: 11359, 11361, 11358, 11357, 11363, 11364.


 According to the data from the years 2007 - 2018 the average number of fires per year is 51. The highest number of reported fires - 76 took place in 2017, and the least - 23 in 2007. The data has an increasing trend.
 When looking into fire subcategories, the most reports belonged to: Structure Fires (65.2%), and Mobile Property/Vehicle Fires (15.6%).